Sharif University of Technology
Scientia IranicaTransactions E: Industrial Engineering www.scientiairanica.com
Using group method of data handling to model
customer choice behaviour
B. Zhu
, C.H. He and Y. Niu
Business School, Sichuan University, No. 24 South Section 1, Yihuan Road, Chengdu 610065, China. Received 27 October 2012; received in revised form 23 August 2013; accepted 21 September 2013
KEYWORDS Choice modelling; Group Method of Data Handling (GMDH); Articial Neural Network (ANN); Long-distance communication mode.
Abstract. Choice modelling is valuable for understanding and predicting customer behaviour. This study introduces the Group Method of Data Handling (GMDH) into choice modelling and applies this new technique to model consumer choice in the long-distance communication market. When we compare the GMDH with the Articial Neural Network (ANN) and logit models, the results show that the new model provides better predictions of customer choice than the ANN and logit models. In addition, the new model can identify the important explanatory variables that aect customer choice, and reveal how the variables aect this choice, which cannot be directly accomplished using the ANN model. This advantage will help rms to better analyse the behaviour of their customers and, thereby, develop suitable marketing strategies.
c
2014 Sharif University of Technology. All rights reserved.
1. Introduction
Customer choice modelling is an important topic in market research because it involves predicting customer choice decisions over a set of products (or brands or services) and investigates the factors that inuence the choice behaviour [1,2]. In general, good choice models are valuable assets for marketing managers because these models measure how features of the customer (e.g., demographics, consumption motives), characteristics of the product (e.g., quality or colour) and the marketing mix (e.g., price, promotion or advertisement) inuence customer choice behaviour and how they can result in more eective manage-rial decisions. Therefore, the study of choice mod-elling has gained considerable attention, and mar-keters have used the model to solve many problems, such as brand introduction [3], market
segmenta-*. Corresponding author. Tel: +86 28 85403495; Fax: +86 28 85418891
E-mail addresses: [email protected] (B. Zhu); [email protected] (C.H. He);
[email protected] (Y. Niu)
tion [4] and predictions of the eects of a marketing mix [5].
Traditionally, marketers use statistical tech-niques, such as the logit model, to analyse customer choice [6]. While logit models are easy to understand and build, they usually represent a linear form of the utility function. This may pose a problem, as some customer choices are complex and follow a nonlinear relationship [7]. Therefore, researchers have employed nonlinear models, such as the Articial Neural Network (ANN), in choice modelling. Previous studies have shown that the ANN can produce better predictive accuracy for a variety of choice modelling problems. For example, West et al. [8] found that the ANN provides better predictions of brand choice decisions than both discriminant analysis and the logit model. Other applications of the ANN in choice modelling have been found in Hu et al. [9] and Fish et al. [10], both of which demonstrate the superior predictive performance of the ANN over logit and other statistical methods.
Although the ANN enjoys increasing popularity, it suers from some limitations. In practice, rms not only want to know which product a customer will buy, but also why the customer buys a particular product.
Therefore, in addition to predictive accuracy, rms are also concerned with two key issues of choice modelling: What factors aect customer choice and how do these factors aect customer choice. From the perspective of modelling, the two issues are closely related to ex-planatory variable selection and model interpretability, respectively. In choice modelling, rms attempt to collect many potential explanatory variables. Selecting a proper set of relevant explanatory variables would help to relate important factors to customer choice. However, the ANN cannot select the input variables directly. One solution to variable selection for the ANN is heuristic, whereby an individual variable is added or removed each time to determine if there is improved performance [11]. Another solution is to use statistical devices, such as a logit model, for variable selection before feeding the selected variables into the ANN [12]. The former method, however, is computationally expensive and the latter causes potential bias. On the other hand, researchers typically treat the ANN as a black-box. Marketers can only get predictions of customer choice and cannot understand the relationship among variables. Hence, rms need some methods for choice modelling that can preserve the capability of nonlinear modelling and provide better interpretation in practice.
This study presents a new method for choice modelling based on a Group Method of Data Handling (GMDH); an inductive modelling method proposed by Ivakhnenko [13]. The GMDH has the same capability of nonlinear modelling as the ANN. Meanwhile, one of the main advantages of the GMDH model over the ANN is that the method can automatically select signicant explanatory variables from a large number of candidate independent variables [14]. In addition, the new method provides better model interpretability. Furthermore, the GMDH method yields an explicit representation of the choice model [15] and presents a better explanation than the ANN for marketers to understand customer choice behaviour. Although the GMDH has been applied to many real-world data mining applications in recent years, to the best of our knowledge, no research has been reported that applies the GMDH to choice modelling. To verify the eec-tiveness of the GMDH model in choice modelling, this paper conducts an empirical study on consumer choice in the long-distance communication market. Building a good choice model is valuable for telecommunication companies, as a good model can provide precise choice predictions and evaluate the factors that inuence customer choice among various communication modes. A successful choice model can help rms focus on the target customer segments and enhance competence. The empirical results show that the GMDH obtains improved predictions over the ANN and logit model. More importantly, the GMDH model helps rms to
identify critical driving factors in the long-distance communication mode choice, and to reveal how these driving factors inuence the choice; a process that cannot be accomplished directly by ANN.
The rest of the paper is organised as follows. Section 2 briey introduces the GMDH. Section 3 describes in detail how to use the GMDH to build a choice model. Sections 4 and 5 illustrate the problem of customer choice in the long distance communication market and present the results of the empirical study, respectively. Finally, Section 6 concludes the paper.
2. The GMDH method
The GMDH is an inductive modelling method that constructs a hierarchical (multi-layered) network struc-ture to identify complex input-output functional re-lationships from data. The method was rst devel-oped by Ivakhnenko as a multivariate analysis method for complex system modelling and identication in the 1960s [13]. During the 1980s, its theoretical background was formulated [16]. Later, consider-able improvements were introduced in versions of the polynomial network training algorithms (PNETTR) by Barron [17], and the Algorithm for Synthesis of Polynomial Networks (ASPN) by Elder and Brown [18]. In the 1990s, Lemke and Mueller [19] further developed the GMDH algorithm into the self-organising data mining algorithm. Since the beginning of the 2000s, many researchers have used computational intelligence technology, such as genetic algorithms [20], to optimise the network structure of the GMDH model. Now, the GMDH has many successful applications in dierent domains, such as economics [21], engineering [22] and chemistry [23], etc.
The process of the GMDH is analogous to the natural evolution of wheat. To obtain wheat with a certain property, a large number of wheat varieties that may possess this property are sown. From the harvest of the rst generation, the wheat varieties that better satisfy the requirements, compared to the other varieties, are chosen, and the seeds of the selected wheat are sown again. From the second harvest, certain seeds are once again selected and sown. After several generations, some wheat will be generated in which the desired property is more dominant than in others.
Similarly, the process of the GMDH is a self-organising process based on synthesizing models of increasing complexity, and selection of the best solution by external criterion. The GMDH rst produces some simple elementary models by reference functions and uses them as initial input models at the start of the modelling process. After generating a large number of competitive models from the initial input models (in-heritance), the algorithm selects certain more optimal intermediate models (selection), such that a large
num-ber of new competitive models are generated by these intermediate models. Such procedures of inheritance and selection are repeated until an optimal complex model is created. According to the theory of optimal complexity, as the complexity of the model increases, the value of external criterion usually decreases, rst, and then reaches a minimum; later, it starts to increase again. The GMDH algorithm will stop when the external criterion reaches its minimum and when an optimal complex model is obtained [16].
One characteristic of the GMDH is that the method will yield explicit forms of the models. The GMDH usually utilises Kolmogorov-Gabor (K-G) poly-nomials as the reference functions to produce initial models. Through a procedure of selection and com-bination, the GMDH will generate many intermediate models, as well as the nal optimal complex model, in the form of multivariate polynomials, which yields an explicit and precise mathematical input-output relationship.
Another advantage of the GMDH is that the method can automatically select the input variables. The modelling process of the GMDH is iterative. Starting from simple elementary models produced by reference functions, the intermediate models, with dierent variables, are generated. The models yielding better external criteria are selected, as they contain inputs that have a better ability to explain or predict the output. The input variables from the selected models are used to construct more complex models of subsequent layers. As the modelling process proceeds, the number of variables in the model candidates in-creases. The procedure will stop when the external criterion reaches its minimum and the optimal complex model with the most eective set of input variables is created. In this way, the algorithm can automatically determine the key input variables and exclude the irrelevant input variables [14].
3. Choice modelling based on GMDH
In customer choice modelling, one attempts to create a model that predicts which product (or brand or service) a customer will buy, and which explains why the customer buys it, on the basis of a number of features of the customer, the product, and the situation in which the purchase occurs. This study assumes that customers, when faced with a choice situation, examine a set of p mutually exclusive alternatives and then choose one of the alternatives. Suppose the rm has a data set, D, with n observations, D = fxi; yigni=1. The
dependent variable, yi2 f1; : : : ; pg, indicates customer
choice. A d-dimensional feature vector, xi 2 Rd,
describes the customer, the product and the situation. The objective of choice modelling is to nd the key explanatory variable, si xi, and learn a model,
f, that predicts the choice of each observation, yi,
correctly, with feature vector, xi.
According to the basic idea of the GMDH, this study proposes a new approach to building the choice model. The main steps are as follows:
1. Divide dataset for model training, D, into two disjoint subsets of the same size: D = B [ C.
2. Combine input variables in pairs (xj; xk), 1 j,
k d, and generate model candidates from each combination using the following quadratic polyno-mial:
y =c0+ c1xj+ c2xk+ c3xjxk
+ c4x2j+ c5x2k; (1)
where c0; c1; c5 are parameters to be estimated
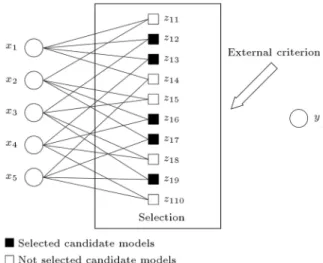
by the Ordinary Least Square (OLS) method. For example, if people use x1; x2; x5 as the input
variables to estimate the output variable, y, then 10 model candidates are produced in Figure 1 and input variables, x1 and x2, will be combined to
produce the model candidate, z11, as follows:
z11=c0+ c1x1+ c2x2+ c3x1x2
+ c4x21+ c5x22: (2)
3. Evaluate the external criterion of each model using the Systematic Regularity criterion, (SR) [15], as follows:
SR =X
i2C
yi ^yCi
2+X i2B
yi ^yiB
2; (3)
where yi is the actual output, and ^yCi and ^yiB are
the estimated outputs of the models constructed on datasets B and C, respectively. Record the minimum of the external criterion, Rl, from the
current layer.
Figure 1. Generation and selection of candidate models in the rst layer.
Figure 2. Generation of optimal complex model.
4. Select Fl best models with lower criterion values
and let their outputs, zlt, be employed as new
input variables for the second layer of the GMDH network. For instance, model candidates that have lower external criterion values, zlt (t = 2; 3; 6; 7; 9),
are selected and used as input variables for the second layer in Figure 1.
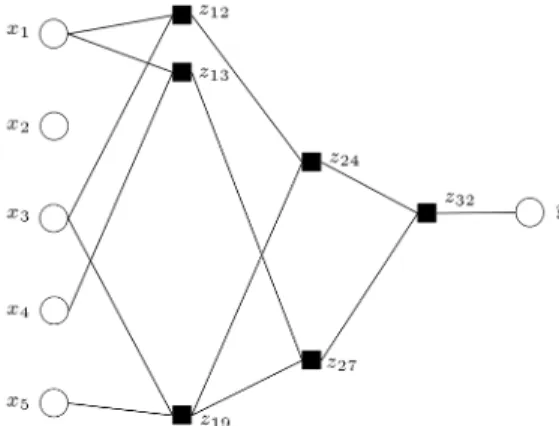
5. Repeat steps 2 through 4 to produce model can-didates of the second layer, the third layer, etc., until the lowest value of the external criterion at the current layer, Rl, is greater than that in the
previous layer. The model with the minimum external criterion at the l 1 layer is then selected as the nal choice. Figure 2 provides an example, where the optimal complex model is obtained at the third layer.
4. Customer choice in the long-distance communication market
In this section, we provide a brief description of the data used in the empirical study, and we then describe the empirical specication.
4.1. Dataset description
This study uses the data from the Sichuan (SC) mobile company of China to build choice models. The SC mo-bile company collected the data via a survey conducted in two cities of the Sichuan province. Customers who use mobile phones for long-distance communication usually have two alternatives: Direct Dialling (DD) or an IP card. The company was particularly interested in customers who use an IP card, because IP card service is more protable and the company wants to promote its usage. Therefore, the purpose of this survey was to study the mode choice behaviour of customers so that rms can appropriately segment the market and develop eective market strategies for the target segments. The survey was done by conducting face-to-face interviews in respondents' homes. During the interviews, the interviewees were asked to select one of the alternatives, according to their actual usage.
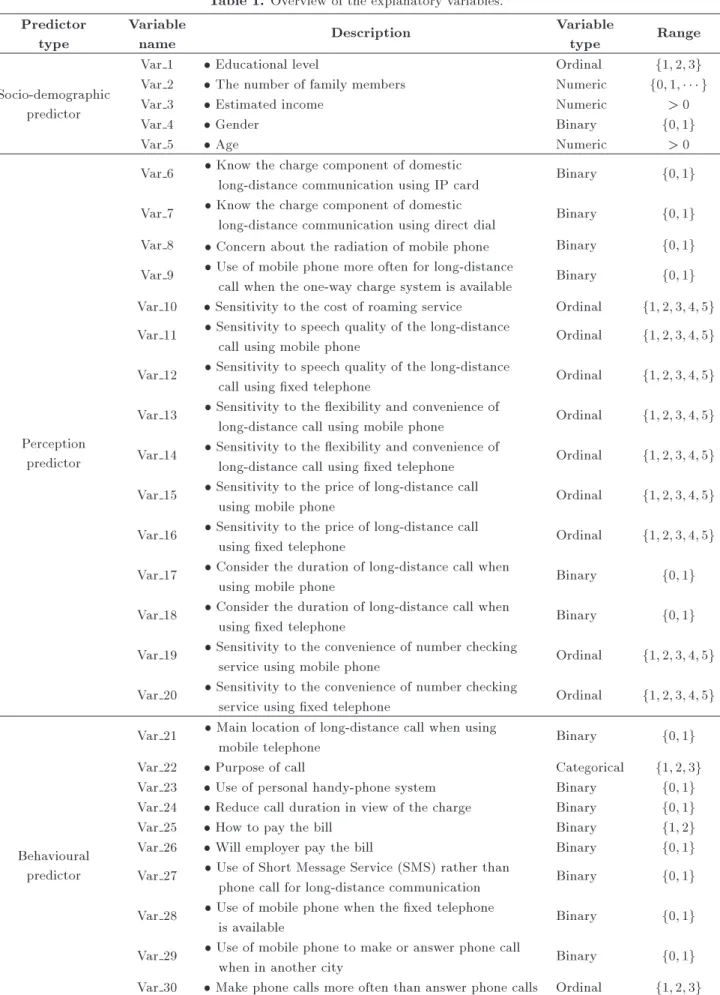
Interviewees who said they did not use a mobile phone for long-distance communication were excluded from the survey at the beginning. To determine the factors that drive consumer choice, the socio-demographic backgrounds, perceptions and/or atti-tudes towards long-distance communication services, along with behavioural information, were obtained from each interviewee. The target population consisted of consumers who use mobile phones for long-distance communication. The sample was a stratied random sample, and respondents were selected from two cities in the Sichuan province. Accordingly, the customers can be divided into strata based on the city from which they came. This yielded 560 respondents, 418 (75%) of whom use DD and 142 (25%) who use an IP card. After excluding variables with too many missing values, the study retained 30 explanatory variables as in Table 1. 4.2. Empirical specication
To verify the eectiveness of the GMDH model in choice modelling, we compared it with two benchmark methods: logit and the ANN model. The logit model has been used extensively in marketing to solve binary or multiple choice problems [6]. Because customers have only two alternatives in our study, the binomial logit model was used. The logit model estimates a posterior probability of customer choice, as follows:
P (yijxi) = 1 + exp[ (1
0+ Txi)]; (4)
where 0 and are parameters to be estimated, which
can be done using maximum likelihood estimation. The ANN model considered in this paper is the multi-layer feed-forward neural network [24], which is the most popular neural network in choice modelling. This type of neural network usually has three layers of units: input layer, hidden layer, and output layer. The input layer consists of one node for each independent variable. The output layer consists of one node for the dependent variable, and connecting these layers is one intermediate layer of nodes that transforms the input into an output. The value from each input node is multiplied by a weight, and the resulting weighted values are added together to produce an input for a node in the hidden layer. The output units respond to the weighted output from the hidden units. The training of the neural network involves determining the weights for the network, and the standard back-propagation algorithm was used in our paper.
Similar to Hu et al. [11], we allow the number of hidden nodes to vary from one to the number of input variables and then select the best, according to the predictive performance. Due to the large number of explanatory variables, a stepwise procedure was used in the logit model and the selected input variables were fed into the ANN model. Because the GMDH model
Table 1. Overview of the explanatory variables. Predictor
type
Variable
name Description
Variable
type Range
Socio-demographic predictor
Var 1 Educational level Ordinal f1; 2; 3g
Var 2 The number of family members Numeric f0; 1; g
Var 3 Estimated income Numeric > 0
Var 4 Gender Binary f0; 1g
Var 5 Age Numeric > 0
Perception predictor
Var 6 Know the charge component of domestic
long-distance communication using IP card Binary f0; 1g Var 7 Know the charge component of domestic
long-distance communication using direct dial Binary f0; 1g Var 8 Concern about the radiation of mobile phone Binary f0; 1g Var 9 Use of mobile phone more often for long-distance
call when the one-way charge system is available Binary f0; 1g Var 10 Sensitivity to the cost of roaming service Ordinal f1; 2; 3; 4; 5g Var 11 Sensitivity to speech quality of the long-distance
call using mobile phone Ordinal f1; 2; 3; 4; 5g Var 12 Sensitivity to speech quality of the long-distance
call using xed telephone Ordinal f1; 2; 3; 4; 5g Var 13 Sensitivity to the exibility and convenience of
long-distance call using mobile phone Ordinal f1; 2; 3; 4; 5g Var 14 Sensitivity to the exibility and convenience of
long-distance call using xed telephone Ordinal f1; 2; 3; 4; 5g Var 15 Sensitivity to the price of long-distance call
using mobile phone Ordinal f1; 2; 3; 4; 5g
Var 16 Sensitivity to the price of long-distance call
using xed telephone Ordinal f1; 2; 3; 4; 5g
Var 17 Consider the duration of long-distance call when
using mobile phone Binary f0; 1g
Var 18 Consider the duration of long-distance call when
using xed telephone Binary f0; 1g
Var 19 Sensitivity to the convenience of number checking
service using mobile phone Ordinal f1; 2; 3; 4; 5g Var 20 Sensitivity to the convenience of number checking
service using xed telephone Ordinal f1; 2; 3; 4; 5g
Behavioural predictor
Var 21 Main location of long-distance call when using
mobile telephone Binary f0; 1g
Var 22 Purpose of call Categorical f1; 2; 3g
Var 23 Use of personal handy-phone system Binary f0; 1g Var 24 Reduce call duration in view of the charge Binary f0; 1g
Var 25 How to pay the bill Binary f1; 2g
Var 26 Will employer pay the bill Binary f0; 1g
Var 27 Use of Short Message Service (SMS) rather than
phone call for long-distance communication Binary f0; 1g Var 28 Use of mobile phone when the xed telephone
is available Binary f0; 1g
Var 29 Use of mobile phone to make or answer phone call
when in another city Binary f0; 1g
Table 2. Holdout sample mode choice estimation results.
Method Hit rate MSE AUC
Overall (%) Type I (%) Type II (%)
Logit 73.81 65.91 76.61 0.1992 0.7534
ANN 76.19 69.18 78.45 0.1783 0.7798
GMDH 77.97 72.72 79.84 0.1639 0.8003
: Statistically signicantly worse than the GMDH model at the 5% level of signicance.
has the capability of variable selection, all 30 predictors were used as input variables.
To test the predictive performance of dierent models, this study followed a traditional approach [25]. The data set was randomly divided into an estimation sample with 75% of the observations, and a test sample with 25% of the observations. The data division was conducted in a stratied manner to ensure that the proportions of IP card users were the same in both estimation and test samples. To avoid bias, the study repeated the data splitting ten times. As we are primarily interested in the out-of-sample performance, we used the test sample to estimate the prediction performance of the models. Hit rate, Mean Square Error (MSE), and the Area Under the receiving op-erating Curve (AUC) are used as the performance measures [26]. Hit rate, which is a common criterion used in choice modelling, is dened as the percentage of times the actual choices are correctly predicted by the model. We considered three types of hit rate criteria: overall, Types I and II. Overall hit rate is the ratio of correctly predicted choices to the total choices. Types I and II hit rates, which provide us with more insights into the model performance in each alternative, are the percentage of correctly predicted choices for IP card and DD, respectively. AUC is one of the best methods for comparing classiers in two-class problems. The MSE is calculated as follows:
MSE =Xn
i=1
(yi ^yi)2=n; (5)
where yi is the actual customer choice and ^yi is the
prediction of customer choice. The average hit rate and MSE over all 10 random test samples were calculated. Because the choice between the two alternatives is unbalanced, that is, the number of DD users is almost three times that of IP card users, which is, in part, based on the fact that the IP card service was a newly introduced service, the number of users was relatively small. A balanced sampling technique was used in the dataset for model training. We randomly oversampled the number of IP card users, such that it was perfectly balanced by the number of DD users on the estimation sample, as Lemmens and Croux [27] have done. Therefore, a dataset with 616 samples was
generated for model training in which there were 313 IP card users and 313 direct dialling users. Our empirical study used the software Matlab. We implemented logit and the ANN in the statistical and neural network toolbox of Matlab, respectively, while we programmed the GMDH methods.
5. Results and discussion
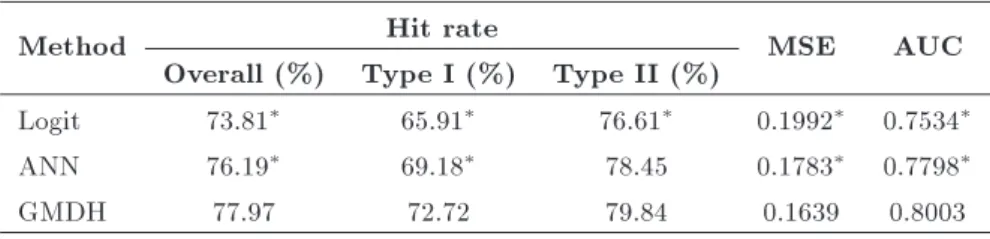
This section applies the new model, based on the GMDH, to a real-world choice modelling problem to evaluate its eectiveness. We primarily look at the forecasting performance and model interpretation. Table 2 provides the predictive performance of dierent models in the empirical study, where the second column presents the overall hit rate, the third and fourth columns report Type I and Type II hit rates, and the fth column gives the MSE.
Table 2 shows that the GMDH provides superior out-of-sample predictions over the ANN and logit models. Let us rst consider the hit rate. The GMDH model achieves the highest overall hit rate of 77.97%, and its Type I and Type II hit rates also perform the best. Meanwhile, the ANN takes second place in terms of hit rate, closely followed by the logit model. One important observation is that the GMDH demonstrates substantial improvement over the ANN and logit models in the Type I hit rate: GMDH has a Type I hit rate of 72.12%, an improvement of approximately 6.21% over the logit model's 65.91%. From a managerial perspective, this improvement is valuable, as the IP card users are the company's target customers. With respect to the MSE, the GMDH performs best and yields the smallest MSE of 0.1639, while the ANN performs slightly worse (0.1783), and the logit model demonstrates the poorest MSE of 0.1992. In addition the biggest value of AUC is also achieved by GMDH and is signicantly better than the ANN and logit model at a 5% level of signicance.
To verify the superior predictive capability of the GMDH over the ANN and logit models, the paired t-test was used. We record the hit rate in the test examples in each realisation of data splitting for every method. For a 10-time realisation of data splitting, we obtain 10 hit rates for each method. The paired
t-test was used to test determine if dierent methods have equal means of hit rate. As Table 2 shows, the performance of the GMDH is signicantly better than that of the ANN and logit models at a 5% level of signicance, in all measures except one. The only exception is that the ANN demonstrates comparable performance with the GMDH in the Type II hit rate. All results verify the good predictive performance of the GMDH.
In addition to the accurate predictive capability, model interpretation is another important aspect for choice modelling. The GMDH model can identify the important explanatory variables that aect customer choice automatically. For example, a model obtained by GMDH in one of the data splitting is as follows:
y =0:14 Var 1 0:66Var 5 + 0:053 Var 21 + 0:51 Var 5 Var 15
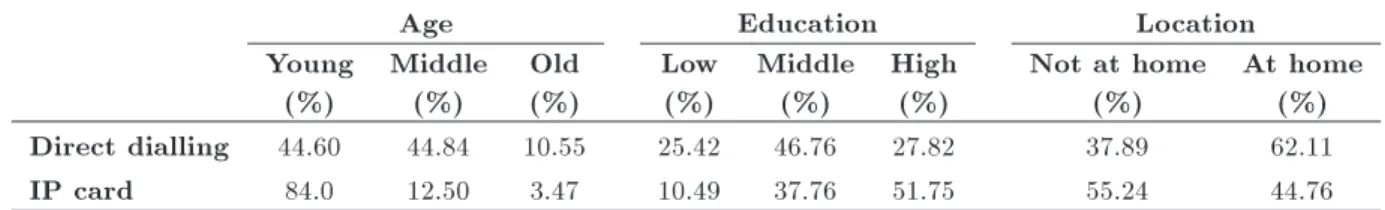
0:084 Var5 Var 21 + 0:24; (6) where the Var 1, Var 5, etc. are explanatory variables, and their descriptions can be found in Table 1. Table 3 presents the ve important terms selected by the GMDH model. As evidenced, the new model identies two demographic variables; Age and Educational level, as well as one behavioural variable, Main location of long-distance call using mobile telephone (Location), as critical factors in the choice of communication mode. Table 4 illustrate the distribution of consumers according to: Age, Educational level and Location, among the IP card and DD user groups.
In the analysis of the factor Age, this study divides the respondents into three aggregate age groups: 18 to 34 years of age (young), 35 to 55 years of age (middle) and 55 years of age and older (old). As Table 4 shows, the IP card users are relatively young. Young
consumers comprise 84.03% of the IP card users, thus, occupying the largest share, whereas the proportion is only 44.60% for DD users. With respect to Educational level, this study also divides the respondents into three aggregate groups: junior middle school and below (low), high middle school (middle), university and above (high).
Table 4 also presents the variations among mode choice as the educational level changes. Consumers with high educational levels account for nearly half of the total IP card users (51.75%), while, at the same time, only one-fourth of the DD users (27.82%) are among those with high educational levels. This observation suggests that when the educational level increases, people tend to use IP cards more often than DD. Table 4 indicates that the Main location of the long distance call has a strong relationship with customer choice. People seem to be more likely to use an IP card when making long-distance calls from home.
To evaluate whether statistically substantial re-lationships exist between the three selected variables and customer mode choice, this study uses two-way contingency tables. The x2 tests yield p-values of
0.002 and 0.021 for Location and Educational level, respectively, while the p-value for Age is less than 0.001. The results indicate we can reject the null hypothesis that customer mode choice between dierent Ages (or Educational level or Location) is not signicantly dierent at the 5% level of signicance. In other words, the results indicate a signicant relationship between the three selected variables and customer choice in the long-distance communication market.
It is also worth noting that there are two non-linear terms selected by the GMDH (see Table 3) that account for the interaction eects between Age and the other two variables. One can view these interactions from two dierent perspectives, depending
Table 3. Terms selected by GMDH model.
No. Term
1 Age
2 Educational level
3 Main location of long-distance call when using mobile telephone 4 Age*main location of long-distance call when using mobile telephone 5 Age*sensitivity to the price of long-distance call using mobile telephone Table 4. The distribution of consumers according to Age, Education and Location.
Age Education Location
Young (%)
Middle (%)
Old (%)
Low (%)
Middle (%)
High (%)
Not at home (%)
At home (%) Direct dialling 44.60 44.84 10.55 25.42 46.76 27.82 37.89 62.11
y = 1
1+exp[ (0:52Var 1 1:46Var 5 1:77Var 7+2:17Var 15 0:94Var 16 0:75Var21 0:65Var 22 + 3:39)]: (7) Box I
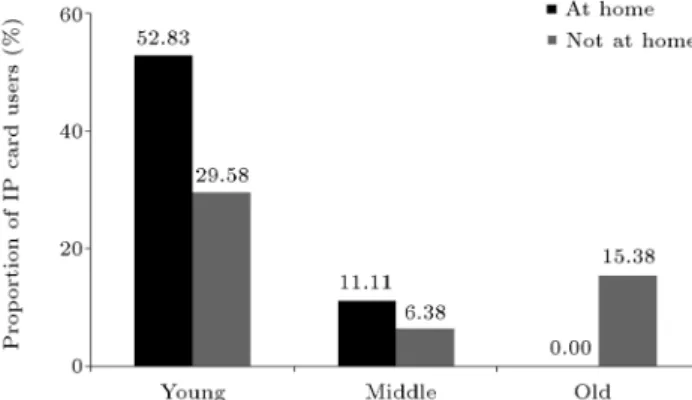
Figure 3. Interaction between the eects of Age and Location on customer choice.
Figure 4. The interaction eect between Age and Price Sensitivity.
on the variable considered. This study analyses the in-teractions mainly from the perspective of Age. Figure 3 gives the proportion of IP card users, with respect to the total users in dierent scenarios (combinations of dierent Age and Location), thus, revealing evidence of the interaction eect between Age and Location. The inuence of Location seems to be much more signicant among young people, as they tend to use IP cards more frequently than people in other age groups when making long-distance calls from home. Figure 4 presents the distribution of price sensitive and non-sensitive IP card users within each age group, thus, indicating that the factor Age has an interaction eect with the price of long-distance calls using mobile phones. As Figure 4 demonstrates, most young IP card users are price sensitive, while, among the other two age groups, price-sensitive users and non-sensitive users are equally distributed. One possible explanation for this is that the demands of the young are more sensitive to the price of the service. The two nonlinear terms oer more insight into the characteristics of
IP card users. The above analysis shows that the selected terms capture the drivers of mode choice in the long-distance communication market, thus, proving a good interpretation from the choice model built by the GMDH. Meanwhile, ANN cannot select the input variables directly, and logit only gives a linear form of the utility function models. For instance, the model obtained by logit in one of the data splittings is represented by Eq. (7) shown in Box I. where the Var 1, Var 5. . . are explanatory variables, whose descriptions can been found in Table 1.
The model built by the GMDH provides some valuable implications; for example, Age, Educational level, Main location of the long-distance call and Price sensitivity drive customer choice in the long-distance communication market. The inuence of the two de-mographic factors (Age and Educational level) supports the ndings of previous research in communication demand [28]. Therefore, rms can develop suitable segmentation strategies based on choice. If the com-pany wants to focus on IP card users, the comcom-pany should know that the main consumer segment consists of young people with high levels of education, that is, students in universities and colleges.
In general, products are created ahead of ex-isting recognized consumer needs in the telecommu-nication industry, and product development is based on customer possible future needs [29]. As a newly-introduced service, young people with higher levels of education are usually the rst user group, because they tend to be aware earlier of the properties of the new technology. When designing market strategies for this segment, rms should keep in mind that customers are price-sensitive and are more likely to use IP cards to make long-distance calls when they are at home. However, this does not mean that we should discard other segments, as marketers can see that some older people or people with lower levels of education also use IP cards. With respect to these groups, they may not be familiar with new technical properties and the purpose or use of these properties. Therefore, the company should utilise appropriate advertising strategies to educate the customers about the use of new services and their properties.
6. Conclusions
This study introduces the GMDH into choice modelling and puts forward a new method to build a choice model. The approach is applied to a real-world
customer choice problem from a telecommunication company. The empirical results show that the new method obtains better results than the ANN model in terms of predictive performance. In addition, the new method sheds some light on the factors that determine customer choice and give explicit form to the choice model, thus, oering a good explanation of customer behaviour and helping companies to better serve their customers. The new method provides a useful tool for marketing research. In the future, we will consider using some computational intelligence technology to optimize the model and improve the predictive performance. In addition, we plan to build a new cost-sensitive external criterion to deal with the issue of class imbalance, instead of the resampling methods used in this paper.
Acknowledgments
This work is supported by the National Natural Sci-ence Foundation of China (Grant No. 71071101 and 71172196), the MOE (Ministry of Education in China) Youth Project of Humanities and Social Sciences (Grant No. 13YJC630249), the specialised Research Fund for the Doctoral Program of Higher Education of the Ministry of Education of China (Grant No. 20120181120074), and the Scientic Research Starting Foundation for Young Teachers of Sichuan University (Grant No. 2012SCU11013).
References
1. Franses, P.H. and Paap, R., Quantitative Models in Marketing Research, Cambridge University Press, Cambridge, UK (2001).
2. Lilien, G.L. and Rangaswamy, A., Marketing Engi-neering: Computer-Assisted Marketing Analysis and Planning, Prentice Hall (2002).
3. Chintagunta, P.K. \Measuring the eects of new brand introduction on inter-brand strategic interaction", Eu-ropean Journal of Operational Research, 118(2), pp. 315-331 (1999).
4. Andrews, R.L. and Currimb, I.S. \Recovering and proling the true segmentation structure in markets: an empirical investigation", International Journal of Research in Marketing, 20(2), pp. 177-192 (2003).
5. Chen, T., Sun, B. and Singh, V. \An empirical Investi-gation of the dynamic eect of Marlboro's permanent pricing shift", Marketing Science, 28(4), pp. 740-758 (2009).
6. Andrews, R.L., Ainslie, A. and Currim, I.S. \An em-pirical comparison of logit choice models with discrete versus continuous representations of heterogeneity", Journal of Marketing Research, 39, pp. 479-487 (2002).
7. Papatla, P., Zahedi, M. and Zekic-Susac, M. \Leverag-ing the strengths of choice models and neural networks:
A multiproduct comparative analysis", Decision Sci-ences, 33(3), pp. 433-461 (2002).
8. West, P., Brockett, P.L. and Golden, L.L. \A compara-tive analysis of neural networks and statistical methods for predicting consumer choice", Marketing Science, 16(4), pp. 370-391 (1997).
9. Hu, M.Y., Shanker, M. and Hung, M.S. \Estimation of posterior probabilities of consumer situational choices with neural network classiers", International Journal of Research in Marketing, 16(4), pp. 307-317 (1999).
10. Fish, K.E., Johnsonb, J.D., Dorseyb, R.E. and Blod-gett, J.G. \Using an articial neural network trained with a genetic algorithm to model brand share", Journal of Business Research, 57(1), pp. 79-85 (2004).
11. Hu, M.Y., Shanker, M., Hung, M.S. and Zhang, G.P. \Modeling consumer situational choice of long distance communication with neural networks", Decision Sup-port Systems, 44(4), pp. 899-908 (2008).
12. Dasgupta, C.G., Dispensa, G.S. and Ghose, S. \Com-paring the predictive performance of a neural network model with some traditional market response models", International Journal of Forecasting, 10(2), pp. 235-244 (1994).
13. Ivakhnenko, A.G. \The group method of data handling - a rival of the method of stochastic approximation", Soviet Automat. Contr., 1-3, pp. 43-55, (1968)
14. Mueller, J.A. and Lemke, F., Self-Organizing Data Mining: An Intelligent Approach to Extract Knowledge from Data, Libri Books: Berlin, Hamburg (2000).
15. Madala, H.R. and Ivakhnenko, A.G., Inductive Learn-ing Algorithms for Complex Systems ModelLearn-ing, CRC Press, Boca Raton, USA, FL. (1994).
16. Stepashko, V.S. and Yurachkovskiy, Y.P. \The present state of the theory of the group method of data han-dling", Soviet Journal of Automation and Information Sciences c/c of Avtomatika, 19(4), pp. 36-46 (1986).
17. Barron, A.R. and Barron, R.L. \Statistical learning networks: A unifying view", 20th Symposium on the Interface: Computing Science and Statistics, American Statistical Association, Washington, D.C, pp. 192-203 (1988).
18. Elder, J.F. and Brown, D.E. \Induction and poly-nomial networks", Proceeding of Network Models for Control and Processing, Induction and Polynomial Networks, Intellect Books, Exeter, UK, pp. 143-198 (2000).
19. Lemke, F. and Mueller, J. \Self-organising data min-ing", Systems Analysis Modelling Simulation, 43(2), pp. 231-240 (2003).
20. Oh, S. and Pedrycz, W. \The design of self-organizing polynomial neural networks", Information Sciences, 141(3-4), pp. 237-258 (2002).
21. Mehrara, M., Moeinib, A., Ahraria, M. and Erfani-fardet, A. \Investigating the eciency in oil futures market based on GMDH approach", Expert Systems with Applications, 36(4), pp. 7479-7483 (2009).
22. Najafzadeh. M. and Barani, G.A. \Comparison of group method of data handling based genetic program-ming and back propagation systems to predict scour depth around bridge piers", Scientia Iranica, 18(6), pp. 1207-1213 (2012).
23. Ghanadzadeh, H., Ganji, M. and Fallahi, S. \Mathe-matical model of liquid-liquid equilibrium for a ternary system using the GMDH-type neural network and genetic algorithm", Applied Mathematical Modelling, 36(9), pp. 4096-4105 (2012).
24. Haykin, S., Neural Networks: A Comprehensive Foun-dation, New Jersey, Prentice Hall (1999).
25. Guadagni, P. and Little, J.D. \A logit model of brand choice calibrated on scanner data", Marketing Science, 2(3), pp. 203-238 (1983).
26. Fawcett, T. \An introduction to ROC analysis", Pat-tern Recognition Letters, 27, pp. 861-874 (2006).
27. Lemmens, A. and Croux, C. \Bagging and boosting classication trees to predict churn", Journal of Mar-keting Research, 48, pp. 276-286 (2006).
28. Ahn, H. \A nonparametric method of estimating the demand for mobile telephone networks: An application to the Korean mobile telephone market", Information Economics and Policy, 13(1), pp. 95-106 (2001).
29. Gerstheimer, O. and Lupp, C. \Needs versus technol-ogy - the challenge to design third-generation mobile applications", Journal of Business Research, 57(12), pp. 1409-1415 (2004).
Biographies
Bing Zhu received MS and PhD degrees, in 2008 and 2011, respectively, from Sichuan University, Chengdu, China, where he is currently a Lecturer at the Business School. His research interests are focused on customer relationship management and business intelligence, and he has published a number of papers in a wide range of international journals in this area.
Changzheng He received his MS degree in Math-ematics from Southwest China Normal University, Chongqing, China, and is currently Professor of Busi-ness School at Sichuan University, Chengdu, China. His research interests include data mining, forecasting and knowledge discovery in customer relationship man-agement. He has published extensively in these areas in various conferences and journals, including Knowledge-based Systems, Journal of Forecasting, Information Science, etc. He has also been member of numerous conference program committees in the area of inductive modeling.
Yongge Niu obtained a PhD degree in Marketing from the School of Business at Sichuan University, China, where he is currently Associate Professor of Marketing. He is also consultant for a number of corporations and a frequent media commentator on issues relating to consumer behaviour. He has published extensively in various journals of marketing, including the Journal of Business Research, etc.