Vol. 107: 245-262, 1994 1 MARINE ECOLOGY PROGRESS SERIES
Mar. Ecol. Prog. Ser. Published April 28
Relating plankton assemblages to environmental
variables using instruments towed by ships-of-
opportunity
J. A.
Lindley,
R.
Williams
Plymouth Marine Laboratory, Prospect Place, Plymouth PL1 3DH, United Kingdom
ABSTRACT: Undulating Oceanographic Recorders (UORs) a n d Continuous Plankton Recorders (CPRs) equipped with a suite of sensors were towed by merchant vessels in the North Sea between 1988 a n d 1991, recording a range of environmental variables. These w e r e used to interpret the results of analy- ses of the plankton taken o n CPR tows off the northeast coast of the UK in 1989 a n d in the Skagerrak and Kattegat in July 1988 a n d through 1989. Correlations were found between the biota and the envi- ronmental variables. The tidal front off the northeast coast of the UK a n d the front between the low salinity water in the Kattegat and the higher salinity water in the Skagerrak were dominant factors correlating with the distnbution of the plankton assemblages. Discontinuities, defining the positions of the fronts, in the values of physical variables (temperature a n d , where measured, sallnity and t u r b ~ d - ity) were closely identified w ~ t h geographical divisions between plankton assemblages. Measures of irradiance were found to be important on several occasions, presumably due to die1 migrations of the zooplankton.
KEY WORDS: Plankton . Environment . Instrumentation - North Sea . Skagerrak . Kattegat
INTRODUCTION
Continuous Plankton Recorders (CPRs) have been towed by ships-of-opportunity to study variations in the distributions and abundance of the plankton for over 60 yr (Colebrook e t al. 1991) with unbroken time series of data from 1947 to the present from the North Sea. Undulating Oceanographic Recorders (UORs) have been deployed from ships-of-opportunity inter- mittently since 1979, recording environmental vari- ables and plankton in deployments in the English Channel (Aiken 1981b) and environmental variables only during deployments in the western North Sea and between Iceland and Portugal during 1989 to 1991 (Williams & Aiken 1990).
Environmental variables have been measured on some CPR tows since 1965. Mechanical thermographs were installed on CPRs deployed on selected routes in the North Sea from 1965 and from 1974 these were succeeded by electronic instrumentation logging on miniature analogue tape recorders (Aiken 1980). The
development of a suite of sensors (e.g. Aiken 1981b, Aiken & Bellan 1986) and solid state data loggers resulted in a robust instrument package (now mar- keted by Chelsea Instruments as ~ q u a p a c k ~ ~ ) which has been deployed from a n Ocean Weather Ship in 1987 (Pattiaratchi e t al. 1989) and on selected routes in the North Sea since 1987 (Williams & Aiken 1990). Similar instrumentation in Undulating Oceanographic Recorders (UORs) (Aiken 1981a) was deployed on a route off the northeast coast of the UK from late winter
to autumn of 3 yr, 1989 to 1991.
The data generated by the CPR survey have been used to define geographical groupings of plankton taxa and groups of species with similar patterns of seasonal or interannual variations in abundance. Cole- brook e t al. (1961) and Colebrook (1964, 1972) derived groups of species or higher taxa classified according to their long-term mean distributions using 1" latitude X
2" longitude rectangles a s the basic geographical unit. Colebrook (1964, 1984, 1991) grouped species accord- ing to their mean seasonal cycles of occurrence over
O Inter-Research 1994
large areas. Reid et al. (1983), Robinson et al. (1986) a n d Williams et al. (1993) have used areas smaller than the 2" X 1" rectangles to describe the distributions and seasonal cycles within restricted sub-areas of the CPR survey area. Distributions of individual species along single CPR tows were described in many early papers on the CPR survey (e.g. Lucas 1942, Rae & Rees 1947) a n d in descriptions of exceptional events in restricted areas (e.g. Robinson 1968, Lindley et al. 1990). The present paper demonstrates the analysis by cluster analysis and multi-dimensional scaling of assemblages of CO-occurring taxa along single CPR tows traversing frontal areas through a seasonal cycle and relating the distributions to the data from the data loggers in instru- mented CPRs a n d UORs by application of recently developed techniques.
Plankton records were successfully taken with CPRs, usually with instrumentation, on the route between Grimsby and Aberdeen, UK, (LR route, see Fig. 1) in 11 mo of the year 1989. UORs were towed on 8 occa- sions between March and October of the same year. The simultaneous collection of plankton samples and physical data has provided a n opportunity to analyse assemblages in the plankton over a seasonal cycle in relation to environmental variables. This route crosses the tidal front, between permanently mixed water to the south and seasonally thermally stratified water to the north, off Flamborough Head, NE England (see Pingree & Griffiths 1978). At the northern end of this route the waters near the Scottish coast are transitional
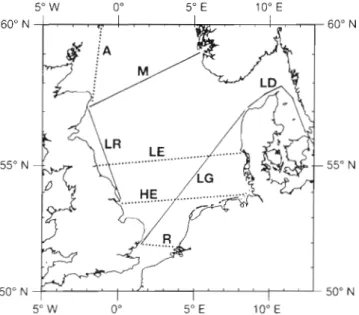
Fig. 1. Standard routes of the CPR survey in the North Sea in 1989. Continuous lines indicate routes on which instrumented CPRs were deployed (i.e. environmental variables were measured on the same tow). Dotted llnes indicate routes where CPRs sampled plankton only. UORs were towed on
the LR route
between mixed and seasonally thermally stratified (Williams & Lindley in press). A contrasting route on which instrumented CPRs were deployed passed through a front between low salinity water in the Kattegat and higher salinity water in the Skagerrak (the LD route, see Fig. 1). The Kattegat waters near the Swedish coast have suffered from eutrophication attributed to increasing nutrient supply (Andersson & Rydberg 1993). This route was sampled from January to May and in October and November 1989 and data from a tow in July 1988 was analysed as well to repre- sent summer conditions. The front is evident here throughout the year but is variable in position (Richardson 1985) whereas the Flamborough front is only detectable during that part of the year when the waters are thermally stratified.
METHODS
Continuous Plankton Recorders (CPRs) (Edinburgh Oceanographic Laboratory 1973) are towed by mer- chant vessels and Ocean Weather Ships on standard routes at a n average depth of 6.7
*
1.7 m (Hays & Warner 1993). The towing speeds on the routes for which data are presented here were usually about 7.0 to 9.0 m S-' (- 14 to 17 knots). The plankton is collected on a moving band of silk gauze with mesh aperture size of about 285 X 315 pm which is divided into sec- tions representing the plankton retained from 3 m3 of water during 16 km of tow. The plankton are analysed as described by Rae (1952) and Colebrook (1960). Usu- ally only alternate blocks are analysed. The standard routes in operation in the North Sea during 1989 are shown in Fig. 1.Undulating Oceanographic Recorders (UORs) are
also towed by ships-of-opportunity. Whereas the CPRs
are dispatched to the towing vessels by commercial road transport and are towed unaccompanied by sci- entific staff, the deployment of UORs was supervised
by a member of the Plymouth Marine Laboratory staff.
On the LR route (Fig. 1) undulation between 3 and 23 m depth in each 1.6 km of tow provided data on the vertical distribution of environmental variables along the tow track. The deployment of the UOR on the southern part of the route was restricted by shallow water so deployment was limited to areas north of 53" 50' to 54" 00' N whereas the CPRs were usually deployed from 53" 38' N . The UORs were towed on this
route from March to October in 1989 and 1990 and
from February to August 1991
The instrumentation for recording environmental variables during tows of the CPRs in 1989 consisted of sensors for depth, temperature, conductivity, chloro- phyll fluorescence a n d downwelling and upwelling
Lindley & Williams: Planktc )n assemblages in the North S e a 247
irradiance at 450 pm (blue) and 550 pm (green). The UORs also had instruments for recording turbidity and upwelling and downwelling radiation at 410 pm (vio- let). Not all the sensors were in used on all tows. Data used for analyses in conjunction with the plankton results are listed with the results of the analyses in Table 4. For most of the tows with the CPR, data were logged at 30 s intervals, while 12 s or 6 s intervals were used with the UOR. Williams & Aiken (1990) give fur- ther information on the deployment on UORs and instrumented CPRs during 1989. During 1989 the fluo- rometers for measuring chlorophyll concentration were calibrated using acetone extracts of chlorophyll, not in vivo material.
Data for both phytoplankton and zooplankton were included in the analysis of plankton data. The 'accepted values' (Colebrook 1960) of the total num- bers per sample of zooplankton taxa were used. Due to the mesh aperture of the sampling gauze, sampling of phytoplankton taxa by the CPR gives only a measure of relative variations of abundance within taxa. This, combined with the very small sub-sample size for phytoplankton, would result in the more quantitative zooplankton sampling being given less weight than the phytoplankton data if total numbers per sample of the latter were used. To incorporate the phytoplankton into the analysis the 'accepted value' for the numbers of cells seen in the sub-sample was used. In the case of both the phytoplankton and the zooplankton, taxa which occurred in only small numbers (1 to 3 observed in relevant stage of analysis) in single or few scattered samples were excluded.
The analysis of the plankton data followed the pro- cedure described by Field et al. (1982). Matrices of Bray-Curtis coefficients were calculated for the sirni- larities between the taxa occurring within samples and the distributions of taxa between samples for each tow. A dendrogram and a 2-dimensional scatter plot were derived from each matrix, the former by nearest- neighbour clustering method and the latter by non- metric multi-dimensional scaling (MDS). Groupings of samples and of taxa which could be identified from both the dendrogram and the scatter plot were inter- preted as indicating areas with different plankton assemblages and the composition of different assem- blages respectively. The reliability of the scatter plots was indicated by the stress coefficient (if the value is < 0.15 then the 2-dimensional plot is a good represen- tation of the relationships described). The taxa in- cluded in at least l analysis are listed in Table 1.
Where environmental variables were measured by instruments on the same CPR tow as the plankton data were collected ('instrumental CPRs'), the mean value of each recorded variable was calculated for each 16 km section of tow, corresponding to the plankton
samples, using a program written by D. Adams (Ply- mouth Polytechnic, pers. comm.). Water depth and, on the LR route, the stratification parameter ( h l U 3 , where
h = water depth in cm and U = tidal stream velocity in cm S-'; Pingree & Griffiths 1978) at the mid-sample position were incorporated into the analysis in addition to the recorded data. The stratification parameter was not used on the LD route as stratification in the Katte-
gat is a permanent halocline, rather than a seasonal thermocline, developing in otherwise homogeneous conditions where depth and tidal stream velocity per- mit. On tows on the LR route where no instrumental data were available but a UOR tow took place within 2 wk of the CPR tow, the values of variables at the mid- sample latitude on the UOR tow were used. In addition to the values of variables at the CPR sampling depth the variability over the undulation depth range of the UOR was available.
The relationships between the plankton and the environmental data were analysed using the BIO-ENV program described by Clarke & Ainsworth (1993). This uses rank dissimilarities between samples resulting from the analysis of the biota with equivalent values derived from the environmental data to calculate weighted Spearman rank correlation coefficients. Dif- ferent combinations of environmental variables a r e tested and the combination which gives the highest correlation is taken as the group of variables that 'best explains' the biotic structure.
RESULTS
The data resulting from the deployment of UORs and instrumented CPRs off the northeast coast of the UK (LR route) in 1989 were summarised by Williams & Aiken (1990). Examples of the data a r e shown in Fig. 2 which shows the temperature profiles from the UOR tows in April, June and September. The total variation in temperature over the tow in April was <0.5"C with weak stratification over most of the route. The temper- ature difference between the surface and 21 m was 3 to 5°C over much of the central part of the tow in J u n e but there were smaller differences a t the northern a n d southern ends of the tow. In September significant stratification was evident from the position of the front, near the southern end of the tow to about 56" N . Fig. 3 shows the variables measured by the instrumented CPR tow in July. Comparison of this record with data from the UOR towed on 1 August showed that the abrupt change in temperature at about 2 h into the tow marked the position of the front between well-strati- fied water to the north and more mixed water to the south (see Lindley e t al. 1993). The mixed water to the south of the front was also much more turbid than the
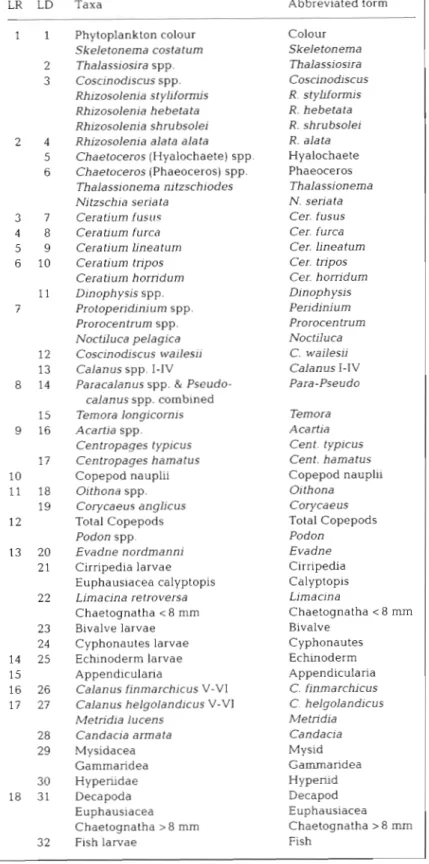
Table 1 . Planktonic taxa included in analyses of assemblages, the numbers used to identify species in the dendrograms and scatter plots in Fig. 8 ( L R ) and Fig. 14 (LD) and the abbreviated form used in Figs. 9 & 15. 'Phytoplank- ton colour' is the assessment of green colouration of the filtering gauze
(Robinson 1970) Taxa Phytoplankton colour Skeletonema costatum Thalassiosira spp. Coscinodiscus spp. Rhizosolenia styliformis Rhizosolenia hebeta ta Rhizosolenia shrubsolei Rhizosolenia alata alata
Chaetoceros (Hyalochaete) spp. Chaetoceros (Phaeoceros) spp. Thalassionema nitzschiodes Nitzschia seriata
Ceratium fusrrs Cera oum furca Ceratium lineaturn Ceratium tripos Ceratium horridurn Dinophysis spp. Protoperidinium spp. Prorocentrum spp. Noctiluca pelagica Coscinodiscus wailesii Calanus spp. I-IV
Paracalanus spp. & Pseudo- calanus spp. combined Temora longicornis Acartia spp. Centropages typicus Centropages hamatus Copepod nauplii Oithona spp. Corycaeus anglicus Total Copepods Podon spp Evadne nordmanni Cirripedia larvae Euphauslacea calyptopis Limacina retroversa Chaetognatha < 8 mm Bivalve larvae Cyphonautes larvae Echinoderm larvae Appendicularia
Calanus finmarchicus V-V1 Calanus helgolandicus V-V1 Metnd~a lucens
Candacia armata Mysidacea Gammaridea Hyperiidae Decapoda Euphausiacea Chaetognatha > 8 mm Fish larvae
Abbreviated form Colour Skeletonerna Thalassiosira Coscinochscus R. stylifonnis R. hebetata R. shrubsolei R. alata Hyalochaete Phaeoceros Thalassionema N. send ta Cer. fusus Cer furca Cer. Iineatum Cer. tripos Cer. honidurn Dinoph ysis Peridinium Prorocen trurn Noctiluca C. wailesii Calanus I-IV Para-Pseudo Temora A cartia Cent. typicus Cent. harnatus Copepod nauplii Oithona Corycaeus Total Copepods Podon Evadne Cirripedia Calyptopis L~mac~na
Chaetognatha c 8 mm Bivalve Cyphonautes Echinoderm Appendicularia C. finmarchicus C. helgolandicus Metndia Candacia M y s i d Garnmaridea Hyperiid Decapod Euphausiacea Chaetognatha > 8 mm Fish
water in the stratified area to the north (Fig. 4). The temperature data from the instrumented CPRs revealed well-defined changes in temperature at the approxi- mate position of the front even in winter when the water is fully mixed on both sides of the front. The magnitude of these changes was, in many cases, small in comparison with the variation over the whole route. The position of these dis- continuities could not be defined with certainty in temperature data averaged to correspond to the 16 km plankton sam- ples (Fig. 5).
The dendrograms and MDS plots of the samples were used to group the samples containing similar plankton assemblages in each month. On the LR route geograph- ically coherent groups of samples were identified in all months except January, June, November and December. Limited sampling in J u n e (Newcastle to Aberdeen only) meant that this tow was not compa- rable to those in other months. In January, November and December the plankton was sparse and so the analyses of the data were weighted by more or less random occurrences. For the other months the most northerly sample and any samples grouped with it were arbitrarily defined a s 'Area A', the next group of samples to the south were called 'Area B' and so on. Where the groups delineated in this way could be sub-divided then the sub-areas were indicated by appending 1 and 2 to the letter identifying the area to the most northerly and most southerly sub-areas respectively.
The mean positions of the 11 samples analysed on the LR route and the range of variation of these in 1989 are given in Fig. 6. An example of the dendrogram and MDS plot for July 1989 is shown in Fig. 7. The groupings of samples identi- fied from the analyses a r e shown in Table 2 together with the stress coeffi- cient from the 2-dimensional MDS scatter plot in each case. The results show that sample 21, south of the Flamborough front, was classified as separate from the rest of the samples in May, August, Sep- tember and October. In March it was a sub-area associated with samples 7 to 17 and in April and July it was classified together with the most northerly samples:
Lindley & Williams: Plankton assemblages in the North Sea 249
April 25-26
54 55 N 56
June 20-21
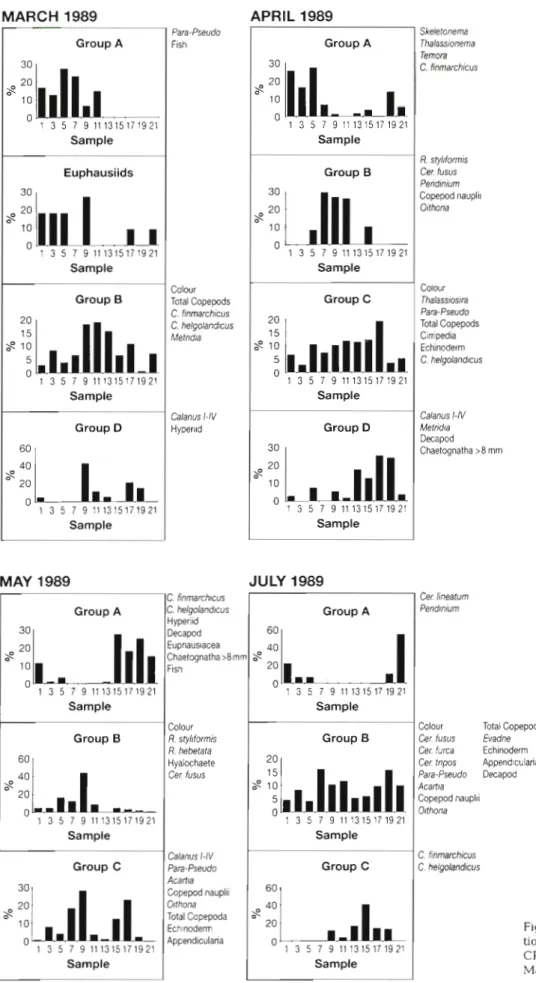
an asseniblage which occurred in the samples taken further south (Area B) at night. The dis- tributions of the groups and their compositions In the other months where geographically coherent patterns were found are shown in Fig. 9. In every month the group which con- tained the most taxa was the most widespread, with the main area of abundance including the
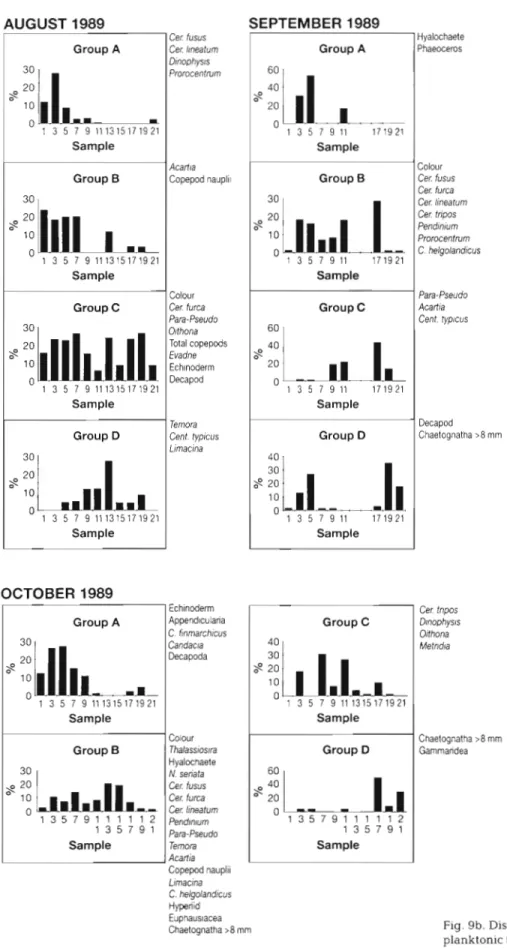
57 central, seasonally stratified waters classified a s Area B. Few taxa were abundant in Area C
in March (sample 19), September and October
(sample 21) and Area A in May (samples 1 and 13) a n d September (samples 1 and 7). In April, when sample 21 was grouped with the Scottish coastal samples (1 and 3), members of a group including diatoms and copepods typically abundant at early stages of the seasonal cycle (Colebrook 1984) were numerous in these sam- ples a n d sample 19 (Area C). A group includ- ing the diatom Rhizosolenia styliformis a n d
3 dinoflagellates which a r e typically most abun-
E
8 dant later in the seasonal cycle than the-
diatoms in Areas A and C (Robinson 1965,13 Colebrook 1984) occurred mainly in Area B1 in
Q,
0 18 the same month. In July, when the 2 ends of
the route were again classified together in the
23 analysis, the dlnoflagellates Ceratium lineatum
54 55 ON 56 57
and Peridiniurn spp. were abundant in samples 1 and 21. The former is mainly oceanic (Robin-
Fig. 2. Contour plots of temperature ('C) on 3 tows of the UOR on the
LR route (see Fig. 1 ) . Contours at 0.1 'C intervals in April, at l.O°C In- 'On lg6'' and in the North Sea may be tervals In June and 0.5"C intervals in September. The hiqhest temper- associated with the inflow of Atlantic water atures ( > ? . l "C in April, > 13.0°C in ~ u n e and > 13.S°C i';l ~ e ~ t e m b e r ) down the east coast of the UK. Adult Calanus are shaded spp. (copepodites V & VI) occurred only in
samples taken at night in that month and in May the larger zooplankton (Calanus spp. V & 1 and 3 in April and 1 only in July. Sample 19, off Flam- VI, hyperiids, decapods, euphausiids, adult chaetog-
borough Head, was classified as separate in March and natha and fish larvae) occurred mainly at night. Later
April, a s part of a group covering most of the central in the year the only assemblage which seemed related part of the tow from May to September and with sam- to night sampling was that comprising Temora longi-
ples 1 a n d 17 in October. Partitioning of the
between and l7 was but Table 2. Continuous plankton recorder samples on the LR route (see and a number Fig. 6) in 1989. Grouping of samples according to the results of cluster
grouped with it were always separate from analysis and MDS ordination. The stress coefficients for the 2-dimen-
the majority of the samples in the central part sional MDS plot (stress) are listed. (For further details see text.) ns: not
of the route. sampled
The analyses of the plankton assemblages along the same route gave groups of differing size and composition from month to month. An example of a dendrogram and MDS scat- ter plot resulting from the analysis of the data for July is shown in Fig. 8.
In February plankton were sparse in the more northerly samples (Area A) which were taken by day but Calanus spp., Metridia lucens, euphausiids and hyperiids conlprised
1 3 5 7 9 11 13 15 17 19 21 Stress February A A B B B B B B ns ns ns 0.006 March A A A B1 B1 B1 B1 B1 B1 C B2 0.089 April A A B1 B1 B1 B1 B2 B2 B2 C A 0.126 May A B1 B1 B1 B1 B1 A B2 B2 B2 C 0.083 July A B1 B2 B1 B1 B1 B1 B1 B1 B1 A 0.100 August A A A A B1 B1 B1 B1 B1 B2 C 0.125 September A B1 B1 A B2 B2 ns ns B2 B2 C 0.076 October A B B B B B B B A A C 0.087
July 1989 LR route
Fig. 3. Results from in- strumentation in a CPR towed on the LR route (see Fig. 1) on 18 and 19 July 1989. The CPR was deployed at 17:45 h GMT; m i d n ~ g h t was 375 min after the start of the
record
Minutes Minutes
Minutes
Minutes
cornis, Centropages typicus and Limacina retroversa in August. In most months in which they were sufficiently abundant to be included in the analyses, the majority of dinoflagellates were included in groups which were occurred mainly in samples from the permanently stratified waters (Area B). The main exception to this was in August. Oithona spp., copepod nauplii and Evadne were usually included in the same groups as the majority of dinoflagellate taxa. Where Calanus finmarchicus and C. helgolandicus were referred to different groups, that containing C. finmarchicus had the more northerly distribution.
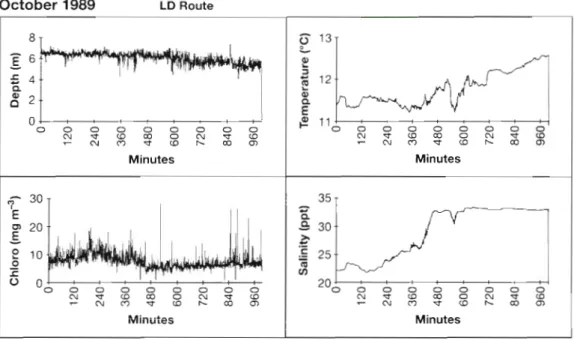
An example of a record from a data logger on tow on the LD route is that for October 1989 shown in Fig. 10. The salinity plot shows the sharp change in salinity at the front between the Baltic water in the Kattegat and the more saline water of the Skagerrak. The tempera- ture also shows a discontinuity but this is less precisely defined than that in salinity. In the absence of salinity data for tows other than those in October and Novem- ber 1989 the temperature data were used to define the position of the front on each tow (Fig. 11). As with the LR route the position of the front was less well defined,
-5
1
0 0 0 0 0 0 0 0
~ Z ? , % ~ k ' c %
Minutes
Minutes
Minutes
and in some cases it could not be identified from data giving the average values for the CPR plankton samples.
The grouping of samples to indicate areas containing similar plankton assemblages followed the procedure used for the LR route (see above). Where groups of samples occurred mainly in the Skagerrak they were defined as 'Area S' and groups mainly in the Kattegat were called 'Area K'. Samples which did not fall within these categories were called 'Area C' and 'Area D'. The positions of the 18 samples analysed in July 1988 are given in the upper chart in Fig. 12 and the mean positions and the variation in latitude and longitude of the samples analysed in 1989 are shown in the lower
L ~ n d l e y & Williams: Plankton assemblages in the North Sea 251
chart. As a n example of the results of cluster analyses Temperature
a n d MDS plots for data showing relationships between the samples from this route those from October 1989 a r e shown in Fig. 13.
In July 1988 the samples were divided into 2 coher- ent areas, samples l to 9 a n d samples 10 to 18. The position of the front, a s indicated by the change tem- perature, was in sample 10. The groupings of samples in the tows taken in 1989 a r e shown in Table 3. In most months the division between the sample from Skager- rak a n d those from the Kattegat was well defined except perhaps in May 1989.
The plankton assenlblages were defined by the results of the cluster a n d MDS analyses of the plankton data for each month. The dendrogram a n d scatter plot for October 1989 is given in Fig. 14 a s a n example of these analyses. In each case the assemblage with its main centre of abundance furthest to the west was called 'Group A' a n d those with their main areas of
23
Turbiditv
Fig. 4 . Contour plots of temperature ("C) a n d t u r b i d ~ t y (parts per m ~ l h o n ) d u n n g a n UOR tow on the LR route (see Fig. 1 ) on
1 a n d 2 August 1989
Fig 5. Temperature ("C) re- corded during instrumented CPR tows on the LR route ( s e e Fig. l ) during 1989. Left: orig- inal data, right: mean values per analysed plankton sample (for positions s e e Fig. 6). Ar- rows indicate the position of
the Flamborough front
:p-,
60 500 1000
Time (minutes)
'.
c-,
6.56
0 500 1000
Time (minutes)
::p---b4
1 20 500 1000
Time (minutes)
;!plm
110 500 1000
Time (minutes)
;:v\
11
-up-
0 500 1000
Time (minutes)
Jan 1889
Feb 1989
Sep 1989
Oct 1989 8 7' 6 -
21 19 17 1 5 13 11 9 7 5 3 1 Sample
6 . 5
21 19 17 1 5 1 3 11 9 7 5 3 1 Sample
12
21 19 17 1 5 13 11 9 7 5 3 1 Sample
12
21 19 17 1 5 13 11 9 7 5 3 1 Sample
11
21 1 9 17 1 5 1 3 11 9 7 5 3 1 Sample
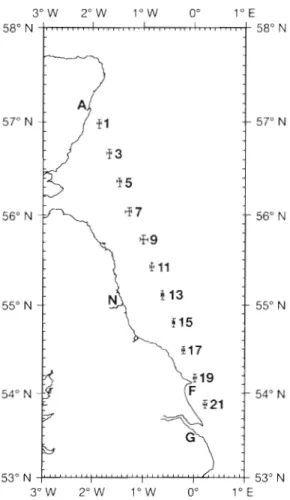
Fig. 6. Positions of analysed plankton samples on the LR route in 1989. The bars giving the range of latitude and longitude of the nud-points of the samples intersect at the mean position.
A = Aberdeen, N = Newcastle, F = Flamborough Head, G =
Grimsby
Table 3. Continuous plankton recorder samples on the LD
route (see Fig. 11) in 1989. Grouping of samples according to
the results of cluster analysis and MDS ordination. The stress
coefficients for the 2-dimens~onal MDS plot (stress) are listed.
(For further details see text)
1 3 5 7 9 11 13 15 17 Stress
January S K S S S K K K K 0.085
February S S K S S C K K K 0.010
March C S C S S S K K K 0.009
Apnl C D S S S K K K K 0.040
May S S C K K S C K K 0 . 0 5 7
October S S S S S K K K K 0.110
November S S S S C K K K K 0.009
abundance further east were ordered alphabetically from west to east. The results are shown in Fig. 15.
In July 1988, 4 groups were identified. Most taxa (Group C) were abundant throughout the route, hence the high level of similarity between the samples. Two groups (A and B) were abundant in the Skagerrak (samples 1 to 9) while 1 group of 3 phytoplankton taxa was most abundant in the Kattegat (samples 10 to 18).
Two groups were identified in each of the months for which data were analysed in 1989. In each month Group B was most abundant in the Kattegat and, except in April and May rare or absent in samples taken in the Skagerrak. Group A was more variable and usually more widespread. The spring diatom bloom was clear in the Kattegat in March 1989 when Group B consisted of 5 diatom taxa including Skele- tonema costatum which is typically abundant early in the spring bloom (Colebrook 1984). In April diatoms
LR Route July 1989: Samples
21 1 19 17 11 9 3 7 15 13; 5
A r e a A
I
A r e a B 1*
: A r e a B 2Fjg. 7 Grouping of samples on the LR route in July 1989 using the dendrogram (left) resulting from cluster analysis and the scatter plot (right) resulting from MDS analysis
Lindley & Williams: Plankton assemblages in the North Sea 253 - - - -
"T
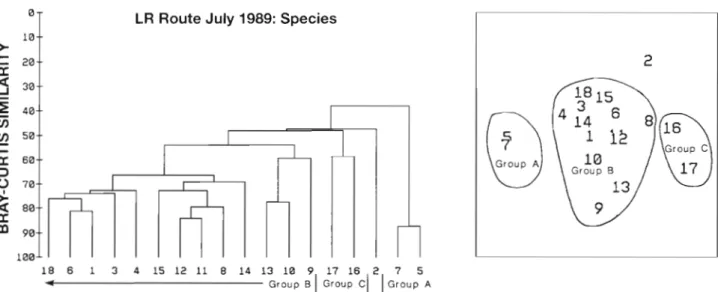
LR Route July 1989: Species18 6 1 3 4 15 12 11 8 14 13 10 9 17 16 2 7 5
4 Group B
1
Group C[1
Group AFig. 8. Grouping of taxa on the LR route in July 1989 using the dendrogram (left) resulting from cluster analysis and the scatter plot (right) resulting from MDS analysis. For key to taxa see Table 1
were most abundant to the west of the front (samples 7
and 9) while the Kattegat was dominated by small copepods and cladocerans. By May the common phytoplankton were dinoflagellates. The samples which were classified as neither Area S nor Area K in
February, March and April contained little plankton.
In October and November most diatoms and dinofla-
gellates were within Group B in the Kattegat.
The results of the analysis of the biota in relation to the environmental variables using the BIO-ENV pro- gram are listed in Table 4. Inevitably there a r e many cases of high correlation between variables so that it is difficult or impossible to distinguish between their effects using this method (Clarke & Ainsworth 1993). The irradiance channels are inevitably all highly corre- lated and on the LD route temperature and salinity
Table 4. The results of BIO-ENV analyses of the weighted correlations between the rank dissimilarites between samples derived from biota identified from CPR records and equivalent values from environmental variables, including data from CPR or UOR dataloggers (Data) on the LR route in 1989 and the LD route in July 1988 and in 1989. The single variable most highly correlated with the biota (best single) and the set of variables which give the highest correlation (best set) and the coefficients are listed
Month Route Data a Best single Correlation Best set Correlation
1988
February LR 1 R1 0.408 R 1 0.408
April LR 4 Tur 0.416 Tur 0.416
May LR 5 Strat. 0.309 Strat, Tur 0.421
July LR 1 R4 0.330 Chl, RI, R2, Strat 0.465
September LR 1 Strat 0.290 Tem, Strat 0.395
October LR 2 Strat 0.390 Tem, Strat 0.434
July LD 1 Tern 0.547 D, Tern, Chl, R1 0.595
1989
January LD 1 Tern 0.387 Tern, R4 0.402
February LD 1 R 1 0.259 R3, R4 0.283
March LD 1 R 1 0.415 D, Tern, Chl, R1 0.474
May LD 1 R2 0.406 Tern, R2 0.414
October LD 3 Sal 0.481 D, Sal 0.540
November LD 3 Sal 0.535 D, Tern. Chl 0.575
"Data from loggers used in the analysis. 1, CPR data: D, Tem, Chl and 4 wadiation channels. 2, CPR data: D, Tern and Chl. 3, CPR data: D, Tem, Chl and Sal. 4, UOR data: D, ten^, Chl, Sal, Tur and 6 irradiation channels. 5, UOR data: D, Chl, Tur and 6 irradiation channels
b ~towing depth; Tem: temperature; Chl: chlorophyll; Sal: Salinity; Tur, turbidity, RI: irradiance 450 pm down; R2: irradiance : 450 pm up; R3: irradiance 550 pm down; R4: irradiance 550 pm up; Strat: stratdication parameter
MARCH 1989
I
Group AAPRIL 1989
Sample
Para-Pseudo Fish
I
EuphausiidsGroup A
" 1 3 5 7 9 1 1 1 3 1 5 1 7 1 9 2 1
Sample
Skeletonema Thalassionema
::
1 0,
n
I
SamplePeridinium Copepodnauph Oithona
Colour Colour
Total Copepods Group C Thalassiosira
Pan-Pseudo
C. helgolandrcus Total Copepods
Cinipedia Echinoderm C. helgolandicus
O 1 3 5 7 9 111315171921
I
Group BI
Sample SampleCalanus I-IV Hyperild
Calanus I-/V Metrid~a Decapod Chaetognatha :
I
Group DI
Group DI
SampleI
SampleMAY 1989 JULY 1989
1C. finmarch~cus I I Cer lineaturn Pend~nium
I
Group AGroup B
C. helgoland~cus Hyperiid Decapod Euphauslacea Chaetqnatha>8mm Fish
l
ColourGroup A
"
L
m,I
''1 3 5 7 9 111315171921
I
SampleI
Colour Total Copepods Cer fusus Evadne Cer furca Ech~noderm Cer: tnpos Append~cularia Para-Pseudo Decapod Acartla
Copepod nauplli Oithona Group B
l
201I
R stybformisR hebetata Hyalochaete CM fusus
Calanus /-/V
I
SampleI
SampleI
l
Group C Para-PseudoI
Group Cl
Acarf~a Copepod naupli~ O~thona Total Copepoda Echlnoderm Appendicularia
Fig. 9a. Distribution and composi-
tion of groups of planktonic taxa in
CPR samples on the LR route i n
March, April, May and July 1989
Lindley & Williams: Plankton assemblages in the North Sea 255
AUGUST 1989
Cec tusus Group A Cec heaturn
Dinophysls Prorocentrurn
1 0
O 1 3 5 7 9 111315171921 Sample
Acart~a Group B
7
1
Copepod nauplilI
SampleI
I
I
Para-PseudoGrouo C
Colour Cer turca
I
SampleI
30 20 S
10
O 1 3 5 7 9 111315171921
O~thona Total copepods Evadne Ech~noderm Decapod
Group D
Sample
Temora Cent. typicus
1 0
O 1 3 5 7 9 li1315171921
Limacina
I
SampleI
SEPTEMBER 1989
I
Group BGroup A
Hyalochaete Phaeoceros
Group C 1 0
O 1 3 5 7 9 1 1 171921
I
SampleCer. lineaturn CM tripos Pendinium Prorocentmrn C. helgolandicvs
l
Group DI
SampleI
Hyalochaete N. seriata
Sample
l
Ternora 01 3 5 7 9 1 1 1 1 1 2
Colour Cer. fusus Cer. furca
Cer. fusus Cer. turca Cer. lineaturn Per~dmiurn Para-Pseudo
Para-Pseudo Acariia
Cent typicus
Decapod Chaetognatha >8 mm
OCTOBER 1989
Echinoderm Append~cularia C. finmarchicus Decapoda 10
O 1 3 5 7 9 111315171921 O 1 3 5 7 9 111315171921
Sample Sample
1
Sample:
I
~ o ~ ~ ~ i o ~ ~ r al
Acarfia Copepod naupliiI
Limacina
C. helgolandicus Hyperiid Euphaus~acea Chaetognatha >8 mm
Group D
Cer tnpos Dtnophys~s Oifhona Metndia
Chaetognatha >8 mm Gammandea
Fig. 9b. Distribution and composition of groups of planktonic taxa in CPR samples on the LR route in
October 1989 LD Route
Fig. 10. Results from instrumentation in a CPR towed on the LD route (see Fig. 1) on 27 and 28 October 1989 8 -
W
2
2 . -(where measured) are highly correlated with each other and to the towing depth. The latter varied little, usually by about 1 m between the minimum and maxi- mum mean depth per CPR plankton sample, but the change was systematic along the route possibly due to change in water density related to the temperature and salinity.
O ; & & A A A A A A
( U Q W W O c u Q W7 C U O U W ~ W Q )
Minutes
30 E
F
20W
g 10
0
E
0 0 0~ W0 W0C 0O O0C0U 0Q U~Y0
( U C 9 Q W b C O U Y
Minutes
DISCUSSION
~ l l o o o o o o o o o
?
z
%
%
g
2
g
g
Minutes
.-
252 0 0 0 0 ~ 0 0 0 0 0
? i ? , % % $ ? g %
MinutesT h e influence of diel migration on the plankton taken in CPR samples has been recognised and taken
into account in processing and interpreting the data throughout the history of the survey (e.g. Hardy 1939; Colebrook et al. 1961) so it is not surprising that the
results of the BIO-ENV analyses showed that measures of irradiance were the single variables which best explained the distribution of the biota in 5 of the 14 tows listed in Table 4 and in half the cases such mea- sures were among the best set of variables. The con-
centration of groups of plankton in samples taken by
night was noted on the LR route in February, May, July
and August but no comparable groups were found on
the LD routes. In May 1989, when samples l to 7 of the
LD route were taken by day and samples 9 to 17 were
taken a t night, the group which included adult Calanus finmarchicus, decapod larvae a n d euphausi-
ids showed no concentration in the night samples but
the division between day and night approximated to
the position of the front between Skagerrak water and Kattegat water. In February the LD tow was mostly
taken a t night and in March samples 1 and 3 were taken by day and plankton was sparse in these sam- ples so the relationship with light does not seem to be a major factor on this route. Die1 vertical migration of zooplankton is very variable. Williams & Lindley (1982) found differences between the beginning and end of May in the diel distributions of Calanus finmarchicus copepodites a n d unpublished data on Pagurus bem- hardus zoeas show that these may remain in near sur- face waters, migrate through a thermocline or remain beneath a thermocline according to conditions. Such variability could contribute to the fact that measures of irradiance were not always among the environmental factors significantly influencing the plankton distribu- tions in the single depth CPR tows. Integrated depth samples would give more accurate data on the total abundance a n d composition of the plankton, particu- larly in stratified waters, but would merge vertically partitioned assemblages.
On the LR route, the value of the stratification para- meter was the best single variable for explaining the biotic variability in 3 months a n d in each of these it was included in the 'best set'. In April, turbidity was the best single variable. In the depth range sampled by the UOR on this route turbidity is usually much higher in the permanently mixed water to the south of the Flam- borough front than in the stratified water to the North (see Fig. 4 ) . The grouping of samples at or near to the southern end of the route with one or more of the most northerly samples, as in May, July and October (Table 2) probably reflects the transitional (Pingree & Griffiths 1978) nature of the water as defined by the
L~ndley & Williams: Plankton assemblages in the North Sea
Fig. 11. Temperature ("C) re- corded during instrumented CPR tows on the LD route (see Fig. 1) in July 1988 and during 1989. Left: original data; right: mean values per analysed plankton sample (for positions see Fig. 12). Arrows indicate the position of the front between Baltic water (low salinity) and North Sea
water
17 15
0 200 400 600
Time (minutes)
4
0 200 400 600 800
Time (minutes)
3
0 400 800
Time (minutes)
4 3
0 300 600 900
Time (minutes)
0 300 600 900
Time (minutes)
13 - 12 11
0 250 500 750 1000
Time (minutes)
Time (minutes)
July 1988
Jan 1989
Feb 1989
Mar 1989
May 1989
Oct 1989
Nov 1989
Sample
Sample
T
I
Sample
Sample I
Sample
.
.17 15 13 11 9 7 5 3 1
Sample
Sample
stratification parameter. The plots in Fig. 2 show weaker stratification at the northern e n d of the route than in the central part of the tows in June and no stratification in the northern end in September.
On the LD route, the correlations from the BIO-ENV analyses were generally higher than on the LR route. This can be related to the strong permanent front a n d
the associated contrasts in the environmental para- meters. Salinity was the most important factor in the
2 months when this was measured (October and
November) and as salinity, temperature and towing depth were highly correlated it seems that it is not possible to regard these as independent in these analyses.
h g . 12. Distnbution of analysed plankton samples on the LD route in July 1988 (upper) and during 1989 (lower). In the lower chart the bars giving the range of latltude and longi- tude of the mid-points of the samples intersect at the mean
position
LD Route October 1989: Samples
The best correlations from the BIO-ENV analyses presented here are lower than the examples from ben- thic surveys presented by Clarke & Ainsworth (1993). It is possible that environmental variables which were not measured in the present study, such as nutrients or toxins, might have played a significant role in influenc- ing the plankton. Nutrient availability in the photic zone of the open sea is related to stratification (e.g. Cushing 1989). Alternatively the dynamic nature of plankton distributions may limit detection of response by plankton to local environmental effects (Warwick 1993). The method may be more appropriately applied to plankton surveys over a 2-dimensional array of sta- tions over a restricted area (e.g. Collins & Williams 1982, Siokuo-Frangou & Papathanassiou 1991) than the long (approx. 300 km) 'transects' of the CPR tows. A limitation to the interpretation of such surveys in the open sea is the 'white noise1-like character of plankton distributions described by Tsuda et al. (1993) which led those authors to conclude that quantitative sampling required samples taken over > 5 km, a requirement that the 16 km CPR samples fulfil.
The variability of the composition of the assem- blages identified from the analyses of the data varied through the year can be attributed to the effects of ad- vection and the dynamics of the taxa within areas of different hydrographic characteristics. An example of advection is the occurrence of Candacia arrnata in Group A on the LR route in October 1989. This spe- cies is associated with inflow of water into the North Sea from the north (e.g. Rae & Rees 1947). The changes in abundance and distributions of the di- atoms and dinoflagellates generally conform to the pattern of succession related to stratification and con-
l 7 1 l 15 13 9 7 5 3 1
*
KatregatI
Skagerrak WSkagerrak 3
13 Kattegat
17
11
Fig. 13. Grouping of samples on the LD route in October 1989 using the dendrogram (left) resulting from cluster analysis and the scatter plot (right) resulting from MDS analysis
L i n d l e y & W i l l i a m s : P l a n k t o n assemblages in t h e N o r t h Sea
LD Route October 1989: Species
0
-
10-
c
20-3 2 2 9 1 4 8 3 l 1 ~ 0 2 7 1 2 8 2 s 2 4 l 9 1 ~ 3 1 ~ l s 2 1 1 6 2 B 2 6 2 2 1 2 1 1 1 0 6 5 4 3 9 7 2
4 Group A
I
G r o v ~ BF i g . 14. G r o u p i n g o f t a x a o n t h e LD r o u t e in O c t o b e r 1989 u s i n g t h e d e n d r o g r a m (left) r e s u l t i n g f r o m c l u s t e r analysis a n d t h e scatter p l o t (right) r e s u l t i n g f r o m M D S analysis. F o r k e y t o t a x a see T a b l e 1
JULY 1988
R. shrubsolei Noctiluca G r o u p A
10
'1 3 5 7 9 1 1 1 3 1 5 1 7
S a m p l e G r o u p B
.'"l,
l
l0 0
1 3 5 7 9 1 1 13 15 17
S a m p l e
Cer. horridurn Cer. longipes Cent. typicus Cyphonautes Appendicularia
JANUARY 1989
S a m p l e
Pan-Pseudo G r o u p B Acariia
Oithona G r o u p A
$.
"
10h
n
G r o u p C l0
$. 5
0
1 3 5 7 9 1 1 13 15 17
S a m p l e G r o u p D
.:l
50
1 3 5 7 9 11 13 15 17 S a m p l e
Colour Cer: furca Metridia Euphausiacea Hypefiid Chaetwnatha
FEBRUARY 1989
G r o u p A
l
/ O ,S a m p l e
I
G r o u p BI
1 3 5 7 9 1 1 13 15 17S a m p l e
Phytoplankton colour Cer fusus Cer. furca Cer tripos Peridinium D~nophysis Calanus 1-1V Para-Pseudo Temora Acartia R. alata Hyalochaete Prorocentrum
Cent. hamatus Copepod nauplii Harpacticoid Oithona Total copepods Podon Cirripedia Limacia Bivalve Echinoderm
-
F i g . 15a. D i s t r i b u t i o n a n d c o m p o s i - t i o n o f g r o u p s o f p l a n k t o n i c t a x a in CPR s a m p l e s o n t h e LD r o u t e in J u l y
1 9 8 8 a n d J a n u a r y a n d F e b r u a r y 1989
Chaetognatha >8 mm Fish larvae
Colour Cer. fusus Cer. furca Para-Pseudo Appendicularia
MARCH 1989 Group A
l
? l
Colour Thalasionema Para-Pseudo Ternora A cartla Oithona Total Copepods 1 3 5 7 9 11 13 15 17
Cirnpedia Append~culana
I
Group BI
SampleS. costaturn Thalassiosira Coscinodiscus Hyalochaere Phaeoceros
MAY 1989
I
1 P . L s u s1 0
s%-hdL
0 1 3 5 7 9 11 13 15 17Sample
Ternora Acania Cent. harnatus Oithona
1 0 Toral Copepods
Cer. hhorridum Cer longipes
OecapodlaNae Corycaeus C, finmarchicus
Euphaus~acea
Group B
1 3 5 7 9 11 13 15 17
Sample Cirnped~a Calanus / - / V Para-Pseudo
Calyptopis Ech~noderm
NOVEMBER 1989
APRIL 1989
Colour Group A Thalassiosira
Hyalochaere Thalassionema C. finrnarch~cus C. helgolandicus Metridra Euphaus~acea Sample Chaerognatha
1
Group BPara-Pseudo. Temora Acan~a Cenl, harnatus Orthona spp Podon Evadne
CTOBER 1989
Colour
Group A Cer. tusus Cosc. wailesi~ Calanus 1-1V Para-Pseudo Temora Acartia Oithona Sample Corycaeus Group B
I
ThalassiosiraR. afata Hyalochaete Phaeoceros Cer, lurca Para-Pseudo Temora Acania
Cent typrcus 2 0 Total Copepods n
1 3 5 7 9 11 13 15 17 Sample Chaerognatha >Ern Sample
Group B Group A
sequent nutrient availability in temperate waters as discussed by Cushing (1989).
The environmental data collected by the instru- mented CPRs and the UORs made it possible to iden- tify the positions of the fronts defining the boundaries of water masses. This direct evidence reinforced what would otherwise have been only inferences drawn from interpretation of the plankton data. The data from the UOR on the LR route defined the position of the
Colour Calanus / - / V
Tot Cops Lirnacina Bivalve Echinoderm C. helgolandicus Candacia Mysid Hypen~d D-pod Chaerognarha >8mm Thalassrosira Coscrnodiscus R h i z o ~ ~ l e n i a alata Hyalachaele Phaeoceros Thalassionerna Cer furca Cer lineaturn Cer tripos Thecosornata Cer. lmeaturn Cer. tripos Dinophysis Evadne C. finmarchicus
Fig. 15b. Distribution and compo- sition of groups of planktonic taxa
In CPR samples on the LR route in March, April. May, October and
November l989
Flamborough front in relation to the single depth data record of the CPR and supported the definition of the frontal position from the CPR data. The comparison of the graphs of mean temperature data for each plank- ton sample with those of the full data set justify the logging the data at high frequency to identify the positions of the fronts.
Aspects of the results of the CPR survey in the North Sea in 1989 were exceptional. Ceratium spp. and sev-
Lindley & Williams: Plankton assemblages in the North Sea 261
era1 zooplankton taxa were unusually abundant (Dick- son et al. 1993, CPR survey team 1993), the seasonal cycles of Ceratium spp. and most decapod larvae were atypically early (Dickson et al. 1993, Lindley et al. 1993) and doliolids were recorded in the eastern North Sea for the first time since 1911 (Lindley et al. 2990). These events and more general interannual changes in the plankton (Colebrook 1991) have been attributed to climatic variation including high winter temperatures (Lindley et al. 1993) and anomalous wind patterns (Dickson et al. 1993). The long-term time series of the CPR survey have made it possible to quantify these changes in the plankton but comparable detailed hydrographic data to link climatic cause to ecological effect a r e absent. Instruments such a s the instru- mented CPR and the UOR towed by ships-of-opportu- nity combined with remote sensing by satellite (e.g. Aiken 1989) provide the potential for such long-term monitoring of hydrographic variables. In view of the known importance of stratification in the dynamics of plankton in temperate waters (Sverdrup 1953, Craig
1960, Robinson 1970, Cushing 1989) undulating
vehicles, like the
UOR,
which allow direct obs- ervation of vertical structure on a fine scale would be the preferred option for deployment from ships-of- opportunity.Acknowledgements. The CPRs and UORs were towed on the LR route by the MV 'Astrea' (NORCARGO Ltd.) and on the LD route by MV 'Dana Hafnia' and MV 'Dana Futura' (DFFS). We thank the owners, agents, masters and crews for their willing co-operation. We acknowledge all personnel involved with the development of the instrumented vehicles at PML (R. H. Bruce, C. D. Barrett, I. E. Bellan and N. J. Bloomer). During 1988 and 1989 the data loggers were prepared for deployment and the results processed by Mr N. C. Halliday. Instrumentation of CPRs was financed by the UK Department of the Environment (DOE) (contract 7/8/121) and the provision of UORs and their deployment was financed by the UK Min- ~ s t r y of Agriculture, Fisheries And Food (MAFF) (contract DHAlO(GCB10)). The analysis of the CPR samples was car- ried out by the survey team and at the time of these studies the survey was supported by MAFF and DOE as part of PML programmes. The work comprised part of PML Laboratory Project 3, Community Ecology.
LITERATURE CITED
Aiken, J. (1980). A marine environmental recorder. Mar. Biol. 57: 237-240
Aiken. J . (1981a). The Undulating Oceanographic Recorder Mark 2. J. Plankton Res. 3: 551-560
Aiken, J. (1981b). A chlorophyll sensor for automatic, remote, operation in the marine environment. Mar. Ecol. Prog. Ser. 4: 235-239
Aiken, J. (ed.) (1989). The North Sea: satellite colour atlas. Cont. Shelf Res. 9: 665-765
Aiken, J., Bellan, 1. (1986). A simple hemispherical logarith-
mic light sensor SPIE 637, Ocean Optics VIII: 211-216
Andersson, L., Rydberg, L. (1993). Exchange of water and
nutrients between the Skagerrak and the Kattegat. Estuar. coast. Shelf Sci. 36: 159-181
Clarke, K R., Ainsworth, M. (1993). A method of linking multivariate comn~unity structure to environmental vari- ables. Mar. Ecol Prog. Ser. 92: 205-219
Colebrook. J. M. (1960). Continuous plankton records: meth-
ods of analysis, 1950-59. Bull. mar. Ecol. 6: 51-64
Colebrook. J. M. (1964). Continuous plankton records: a prin- cipal component analysis of the geographical distribution of zooplankton. Bull. mar. Ecol. 6: 78-100
Colebrook, J. M. (1972). Variability in the distribution and
abundance of the plankton. Spec. Publ. int. commn. NW
Atlant. Fish. 8: 167-186
Colebrook, J. M. (1984). Continuous plankton records: rela-
tionships between species of phytoplankton and zoo-
plankton in the seasonal cycle. Mar. Biol. 83: 313-323
Colebrook. J. M. (1991). Continuous plankton records: from
seasons to decades in the plankton of the north-east Atlantic. In: Kawaski, T., Tanaka, S., Toba, Y., Taniguchi,
A. (eds.) Long-term variability of pelagic fish populations
and their environment. Pergamon Press, Oxford, p. 20-45
Colebrook, J . M., Glover, R. S., Robinson, G. A. (1961). Continuous plankton records 1948-1956: contributions
towards a plankton atlas of the north-eastern Atlantic and
the North Sea. Bull. mar. Ecol. 5: 67-80
Colebrook, J . M , Warner, A. J , Proctor, C. A., Hunt, H. G.,
Pntchard, P., Joyce, D., Barnard, R. (1991). 60 years of the
Conhnuous Plankton Recorder Survey: a celebration. The Sir Alister Hardy Foundation for Ocean Science, Plymouth
Collins, N R . , Williams, R . (1982). Zooplankton communities
in the Bnstol Channel and Severn Estuary. Mar. Ecol.
Prog Ser. 9. 1-11
CPR survey team (1993). Continuous plankton records: the
North Sea in the 1980s. ICES mar. Sci. Symp. 195: 243-248
Craig, R. E. (1960). A note on the dependence of catches on
temperature and wind in the Buchan pre-spawning her- ring fishery. J. Cons. int. Explor. Mer 25: 185-208 Cushing, D. H. (1989). A difference in structure between
ecosystems in strongly stratified waters and in those that
are only weakly stratified. J. Plankton Res. 11: 1-13
Dickson, R. R., Colebrook, J. M., Svendsen, E. (1993). Recent
changes in the summer plankton of the North Sea. ICES
mar. Sci. Symp. 195: 232-242
Edinburgh Oceanographic Laboratory (1973). Continuous
plankton records 1948-1956: a plankton atlas of the north
Atlantic and the North Sea. Bull. mar. Ecol. 7: 1-174
Field, J. G., Clarke. K. R.. Warwick, R. M. (1982). A practical strategy for analysing multi-species distribution patterns.
Mar. Ecol. Prog. Ser. 8: 37-52
Hardy, A. C. (1939). Ecological surveys with the continuous
plankton recorder: object, plan and methods. Hull. Bull. mar. Ecol. 1: 1-57
Hays, G. C., Warner, A. J . (1993). Consistency of tow speed
and sampling depth for the continuous plankton recorder.
J . mar. biol Ass. U.K. 73: 967-970
L~ndley, J. A., Roskell, J., Warner, A. J , Halliday, N. C., Hunt,
H. G., John, A. W. G., Jonas, T. D. (1990). Doliolids in the
German Bight In 1989: evidence for exceptional inflow into the North Sea. J . mar. biol. Ass. U.K. 70: 679-682
Lindley, J. A., Williams, R., Hunt, H. G . (1993). Anomalous seasonal cycles of decapod crustacean larvae in an excep-
tionally warm year. J . exp. mar. Biol. Ecol. 172: 47-65
Lucas, C. E. (1942). Continuous plankton records: phyto-
plankton in the North Sea 1938-1939. Part I1 - Dinoflagel-
Pattiaratchi, C. B., Micallef, S., Aiken, J . , Osbourne, M. J . , Collins, M. B., Williams, R. (1989). Chlorophyll vanability at Ocean Weather Station Lima (57" N, 20' W). In: Ryland,
J . S., Tyler. P. A. (eds.) Reproduction, genetics and distrib-
utions of marine organisms. Olsen & Olsen, Fredensborg,
p. 423-429
Pingree, R. D., Griffiths, D. K. (1978). Tidal fronts on the shelf
seas around the British Isles. J. geophys. Res. 83: 4615-4622
Rae, K. M. (1952). Continuous plankton records: explanation and methods, 1946-1949. Hull Bull. mar. Ecol. 3: 135-155
Rae. K. M,, Rees. C. B. (1947). Continuous plankton records:
the copepoda of the North Sea 1938-1939. Hull Bull. mar.
Ecol. 2: 95-133
Reid, P. C., Hunt, H. G . , Jonas, T D. (1983). Exceptional
blooms of diatoms associated with anomalous hydro- graphic conditions in the Southern Bight in early 1977.
J. Plankton Res. 5: 7555765
Richardson, K. (1985). Plankton distribution and activity in the North Sea/ Skagerrak-Kattegat frontal area in April 1984. Mar. Ecol. Prog. Ser. 26: 233-244
Robinson, G. A. (1961). Contribution towards a plankton atlas of the north-eastern Atlantic and the North Sea. Part I: Phytoplankton. Bull. mar. Ecol. 5: 81-89
Robinson, G. A. (1965). Contribution towards a plankton atlas
of the north Atlantic and the North Sea. Part IX: Phyto-
plankton. Bull. mar. Ecol. 6. 81-89
Robinson, G. A. (1968). Distribution of Gonyaulax tamarense Lebour in the western North Sea in Apnl, May and June 1968. Nature 220: 22-23
Robinson, G . A. (1970). Continuous plankton records: varia-
tion in the seasonal cycle of phytoplankton in the north Atlantic. Bull. mar. Ecol. 6, 333-345
Robinson, G. A., Aiken, J., Hunt, H. G. (1986). Synoptic sur-
T h ~ s article was submitted to the editor
veys of the western Engllsh Channel. The relationship between plankton an hydrography. J . mar. biol. Ass. U.K.
66: 201-218
Siokou-Frangou, I., Papathanassiou. E. (1991). Differentiation
of zooplankton populations in a polluted area. Mar. Ecol.
Prog. Ser. 76: 41-51
Sverdrup, H. U. (1953). On conditions for the vernal blooming
of the phytoplankton. J. Cons. int. Explor. Mer 18: 287-295
Tsuda, A., Sugisalu, H., Ishimaru, T., Saino, T., Sato, T. (1993).
White-noise like distribution of the oceanic copepod Neo-
calanus cristatus in the sub-arctic North Pacific. Mar. Ecol.
Prog. Ser. 97: 39-46
Warwick, R. M. (1993). Environmental lrnpact studies on
marine communities: pragmatical considerations. Aust. J.
Ecol. 18: 63-80
Williams, R., Aiken, J. (1990). Optical measurements from
underwater towed vehicles deployed from ships of oppor-
tunity in the North Sea. In: Nielson, H. 0 . (ed.) Environ-
ment and pollution measurement sensors and systems. SPlE 1269: 186-194
Williams, R., Lindley, J. A. (1982). Plankton of the Fladen
Ground dunng FLEX 76. 111. Vertical distribution, popula- tion dynamcs and production of Calanus finmarchicus (Crustacea: Copepoda). Mar. Biol. 60: 47-56
Williams, R., Lindley, J. A. (in press). Strategy and application of sampling large marine ecosystem with the Continuous
Plankton Recorder (CPR) and Undulating Oceanographic
Recorder (UOR)/Aquashuttle. In: Okemwa, E. N. (ed.) Pro-
ceedngs of status and future of large marine ecosystems
(LME) of the Indian Ocean, Mombasa, Kenya, 28 March - 2 April 1993
Wihams, R., Llndley, J. A.,, Hunt, H. G., Collins, N. R. (1993). Plankton community structure and geographical distnbu- tion in the North Sea. J. exp. mar. Biol. Ecol. 172: 143-156 Manuscript first received: September 15, 1993