Mucosal
Expression
of
Type
2
and
Type
17
Immune
Response
Genes
Distinguishes
Ulcerative
Colitis
From
Colon-Only
Crohn
’
s
Disease
in
Treatment-Naive
Pediatric
Patients
Michael
J.
Rosen,
1,2Rebekah
Karns,
1Jefferson
E.
Vallance,
1Ramona
Bezold,
1Amanda
Waddell,
1Margaret
H.
Collins,
3,4Yael
Haberman,
1,5Phillip
Minar,
1,2Robert
N.
Baldassano,
6Jeffrey
S.
Hyams,
7Susan
S.
Baker,
8Richard
Kellermayer,
9Joshua
D.
Noe,
10Anne
M.
Grif
fi
ths,
11Joel
R.
Rosh,
12Wallace
V.
Crandall,
13Melvin
B.
Heyman,
14David
R.
Mack,
15Michael
D.
Kappelman,
16James
Markowitz,
17Dedrick
E.
Moulton,
18Neal
S.
Leleiko,
19Thomas
D.
Walters,
11Subra
Kugathasan,
20Keith
T.
Wilson,
21,22Simon
P.
Hogan,
2,23and
Lee
A.
Denson
1,21
DivisionofGastroenterology,HepatologyandNutrition,3DivisionofPathology,23DivisionofAllergyandImmunology,
CincinnatiChildren’sHospitalMedicalCenter,Cincinnati,Ohio;2DepartmentofPediatrics,4DepartmentofPathologyand
LaboratoryMedicine,UniversityofCincinnatiCollegeofMedicine,Cincinnati,Ohio;5PediatricGastroenterologyUnit,The
EdmondandLilySafraChildren’sHospital,ShebaMedicalCenter,TelHashomer,Israel;6DivisionofPediatric
Gastroenterology,HepatologyandNutrition,Children’sHospitalofPhiladelphia,Philadelphia,Pennsylvania;7Divisionof
DigestiveDiseases,Hepatology,andNutrition,ConnecticutChildren’sMedicalCenter,Hartford,Connecticut;8Digestive
DiseasesandNutritionCenter,WomenandChildren’sHospitalofBuffalo,Buffalo,NewYork;9DepartmentofPediatrics,
SectionofPediatricGastroenterology,HepatologyandNutrition,BaylorCollegeofMedicine,Houston,Texas;10Divisionof
Gastroenterology,HepatologyandNutrition,DepartmentofPediatrics,MedicalCollegeofWisconsin,Milwaukee,Wisconsin;
11
DivisionofGastroenterology,HepatologyandNutrition,TheHospitalforSickChildren,Toronto,Canada;12Goryeb
Children’sHospital/AtlanticHealth,Icahn SchoolofMedicineatMountSinai,NewYork,NewYork;13DivisionofPediatric
Gastroenterology,HepatologyandNutrition,NationwideChildren’sHospital,Columbus,Ohio;14DivisionofPediatric
Gastroenterology,HepatologyandNutrition,UniversityofCaliforniaSanFrancisco,SanFrancisco,California;15Department
ofPediatricsandChildren’sHospitalofEasternOntarioInflammatoryBowelDiseaseCentre,Children’sHospitalofEastern
Ontario,Ottawa,Ontario,Canada;16DivisionofPediatricGastroenterology,DepartmentofPediatrics,University ofNorth
CarolinaatChapelHill,ChapelHill,NorthCarolina;17DivisionofPediatricGastroenterologyandNutrition,CohenChildren’s
MedicalCenterofNewYork,NewHydePark,NewYork;18DivisionofGastroenterology,Hepatology,andNutrition,
DepartmentofPediatrics,VanderbiltUniversitySchoolofMedicine, Nashville,Tennessee;19DivisionofPediatric
Gastroenterology,NutritionandLiverDiseases,HasbroChildren’sHospital,Providence,RhodeIsland;20Divisionof
Gastroenterology,HepatologyandNutrition,DepartmentofPediatrics,EmoryUniversity,Atlanta,Georgia;21Divisionof
Gastroenterology,HepatologyandNutrition,DepartmentofMedicine,VanderbiltUniversityMedicalCenter,Nashville,
Tennessee;22VeteransAffairsTennesseeValleyHealthcareSystem,Nashville,Tennessee
BACKGROUND & AIMS:There is controversy regarding the role of the type 2 immune response in the pathogenesis of ulcerative colitis (UC)—few data are available from treatment-naive patients. We investigated whether genes associated with a type 2 immune response in the intestinal mucosa are up-regulated in treatment-naive pediatric pa-tients with UC compared with papa-tients with Crohn’s disease (CD)-associated colitis or without inflammatory bowel dis-ease (IBD), and whether expression levels are associated with clinical outcomes. METHODS: We used a real-time reverse-transcription quantitative polymerase chain reac-tion array to analyze messenger RNA (mRNA) expression patterns in rectal mucosal samples from 138 treatment-naive pediatric patients with IBD and macroscopic rectal disease, as well as those from 49 children without IBD (controls), enrolled in a multicenter prospective observational study from 2008 to 2012. Results were validated in real-time reverse-transcription quantitative polymerase chain reac-tion analyses of rectal RNA from an independent cohort of 34
pediatric patients with IBD and macroscopic rectal disease and 17 controls from Cincinnati Children’s Hospital Medical Center. RESULTS: We measured significant increases in mRNAs associated with a type 2 immune response (inter-leukin [IL]5 gene,IL13, andIL13RA2) and a type 17 immune response (IL17AandIL23) in mucosal samples from patients with UC compared with patients with colon-only CD. In a regression model, increased expression of IL5 and IL17A
expression of genes that mediate type 2 and type 17 immune responses. Increased expression at diagnosis of genes that mediate a type 2 immune response is associated with response to therapy and remission in pediatric patients with UC.
Keywords: Immune Regulation; Gene Expression Profile; Prog-nostic Factor; AUROC.
T
ype 2 inflammation has been implicated in thepathogenesis of ulcerative colitis (UC).1,2 Classic
type 2 immune responses are defined by production of the
cytokines interleukin (IL)4, IL5, and IL13 by T helper cells and innate lymphoid cells and are involved in the expulsion
of helminths and the pathogenesis of allergic diseases.3UC,
however, has been associated with an atypical type 2
im-mune response, with increased IL5 and IL13, but not IL4.2
Further studies have indicated pathogenic effects of IL13
including activation of inflammatory colon mucosal natural
killer T cells and impairment of epithelial barrier function.4
The initial observation of this atypical type 2 immune response in UC originated from ex vivo experiments with lamina propria immune cells isolated from surgical
speci-mens from adults with IBD.2Whether type 2 inflammation
is involved in UC patients at diagnosis, before treatments
that affect the inflammatory response, or in pediatric UC
remains unknown. Furthermore, it is unknown if patients
with heightened type 2 inflammatory responses attain
different clinical outcomes.
Distinguishing UC from Crohn’s colitis can be a
nostic challenge in pediatric patients. Regardless of
diag-nosis with UC or Crohn’s disease (CD), a colitis phenotype is
a common feature of pediatric IBD. UC and inflammatory
bowel disease (IBD) unclassified account for 30%–40% of
pediatric IBD in the United States and Europe.5–7
Further-more, approximately 80% of children with CD have colonic
involvement, with 25% showing a colon-only phenotype
with no small intestinal involvement.8,9 Colon-only CD
phenotype is even more common with younger age, occur-ring in approximately 40% of children younger than 10
years of age.8,9 Taken together, approximately 50% of
pediatric IBD patients show an isolated colitis phenotype. Many of these children show overlapping or atypical
fea-tures, which hinder rendering a specific diagnosis of CD or
UC.10It is not known whether mucosal expression of genes
associated with type 2 inflammation can distinguish UC and
CD pediatric patients with isolated colitis phenotypes. We hypothesized that treatment-naive pediatric patients with UC would show increased mucosal type 2 immune
responses compared with patients without IBD and Crohn’s
colitis, and that high expression of type 2–associated genes
would be associated with poor response to therapy in
pe-diatric UC. Here, we applied a microfluidic real-time
reverse-transcription quantitative polymerase chain reac-tion (RT-qPCR) array platform to determine rectal mucosal expression of genes associated with type 1, type 2, and type
17 inflammation in patients with UC, Crohn’s colitis, and
non-IBD controls from a large multicenter North American pediatric IBD inception cohort. We report that expression of genes associated with type 2 and type 17 immune responses distinguished 2 colon-only phenotypes of pediatric IBD: UC and colon-only CD. Furthermore, we observed that a gene
expression profile marked by detectableIL13expression is
associated with improved clinical outcomes in pediatric UC.
Materials and Methods
RISK Cohort Rectal RNA Samples
Rectal mucosal RNA samples from treatment-naive IBD patients and non-IBD controls and associated clinical data were obtained from the Risk Stratification and Identification of Im-munogenetic and Microbial Markers of Rapid Disease Pro-gression in Children with Crohn’s Disease (RISK) study, a prospective observational IBD inception cohort sponsored by the Crohn’s and Colitis Foundation. A total of 1812 children and adolescents younger than age 17, newly diagnosed with IBD and non-IBD controls, were enrolled at 28 North American pediatric gastroenterology centers between 2008 and 2012. All participants underwent baseline colonoscopy with confi rma-tion of characteristic chronic active colitis and/or ileitis by histology before diagnosis and treatment. Institutional Review Board approval was obtained locally at each participating site. All endoscopic tissues obtained in the RISK study were stored in RNALater (Thermo Fisher Scientific, Waltham, MA), thus
EDITOR’S NOTES
BACKGROUND AND CONTEXT
There is controversy over the role of the type 2 immune response in pathogenesis of ulcerative colitis (UC)—few data are available from treatment-naïve patients.
NEW FINDINGS
The researchers showed that treatment-naïve pediatric patients with ulcerative colitis exhibit increased mucosal expression of genes associated with type 2 and type 17 immune responses compared to those with colon-only Crohn’s disease.
LIMITATIONS
This study measured only mRNA expression and not protein abundance.
IMPACT
Expression of type 2 and type 17 immune response genes distinguishes ulcerative colitis from colon-only Crohn’s disease in treatment-naïve pediatric patients.
using custom TaqMan array 384-well microfluidic cards on a 7900HT Real-Time PCR System (Thermo Fisher Scientific). The endogenous reference control was selected empirically by analyzing a subset of 16 samples (4 from each diagnosis group) with the TaqMan Human Endogenous Control Array (Thermo Fisher Scientific), which assesses expression of 16 genes known to show minimal differential expression across tissues. Real-time RT-qPCR on rectal RNA from the Cincinnati cohort was performed using a subset of individual gene expression assays from the custom microfluidic array. Relative expression was determined using a modification of the 2-DDCqmethod as previously described.12 Briefly, changes in the quantification
cycle (DCq) values were obtained by subtracting the target Cq from that of the reference gene.DCq values then were shifted such that expression in samples with undetectable expression (Cq>40) was considered half that of the sample with the least detectable expression.
Outcomes
Outcomes assessed in the UC group included steroid-free, surgery-free clinical response and clinical remission at 6 and 12 months. Clinical remission was defined as a physician global assessment (PGA) of inactive disease. The 4 PGA cate-gories were inactive mild, moderate, and severe disease. Clin-ical response was defined as a PGA of inactive or mild disease, with at least a 1-category decrease in PGA between baseline and the indicated time point (ie, if the patient had mild disease at baseline, they must have improved to inactive disease). For both end points, patients must have been off systemic corti-costeroids, with no prior surgery at the indicated time point.
Statistical Analysis
Statistical analyses were performed using SAS v9.3 (SAS Institute, Cary, NC). For gene expression array data from the RISK cohort, we assessed global differences in expression for each gene among the 4 diagnosis groups using the nonpara-metric Kruskal–Wallis H test with false-discovery rate to control the type 1 error rate at 0.05. We then performed pairwise comparisons between diagnosis groups only for genes passing the omnibus test using the Mann–WhitneyUtest with false-discovery rate correction. Correlation of expression be-tween genes was assessed by the Spearman rank correlation coefficient. Principal component analysis incorporating all array gene expression data was performed using Genespring GS (Agilent Technologies). We applied unsupervised hierar-chical clustering (Genespring GS) to identify patient clusters with unique gene expression patterns. To validate gene expression differences discovered in the RISK cohort in the independent Cincinnati cohort, we compared expression of selected genes and RHI using the Kruskal–Wallis H test fol-lowed by pairwise comparisons using the Mann–Whitney
U test only if the omnibus test was significant. In a sensitivity analysis to control for histologic disease activity within the local Cincinnati cohort, patients with CD and UC were matched on RHI (within 1 point) and gene expression was compared using the Wilcoxon signed-rank test. We assessed the perfor-mance of gene expression to distinguish UC from CDc and to predict clinical outcomes in UC patients using logistic regres-sion. The regression model for distinguishing UC from CDc was validated internally across 1000 random samples of equal size RNA and DNA, but not protein, are available for study. This
analysis included a representative subgroup of RISK partici-pantswithUC(n¼ 56),colon-onlyCD(CDc,n ¼36), ileoco-lonicCD(CDic,n¼ 46),and non-IBDcontrols(n¼49).This constitutes allparticipants within RISKwith rectal RNAwho met study criteria for UC and CDc, and a random sampleof those whomet study criteria for CDic. Only patients with a confirmed diagnosisofCD,UC,ornon-IBDbasedon standard clinical and pathologic criteria aftera median of3.3 yearsof follow-upevaluationwereincludedinthisanalysis.Tomeetthe studydefinitionofCDin RISK,patientseventually musthave beenfoundtohaveatleast2ofthefollowing:signsor symp-toms consistent with CD (diarrhea, abdominal pain, rectal bleeding, malaise,weightloss,or lineargrowthfailure), endo-scopic findings of discontinuous ulceration or cobblestoning, and/or histopathologic findings of patchy inflammatory cell infiltrates or epithelial granuloma. Detailed granular data regarding anatomic diseaseinvolvement wasobtained forall participants intheRISKcohort.Forthepurposesofthis anal-ysis, all participants with UC and CD must have shown macroscopic inflammation in the rectum at the time of biopsy collection. Participantswith UC musthave received a mostrecentdiagnosisofUC,shownmacroscopicinflammation intherectum(becauseRNAanalyzedinthisstudywasisolated from rectal biopsy specimens), absence of macroscopic inflammationintheileumattheirenrollmentendoscopy,and absenceofevidenceofjejunalinflammation.Participantswith CDc must have received a most recent diagnosis of CD and shown macroscopic inflammation in the rectum with an absenceofmacroscopicinflammationintheileumorjejunum. Participants with CDic must have received a most recent diagnosisofCDandshownmacroscopic inflammationinboth therectumandileum.Non-IBDcontrolparticipantsmusthave received a most recent diagnosis of non-IBD and shown macroscopicallyandmicroscopicallynormalileumandcolon.
Cincinnati
Cohort
Under a protocol approved by the Cincinnati Children’s Hospital Medical Center Institutional Review Board, patients presentingforroutinecolonoscopyforclinicalindicationswere enrolled inaseparateindependentlocalCincinnaticohortfor the purposesofvalidating thefindingsfromthe RISKcohort. Patientsinthe CincinnaticohortwerenotintheRISKcohort. Clinical information was collected at the time of enrollment. RectalbiopsyspecimenswereplacedinRNALaterandstoredat -80C. Only patients with macroscopic inflammation in the rectum at endoscopy were included in the analysis. H&E-stainedsectionsfromrectalbiopsyspecimenswerescoredbya pediatric pathologistblinded to diagnosisusingthe validated RobartsHistopathologyIndex(RHI).11
Real-Time
RT-qPCR
between the subset of RISK cohort patients included in this study and the overall RISK cohort other than for
charac-teristics within the specific inclusion or exclusion criteria
for this study (Supplementary Table 2). All participants
with CDic, CDc, and UC in the studied subset showed
macroscopic rectal inflammation at endoscopy, compared
with 67.5%, 74.8%, and 88.5%, respectively, in the overall RISK cohort (relative rectal sparing can be an atypical feature of pediatric UC). We only included participants
showing macroscopic rectal inflammation to limit the effect
of differences in rectal inflammation on the analysis. In
addition, no patients in the studied subset of CDc
partici-pants showed jejunal inflammation compared with 9.5% of
CDc participants in the overall RISK cohort. Although jejunal involvement (Paris L4b) does not preclude the designation
of colon-only CD (Paris L2) based on the Paris classifi
ca-tion,14 we excluded participants with jejunal disease from
our CDc group because these patients can be distinguished easily from UC patients based on anatomic disease distri-bution alone.
Among 16 candidate reference gene controls assessed, glyceraldehyde-3-phosphate dehydrogenase showed the least variable expression across diagnosis groups (SD of Cq, 0.55), and was included in the gene expression array as the endogenous control against which we normalized
results (Supplementary Figure 1).
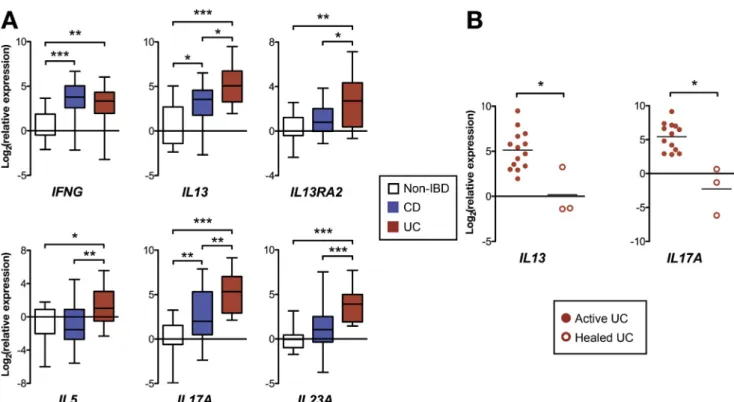
The rectal relative expression of the 22 genes assayed normalized to the median of non-IBD patients is detailed in
Figure 1A (the assay for CLDN2 did not amplify and is
excluded from the results). Compared with non-IBD
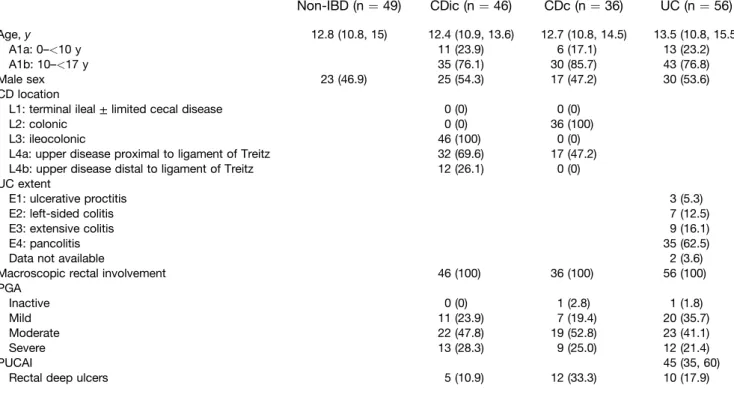
Table 1.Baseline Characteristics of RISK Cohort Patients Studied
Non-IBD (n¼49) CDic (n¼46) CDc (n¼36) UC (n¼56)
Age,y 12.8 (10.8, 15) 12.4 (10.9, 13.6) 12.7 (10.8, 14.5) 13.5 (10.8, 15.5)
A1a: 0–<10 y 11 (23.9) 6 (17.1) 13 (23.2)
A1b: 10–<17 y 35 (76.1) 30 (85.7) 43 (76.8)
Male sex 23 (46.9) 25 (54.3) 17 (47.2) 30 (53.6)
CD location
L1: terminal ileal±limited cecal disease 0 (0) 0 (0)
L2: colonic 0 (0) 36 (100)
L3: ileocolonic 46 (100) 0 (0)
L4a: upper disease proximal to ligament of Treitz 32 (69.6) 17 (47.2) L4b: upper disease distal to ligament of Treitz 12 (26.1) 0 (0) UC extent
E1: ulcerative proctitis 3 (5.3)
E2: left-sided colitis 7 (12.5)
E3: extensive colitis 9 (16.1)
E4: pancolitis 35 (62.5)
Data not available 2 (3.6)
Macroscopic rectal involvement 46 (100) 36 (100) 56 (100)
PGA
Inactive 0 (0) 1 (2.8) 1 (1.8)
Mild 11 (23.9) 7 (19.4) 20 (35.7)
Moderate 22 (47.8) 19 (52.8) 23 (41.1)
Severe 13 (28.3) 9 (25.0) 12 (21.4)
PUCAI 45 (35, 60)
Rectal deep ulcers 5 (10.9) 12 (33.3) 10 (17.9)
NOTE. Quantitative variables are expressed as medians (quartile 1, quartile 3), and dichotomous variables are shown as n (%). PUCAI, Pediatric Ulcerative Colitis Activity Index.
using a random sampling with replacement bootstrap tech-nique.Toassessthecontributionofdegreeofinflammationto the observeddifferencesin geneexpressionbetween UCand CDc,bivariatelogisticregressionwasperformedforeachtarget gene withsignificant differences in geneexpression between UCand CDcandS100A8.Achangeineffectestimatebetween univariateandbivariateanalysiswithS100A8oflessthan10%, 10%–20%,orgreaterthan20%wereinterpretedasno,mild, or moderate confounding by S100A8, respectively.13 S100A8
wasforcedintothefinalmultivariatemodelforpredictingUC from CDc to determine the contribution of the degree of inflammationtothefinalmodel.Baselinecharacteristicsamong gene expression patient clusters were compared using the Kruskal–Wallis H test for continuous variables or the chi-squaretestfornominalvariables.Theassociationbetween geneexpressionclusterandclinicaloutcomesintheUCgroup wasassessedbytheFisherexacttest.
Sample
Size
and
Power
Wedeterminedthatasamplesizeof40patientsper diag-nosis group would provide 90% power to detect a 1.5-fold difference in expression while controlling the type I error rateat1%formultiplicity.
Results
RISK
Cohort
Rectal
Mucosal
Gene
Expression
Demographicsandbaselinecharacteristicsofthesubset
oftheRISKcohortparticipantsstudiedforthisanalysisare
We sought to compare rectal histopathologic disease activity between the macroscopically involved rectums of CD and UC patients in the Cincinnati cohort, acknowledging the challenge that no histopathologic index exists that has been validated for pediatric UC or CD, or for comparing between CD and UC patients. Therefore, histopathologic activity was compared between patient groups using the RHI, a validated UC index that assesses the following
fea-tures common to both UC and CD: chronic inflammatory
infiltrate, lamina propria neutrophils, neutrophils in the
epithelium, and erosion or ulceration.11 The median RHI
was significantly higher in the macroscopically inflamed
rectums of UC compared with CD patients (Supplementary
Figure 2A). Therefore, to determine whether differences in
gene expression are explained by differences in histopath-ologic severity, we performed a sensitivity analysis comparing gene expression between a subset of 10 UC and
CD patients matched on RHI (Supplementary Figure 2BandC).
In this smaller subset of RHI-matched patients, there was
significantly increased rectal relative expression ofIL13and
IL13RA2 in UC compared with CD patients. Furthermore, other gene expression relationships between UC and CD were maintained with numerically (but not statistically
significantly) increased relative expression ofIL17A,IL23A,
and IL5, and equivalent IFNG expression in UC compared
with CD.
To determine if healing on treatment is associated with
changes in IL13 and IL17A expression, we compared
mucosal gene expression between UC patients in the Cin-cinnati cohort, all with active endoscopic disease, with 3 additional UC patients with complete mucosal healing on treatment (Mayo endoscopic score, 0; all female; ages 7, 9,
and 20 years; healing achieved on 6-mercaptopurine þ
infliximab, mesalamine alone, and mesalamine and oral
corticosteroids, respectively). Both IL13A and IL17A
expression were decreased significantly in the patients with
mucosal healing compared with those with active
endo-scopic disease (Figure 2B).
IL5 and IL17 Expression Distinguish UC From
Colitis-Only CD
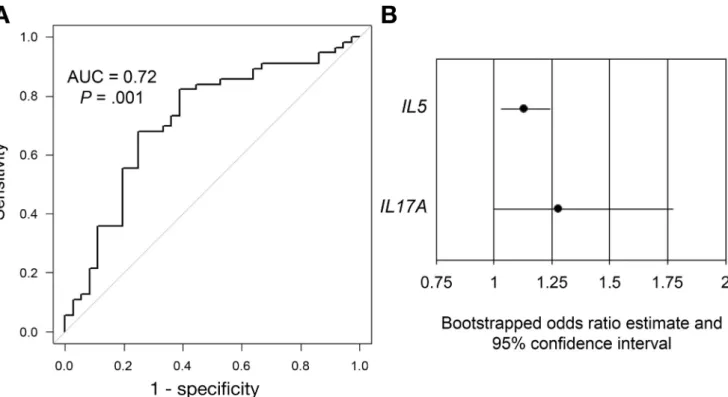
To determine the ability of gene expression to discrim-inate UC from CDc, we applied univariate logistic regression
using only the genes with significant differential expression
between UC and CDc (Supplementary Table 4). Using
multivariate logistic regression, we determined that a model
including IL5 and IL17A gene expression best balanced
parsimony with discriminatory ability (P¼.001; area under
the curve, 0.72) (Table 3 and Figure 3A). We internally
validated the model using bootstrap random sampling with replacement and showed that the bootstrapped estimates
for the odds ratios (ORs) for bothIL5and IL17Awere
sig-nificant with 95% confidence intervals (CIs) not crossing 1
(Figure 3B).
Although there was not a significant difference in
S100A8 expression between UC and CDc, we sought to determine the degree to which differences in other genes
were confounded by general inflammatory activity. For
patients, UC patients were the only group that showed
significantlyincreasedrectalexpressionofthegenesforthe
type 2 cytokines IL5 and IL13 (no group showed signifi
-cantlyincreasedexpression ofIL4).IL17Aand IL23Awere
increased significantly in UC and CDc, but not in CDic,
compared with non-IBD. Interferon-g and IL22expression
were increased similarly in all 3 groups compared with
non-IBD.
Compared with CDc patients with macroscopic rectal
involvement, UC patients showed significantly increased
rectalexpressionofgenesassociatedwithtype2([IL5,IL13,
IL13RA2,induciblet-cellcostimulator[ICOS],and the
tran-script formembrane-bound IL33receptor, IL1RL1[m])and
type 17 (IL17A, IL23A) immune responses. Of note,
expression ofthe inflammatorymarker S100A8, which
en-codes a subunit of calprotectin, was not significantly
different betweenUCand CDcpatients.
ConsistentwiththefindingofincreasedIL13andIL17A
expression in UCpatients, we observed moderate
correla-tion (r2 ¼ .18; P < .0001) between IL13 and IL17A
expression among all IBD patients. However, among UC
patients, we observed no significant correlation between
IL13andIL17Aexpression(r2¼ .057;P¼ .076).
Principalcomponentanalysis(Figure1B),incorporating
all genesanalyzed,identified2groupsofpatients. Group1
included most of the UC and CDc patients, and group 2
included mostofthenon-IBD patients. CDicpatientswere
intermixedbetweenthe2principalcomponentgroups.
Unsupervisedhierarchicalclusteringsegregatedpatients
into 5clusters based ongene expression (Figure 1C). The
largest aggregate of a single diagnosis was UC patients
within cluster2, whichwas defined by highexpression of
IL13and IL5,and alsohigh expression ofCCL11,IL13RA2,
CHI3L1,S100A8,IL23A,andIL17A.Cluster2wascomposed
of 59.1% UC patients (46.4% of all the UC patients) and
6.8%non-IBDpatients.Theremainingclustersweredefined
bydifferencesinIL5and IL13expression,with more
vari-ableandlowerexpressionoftheremaininggenescompared
with cluster 2. Cluster 4, which showed undetectable
expressionofIL5and IL13,comprisedthelargestgroupof
non-IBDpatients(43.5%non-IBD,40.8%ofallthenon-IBD
patients).Thisunequaldistributionofdiagnosesamongthe
clusterswasstatisticallysignificant,whereasotherbaseline
characteristics weresimilar(Table2).
Validation
of
RISK
Cohort
Differential
Rectal
Gene
Expression
in
the
Cincinnati
Cohort
Demographicsandbaselinecharacteristicsofpatientsin
theCincinnaticohortaredetailedinSupplementaryTable3.
Rectal biopsy specimens were analyzed from 17 non-IBD,
20CD,and14UCpatients.AllCDand UCpatientsshowed
macroscopicinflammationintherectum.SimilartotheRISK
Cohort, UC patients in our Cincinnati cohort showed
increasedrectalexpressionofIL5,IL13,IL13RA2,IL17A,and
IL23AcomparedwithCD patientswithcolitisandnon-IBD
patients (Figure2A). Alsoconsistent with the RISKcohort
findings, UC and CD patients showed similarly increased
analysis withS100A8(Supplementary Table 5). We detected
no evidence of confounding by S100A8 (<10% change in
effect estimate) for IL5, IL1RL1(m), IL17A, and IL23A,
genes that showed significantly different expression
betweenUCandCDc, wecomparedtheeffectestimate
patients. We observed that patients in clusters 1, 2, and 3
were significantly more likely to show clinical response at
6 months (trend for remission), and clinical response and remission at 12 months, compared with those in clusters 4
and 5 (Table 4). The major distinguishing gene expression
difference between these groups was increased IL13gene
expression in clusters 1–3 with essentially undetectable
IL13expression in clusters 4 and 5. Baseline characteristics
and medication exposures by 6 and 12 months were
similar between UC patients in clusters 1–3 compared
with clusters 3 and 4, with the exception of exposure to
anti–tumor necrosis factor (TNF) biologics, which occurred
numerically, but not statistically significantly, more often in
clusters 4 and 5 (Supplementary Table 8). By 6 months,
16.1% of patients in clusters 1–3 and 30.8% of patients in
clusters 4 and 5 were exposed to an anti-TNF biologic drug
(P ¼ .414), and 25.0% of patients in clusters 1–3 and
54.5% of patients in clusters 4 and 5 by 12 months
(P¼.131). It is likely that the numerically increased and
earlier infliximab exposure in clusters 4 and 5 is an
addi-tional reflection of the poorer clinical response of this
group to first-line therapies (ie, corticosteroids,
mesal-amine, and thiopurines) compared with that of patients in
clusters 1–3. We did not find any association between
IL13 expression or gene expression cluster and clinical
outcomes in CD.
evidence ofonly mildconfounding(10%–20%change)for
IL13, and evidence of moderate confounding (20%–30%)
forIL13RA2andICOS.Furthermore,whenS100A8isforced
into ourfinal modelwith IL5 and IL17A,S100A8does not
contribute any predictive value for UC over CDc to the
model, and the overall model characteristics and
perfor-mance are unchanged with an unchanged area under the
curveof0.72(SupplementaryTable6).
Gene
Expression
Predicts
Clinical
Outcome
in
UC
Patients
Of the 56 UC patients in the RISK cohortwe studied,
outcome data were available for44 and37 patients at 6
and12months,respectively.Weappliedunivariatelogistic
regression to determinewhetherany ofthe 6 geneswith
differential expression between UC and CDc predicted
steroid-free clinical remission or response at 6 or 12
months (Supplementary Table 7). We found that higher
IL13 expression was associated significantly with an
increased likelihood of clinical response at 6 (OR, 1.182;
95% CI,1.028–1.359) or 12 months (OR, 1.172; 95% CI,
1.012–1.359),andatrendtowardassociationwith clinical
remissionat12months(OR,1.126;95%CI,0.978–1.297).
We then assessed whether the unsupervised clustering
basedongeneexpressionpredictedclinicaloutcomesinUC
Figure 1.Results of microfluidic RT-qPCR gene expression array on rectal mucosal RNA from RISK cohort patients. (A)Box
and whisker chart showing gene expression for each target gene on the array for each IBD diagnostic subphenotype
normalized to median expression of the non-IBD patient group (boxesrepresent medians and interquartile range,whiskers represent the 95% CI). (B) Principal component analysis plot showing separation of 2 groups of patients with UC and CDc clustering in group 1 and non-IBD in group 2. (C) Dendrogram and heatmap showing the results of unsupervised hierarchical clustering using genes with differential expression between at least 2 diagnosis groups. UC patients aggregate within cluster 2, which shows high expression of IL13, IL5, and IL17A.IL1RL1(m) and ILRL1(s), transcripts for the membrane-bound and soluble versions of the IL33 receptor, respectively. *P<.05, **P<.01, ***P<.001;#P<.05,##P<.01, and###P<.001 vs non-IBD (allPvalues are false-discovery rate–corrected).
Table 2.Comparison of Baseline Characteristics Between Gene Expression Patient Clusters
Gene expression cluster
Pvalue
1 (n¼25) 2 (n¼44) 3 (n¼39) 4 (n¼46) 5 (n¼27)
Age,y 12.1 (9.3, 14.8) 12.8 (9.4, 15.4) 13.8 (10.7, 15.2) 12.3 (10.8, 14.8) 12.9 (11.3, 15.2) .757
Male sex 11 (44.0) 23 (52.3) 25 (64.1) 28 (60.9) 12 (44.4) .342
Diagnosis
Non-IBD 6 (24.0) 3 (6.8) 9 (23.1) 20 (43.5) 7 (25.9) <.001
CDic 8 (32.0) 9 (20.5) 11 (28.2) 10 (21.7) 8 (29.6)
CDc 4 (16.0) 6 (13.6) 12 (30.8) 8 (17.4) 6 (22.2)
UC 7 (28.0) 26 (59.1) 7 (17.9) 8 (17.4) 6 (22.2)
PGA
Inactive 0 (0) 1 (2.4) 0 (0) 1 (3.8) 0 (0) .119a
Mild 3 (15.8) 17 (41.5) 7 (23.3) 6 (23.1) 5 (25.0)
Moderate 14 (73.7) 13 (31.7) 15 (50.0) 10 (38.5) 10 (50.0)
Severe 2 (10.5) 10 (24.4) 8 (26.7) 9 (34.6) 5 (25.0)
Rectal deep ulcers 4 (21.1) 7 (17.1) 6 (20.0) 6 (23.1) 3 (15.0) .957
NOTE. Quantitative variables are expressed as medians (quartile 1, quartile 3), and dichotomous variables are shown as n (%). Bold text indicatesP<.05.
a
Discussion
In a well-characterized, treatment-naive, pediatric IBD inception cohort, we show that the rectal mucosa of pedi-atric UC patients was distinguished from that of patients
with colon-only Crohn’s disease by increased expression of
genes associated with type 2 and type 17 immune
re-sponses. This finding was not explained by differences in
overall inflammation as measured by S100A8 expression.
Furthermore, in an analysis of prospective data from this
cohort, we show that heightened rectal mucosal IL13
expression at baseline is associated with improved clinical outcomes in pediatric UC.
The involvement of type 2 inflammation in the
patho-genesis of UC has been debated in the literature. Fuss et al1
first described disparate cytokine secretion from lamina
propria mononuclear cells isolated from surgical specimens of adults with UC and CD, with those from UC patients
producing increased IL5 and IL13 and those from CD
pa-tients producing interferon-g.1,2The same group went on to
show that IL13 is produced by natural killer T cells, and that both IL13 and natural killer T cells disrupt epithelial barrier
function.2,4 Accordingly, we previously showed increased
epithelial activation of signal transducer and activator of transcription 6, a transcription factor downstream of IL13
signaling, in pediatric UC.15However, other groups have not
detected increased IL13 production either from lamina propria mononuclear cells or colon tissue of adult or pedi-atric patients, respectively, with UC, perhaps because of differences in the ex vivo experimental techniques for
studies.16,17Here, we provide strong evidence from a large
well-characterized cohort that mucosal type 2 immune responses are involved in the early course of pediatric UC.
Ourfinding of increasedIL17Aexpression in UC is in line
with recent observations by others. The ratio of mucosal IL17A to IL17F expression has been shown to correlate
significantly with endoscopic disease activity in adult UC.18
In addition, increased dual expression of IL17A by
CD4þCD25- regulatory T cells expressing surface
trans-forming growth factor-b in its latent form (LAPþ) reduces
the suppressor activity of these cells in UC.19
A number of groups have examined the ability of mea-sures of immune response type to discriminate CD from UC in adults, but none have made distinctions between CD anatomic subphenotypes or studied newly diagnosed
treatment-naive patients exclusively.12,20,21 A
cross-sectional study of adult patients from Japan similarly
Table 3.Multivariate Logistic Regression for Discriminating UC From CDc
Gene ORa 95% CI Pvalue
IL5 1.130 1.032–1.238 .009
IL17A 1.196 0.976–1.467 .085
a
Odds of a diagnosis of UC over CDc per unit increase in Cq value for the listed gene.
Figure 2.Real-time RT-qPCR of rectal mucosal RNA from patients in the Cincinnati validation cohort. (A)Boxand whisker
chartshowing gene expression normalized to median expression of the non-IBD patient group (boxesrepresent medians and
interquartile range,whiskersrepresent the 95% CI). (B)Dot plotshowing gene expression (normalized to median expression of the non-IBD patient group) in patients with active UC compared with UC patients with endoscopic healing (eachdot repre-sents a single patient, and lines represent the median). *P<.05, **P<.01, ***P<.001.
showed increased mucosal IL13 gene expression in UC
compared with Crohn’s disease, and that a panel of genes
associated with adaptive immune responses could
distin-guish the two.12Similarly, another group showed that the
higher mucosal type 2 and lower type 1 T cells as measured
by flow cytometry distinguishes UC from CD in adult
patients.20 By using a discovery cohort of established
pa-tients, they showed that a model including the percentage of
CD4þT cells positive for interferon-g, T-bet, IL13, and Gata3
was predictive of CD over UC, and validated the model in a small cohort of newly diagnosed patients. However, in the former study, tissues samples were taken from both the colon and the ileum, and in both studies the patients had a mean disease duration of at least 8 years, were on a variety of immune-suppressive treatments, and the CD groups included patients with ileitis, ileocolitis, and colitis. Our
study substantially builds on these prior findings by
showing in a large cohort of newly diagnosed treatment-naive pediatric patients that rectal type 2 and type 17 gene expression not only distinguishes UC from CD, but distinguishes UC from colon-only CD. By studying tissues
from newly diagnosed pediatric patients, our findings
provide insight regarding the mucosal immune response from arguably the earliest practical opportunity in the disease course to study IBD. Because patients are
treat-ment naive, we are assured that the findings are not infl
u-enced by medications with profound effects on immune function. Furthermore, because colitis-only CD is more
common in children than in adults and can be difficult to
distinguish from UC, our study addresses an important clinical problem.
Some investigators have proposed that Crohn’s colitis
should be considered a distinct disease entity from ileal CD. A recent genome-wide association study meta-analysis showed that based on the relative genetic risk for CD vs UC, CDc and CDic are best characterized as intermediate phenotypes between UC and CD ileitis (with CDc being
in-termediate between UC and CDic).22In our immune gene
expression panel, IL17A was expressed intermediately in
CDc and was significantly different from expression in UC
and CDic. CCL11 also showed significantly increased
expression in CDc compared with CDic, similar to in UC. Our principal component analysis, which incorporates the col-lective differences from all the genes analyzed, aggregates CDc patients closer to UC patients, supporting the notion of CDc representing an intermediate phenotype based on gene expression as well as genetic make-up.
Contrary to our initial hypothesis, we observed that pediatric UC patients with a gene expression pattern
marked by increasedIL13expression achieved higher rates
of steroid-free clinical response and remission, and thatIL13
gene expression alone was associated directly with clinical response at 6 and 12 months. The newly diagnosed patients in this study received standard-of-care treatment at the discretion of the treating physician. Other groups have examined markers of adaptive immune responses primarily with regard to response to anti-TNF therapy in adult UC. In
a cohort of adults patients with UC, higher mucosal IL17A
and IFNG gene expression was associated with remission
after infliximab induction therapy.23 IL13 expression was
not assessed in that study. With regard to markers of type 2
immune responses, one group observed fewer Gata3þ
lamina propria T cells in UC patients responding to anti-TNF
agents compared with those without response.20 In
addi-tion, IL13RA2 was among several genes identified in a
mucosal genome-wide expression study as associated with
nonresponse to infliximab in UC.24We did not observe any
significant associations between IL17A, IFNG, or IL13RA2
and clinical outcomes in this pediatric UC cohort. The dis-crepancies between our results and those of other groups likely is owing to our patients being assessed before any IBD-directed therapy, with many achieving remission on either mesalamine or immunomodulator drugs. Only one third of the UC patients in our group were ever exposed to an anti-TNF drug, whereas the patients in these studies
were refractory to first-line therapies with response
specifically to anti-TNF drugs being assessed.
There are 2 potential explanations as to why increased
mucosal IL13 expression at baseline predicts improved
clinical outcomes. Investigations by our group and others have supported a pathogenic role for IL13 and type 2 im-mune responses in human UC and several murine models of colitis including oxazolone-induced colitis and spontaneous
colitis in Wiskott–Aldrich syndrome protein-deficient and
T-cell–receptora–deficient mice.2,4,15,25–31If IL13 indeed is
part of a pathogenic type 2 immune response, then our
re-sults suggest this pathway is suppressed sufficiently by
standard initial therapy, and that a subset of patients with
increased IL13 expression may be more responsive to
treatment. Indeed, we observed that mucosal expression of
IL13 was decreased significantly in patients with
therapy-induced mucosal healing compared with those with active disease.
However, the failure of 2 phase IIa clinical trials of anti-IL13 monoclonal antibodies for the treatment of UC to meet their primary end points draws into question the notion of a
pathogenic role of IL13in UC (although 1 study did meet
significance for important secondary end points including
clinical remission).32,33 It also is possible that improved
outcomes in highIL13expressers is the result of a
protec-tive effect exerted by IL13 induced in the context of
inflammation. Among UC patients in this study, we did not
observe a correlation between IL13and IL17A expression,
suggesting that the production of IL13 may be independent of a Th17 immune response. Indeed, some groups have
observed beneficial roles for IL13 with regard to epithelial
wound healing and goblet cell function (the latter
particularly with regard to helminth expulsion).34–36
IL10-deficient mice also deficient for IL13RA2, the gene for a
neutralizing receptor for IL13, show decreased infl
amma-tion when challenged with a parasite or a nonsteroidal
anti-inflammatory drug, suggesting IL13 activity is protective in
these models.37 Finally, IL33-dependent group 2 innate
lymphoid cells that produce IL5, IL13, and the epidermal
growth factor ligand amphiregulin limit inflammation
induced from epithelial damage in dextran sodium sulfate–
induced colitis in mice.38In line with this last concept, we
References
1. Fuss IJ, Neurath M, Boirivant M, et al. Disparate CD4þ lamina propria (LP) lymphokine secretion profiles in in-flammatory bowel disease. Crohn’s disease LP cells manifest increased secretion of IFN-gamma, whereas ulcerative colitis LP cells manifest increased secretion of IL-5. J Immunol 1996;157:1261–1270.
2. Fuss IJ, Heller F, Boirivant M, et al. Nonclassical CD1d-restricted NK T cells that produce IL-13 charac-terize an atypical Th2 response in ulcerative colitis. J Clin Invest 2004;113:1490–1497.
3. Wynn TA. Type 2 cytokines: mechanisms and thera-peutic strategies. Nat Rev Immunol 2015;15:271–282.
4. Heller F, Florian P, Bojarski C, et al. Interleukin-13 is the key effector Th2 cytokine in ulcerative colitis that affects epithelial tight junctions, apoptosis, and cell restitution. Gastroenterology 2005;129:550–564.
5. Kappelman MD, Moore KR, Allen JK, et al. Recent trends in the prevalence of Crohn’s disease and ulcerative co-litis in a commercially insured US population. Dig Dis Sci 2012;58:519–525.
6. Adamiak T, Walkiewicz-Jedrzejczak D, Fish D, et al. Incidence, clinical characteristics, and natural history of pediatric IBD in Wisconsin. Inflamm Bowel Dis 2013; 19:1218–1223.
7. Winter DA, Karolewska-Bochenek K, Lazowska-Przeorek I, et al. Pediatric IBD-unclassified is less common than previously reported; results of an 8-year audit of the EUROKIDS registry. Inflamm Bowel Dis 2015;21:2145–2153.
8. Gupta N, Bostrom AG, Kirschner BS, et al. Presentation and disease course in early- compared to later-onset pediatric Crohn’s disease. Am J Gastroenterol 2008; 103:2092–2098.
9. de Bie CI, Pærregaard A, Kolacek S, et al. Disease phenotype at diagnosis in pediatric Crohnʼs disease. Inflamm Bowel Dis 2013;19:378–385.
10. Levine A, Koletzko S, Turner D, et al. The ESPGHAN revised Porto criteria for the diagnosis of inflammatory bowel disease in children and adolescents. J Pediatr Gastroenterol Nutr 2014;58:795–806.
11. Mosli MH, Feagan BG, Zou G, et al. Development and validation of a histological index for UC. Gut 2015; 66:50–58.
12. Iboshi Y, Nakamura K, Ihara E, et al. Multigene analysis unveils distinctive expression profiles of helper T-cell-related genes in the intestinal mucosa that discriminate between ulcerative colitis and Crohn’s disease. Inflamm Bowel Dis 2014;20:967–977.
13. Bliss R, Weinberg J. Determining the probability distri-bution and evaluating sensitivity and false positive rate of a confounder detection method applied to logistic regression. J Biomet Biostat 2012;3:142.
14. Levine A, Griffiths A, Markowitz J, et al. Pediatric modi-fication of the Montreal classification for inflammatory bowel disease: the Paris classification. Inflamm Bowel Dis 2011;17:1314–1321.
15. Rosen MJ, Frey MR, Washington MK, et al. STAT6 activation in ulcerative colitis: a new target for prevention of IL-13-induced colon epithelial cell dysfunction. Inflamm Bowel Dis 2011;17:2224–2234.
16. Biancheri P, Di Sabatino A, Ammoscato F, et al. Absence of a role for interleukin-13 in inflammatory bowel disease. Eur J Immunol 2014;44:370–385.
17. Kadivar K, Ruchelli ED, Markowitz JE, et al. Intestinal interleukin-13 in pediatric inflammatory bowel disease patients. Inflamm Bowel Dis 2004;10:593–598.
18. Iboshi Y, Nakamura K, Fukaura K, et al. Increased IL-17A/IL-17F expression ratio represents the key mucosal T helper/regulatory cell-related gene signature paralleling disease activity in ulcerative colitis. J Gastroenterol 2017;52:315–326.
Therewereseveralnotablestrengthstoourstudy.First,
our findings were from newly diagnosed treatment-naive
pediatric patients, and thus were not influenced by
treat-ment. Second, the cohort was characterized meticulously,
allowingustoexaminedistinctCDanatomicsubphenotypes.
Third, the differencesweobserved were derived from
ex-aminationofexclusivelyrectalsamples,allfrompatientswith
documentedrectal involvement.Fourth,wevalidatedgene
expressiondifferencesbetweencolitisdiagnosesinan
inde-pendentlocalcohort.Aweaknessofthisstudywasthatonly
gene expression and notprotein abundancewasassessed.
TissuesamplesfromtheRISKcohortwerenotcollectedina
manner conducive to protein analysis. Although cytokines
andotherproteinsmayberegulatedatthetranslationalor
post-translationallevel,cytokinegeneexpressionmeasured
by real-time RT-qPCRgenerally correlates quitewell with
measuresofproteinabundance.39–41 Inaddition,althoughwe
didnotobservedifferencesintheexpressionofthetype 1
cytokineIFNGortranscriptionfactorTBX21betweenUCand
CD,wedidnotmeasureexpressionofothertype1cytokines
suchasIL12orTNFB,thuslimitingtheconclusionswecould
drawregardingtherelativecontributionofatype1immune
responsetoUCandCD.
Inconclusion,ourdatasupportaroleformucosaltype2
inflammatoryresponsesintheearlycourseofpediatricUC.
In treatment-naive pediatric patients, UC is distinguished
from Crohn’s colitis, and specifically colon-only CD by
increased expression of genes associated with type 2 and
type 17immuneresponses.Furthermore,animmunegene
expression profile marked by increased expression ofthe
type 2 cytokine IL13 is associated with improved clinical
outcomes in pediatric UC. Future studies are warranted
fromlargeUCcohortstodeterminewhetheratype 2gene
expression predictsresponsetospecificUC therapieswith
the ultimate goal of directing therapies based on patient
immunophenotype.
Supplementary
Material
Note:Toaccessthesupplementarymaterialaccompanying
this article, visitthe online version of Gastroenterology at
www.gastrojournal.org, and at http://dx.doi.org/10.1053/
19. D’Ambrosio A, Cossu A, Amendola A, et al. Lamina propria CD4þLAPþ regulatory T cells are increased in active ulcerative colitis but show increased IL-17 expression and reduced suppressor activity. J Crohns Colitis 2016;10:346–353.
20. Li J, Ueno A, Fort Gasia M, et al. Profiles of lamina propria T helper cell subsets discriminate between ulcerative colitis and Crohn’s disease. Inflamm Bowel Dis 2016;22:1779–1792.
21. Verdier J, Begue B, Cerf-Bensussan N, et al. Compart-mentalized expression of Th1 and Th17 cytokines in pediatric inflammatory bowel diseases. Inflamm Bowel Dis 2012;18:1260–1266.
22. Cleynen I, Boucher G, Jostins L, et al. Inherited de-terminants of Crohn’s disease and ulcerative colitis phenotypes: a genetic association study. Lancet 2016; 387:156–167.
23. Rismo R, Olsen T, Cui G, et al. Mucosal cytokine gene expression profiles as biomarkers of response to infl ix-imab in ulcerative colitis. Scand J Gastroenterol 2012; 47:538–547.
24. Arijs I, Li K, Toedter G, et al. Mucosal gene signatures to predict response to infliximab in patients with ulcerative colitis. Gut 2009;58:1612–1619.
25. Heller F, Fuss IJ, Nieuwenhuis EE, et al. Oxazolone co-litis, a Th2 colitis model resembling ulcerative coco-litis, is mediated by IL-13-producing NK-T cells. Immunity 2002; 17:629–638.
26. Mannon PJ, Hornung RL, Yang Z, et al. Suppression of inflammation in ulcerative colitis by interferon-b-1a is accompanied by inhibition of IL-13 production. Gut 2011; 60:449–455.
27. Fuss IJ, Joshi B, Yang Z, et al. IL-13R 2-bearing, type II NKT cells reactive to sulfatide self-antigen populate the mucosa of ulcerative colitis. Gut 2014;63: 1728–1736.
28. Rosen MJ, Chaturvedi R, Washington MK, et al. STAT6 deficiency ameliorates severity of oxazolone colitis by decreasing expression of claudin-2 and Th2-inducing cytokines. J Immunol 2013;190:1849–1858.
29. Mizoguchi A, Mizoguchi E, Bhan AK. The critical role of interleukin 4 but not interferon gamma in the pathogen-esis of colitis in T-cell receptor alpha mutant mice. Gastroenterology 1999;116:320–326.
30. Nguyen DD, Maillard MH, Cotta-de-Almeida V, et al. Lymphocyte-dependent and Th2 cytokine-associated colitis in mice deficient in Wiskott-Aldrich syndrome protein. Gastroenterology 2007;133:1188–1197.
31. Kawashima R, Kawamura YI, Oshio T, et al. Interleukin-13 damages intestinal mucosa via TWEAK and Fn14 in mice-a pathway associated with ulcerative colitis. Gastroenterology 2011;141:2119–2129.
32. Danese S, Rudzinski J, Brandt W, et al. Tralokinumab for moderate-to-severe UC: a randomised, double-blind, placebo-controlled, phase IIa study. Gut 2015;64: 243–249.
33. Reinisch W, Panés J, Khurana S, et al. Anrukinzumab, an anti-interleukin 13 monoclonal antibody, in active UC: efficacy and safety from a phase IIa randomised multi-centre study. Gut 2015;64:894–900.
34. Seno H, Miyoshi H, Brown SL, et al. Efficient colonic mucosal wound repair requires Trem2 signaling. Proc Natl Acad Sci U S A 2009;106:256–261.
35. Webb RA, Hoque T, Dimas S. Expulsion of the gastrointestinal cestode, Hymenolepis diminuta by tolerant rats: evidence for mediation by a Th2 type immune enhanced goblet cell hyperplasia, increased mucin production and secretion. Parasite Immunol 2007;29:11–21.
36. McKay DM, Khan WI. STAT-6 is an absolute requirement for murine rejection of Hymenolepis diminuta. J Parasitol 2003;89:188–189.
37. Wilson MS, Ramalingam TR, Rivollier A, et al. Colitis and intestinal inflammation in IL10-/- mice results from IL-13Ra2-mediated attenuation of IL-13 activity. Gastroenterology 2011;140:254–264.
38. Monticelli LA, Osborne LC, Noti M, et al. IL-33 promotes an innate immune pathway of intestinal tissue protection dependent on amphiregulin–EGFR interactions. Proc Natl Acad Sci U S A 2015;112:10762–10767.
39. Young S-H, Antonini JM, Roberts JR, et al. Performance evaluation of cytometric bead assays for the measure-ment of lung cytokines in two rodent models. J Immunol Methods 2008;331:59–68.
40. Sullivan KE, Cutilli J, Piliero LM, et al. Measurement of cytokine secretion, intracellular protein expression, and mRNA in resting and stimulated peripheral blood mono-nuclear cells. Clin Diagn Lab Immunol 2000;7:920–924. 41. Flores MG, Zhang S, Ha A, et al. In vitro evaluation of the
effects of candidate immunosuppressive drugs: flow cytometry and quantitative real-time PCR as two inde-pendent and correlated read-outs. J Immunol Methods 2004;289:123–135.
Received September 22, 2016. Accepted January 23, 2017.
Reprint requests
Address requests for reprints to: Michael J. Rosen, MD, MSCI, Division of Gastroenterology, Hepatology and Nutrition, Cincinnati Children’s Hospital
Medical Center, MLC 2010, Cincinnati, Ohio 45229. e-mail:
[email protected]; fax: (513) 636-5581.
Acknowledgments
The authors thank the following RISK study investigators for their efforts in
enrolling, phenotyping, and following up participants in this cohort:
Anthony R. Otley, Scott B. Snapper, Stephen L. Guthery, David J. Keljo, Barbara S. Kirschner, Marian D. Pfefferkorn, Maria Oliva-Hemker, Ashish S. Patel, Shervin Rabizadeh, Stanley A. Cohen, David A. Ziring, and Jonathan
Evans. Neal S. Leleiko enrolled research participants and secured
biospecimens, and critical revision of the manuscript for important
intellectual content. The authors also thank the patients and their families who participated in this study.
Conflicts of interest
These authors disclose the following: Michael J. Rosen has served on an advisory board for Abbvie and receives research support from Prometheus Laboratories; Jeffrey S. Hyams has served on advisory boards for Janssen and Abbvie, and as a consultant for Lilly, Celgene, Takeda, Astra Zeneca, and Receptos; David R. Mack has served on advisory boards for Abbvie, Janssen, and Mead Johnson, as a consultant for UCB, and is a shareholder of Biotagenics; Melvin B. Heyman has received research support from Janssen, Genentech, Sucampo, and Abbvie, and has served as an advisor for Gilead; Michael D. Kappelman has received research support from and served as a consultant for Janssen and Abbvie; Joel R. Rosh has received research support from and served as an advisor for Janssen and Abbvie; Thomas D. Walters has received speaker fees and research support from and served on advisory boards for Janssen Canada and Abbvie Canada; and Lee A. Denson has received research support from Janssen and royalties
Database), National Institute of Diabetes and Digestive and Kidney Diseases P30DK078392 (Gene and Protein Expression Core) of the Digestive Disease Research Core Center in Cincinnati, National Institutes of Health P30ES006096 of the University of Cincinnati College of Medicine Center for Environmental Genetics (Genomics, Epigenomics, and Sequencing Core), National Institutes of Health R01DK090119 and the
Crohn’s and Colitis Foundation Senior Research Award (S.P.H.), National
Institutes of Health K23DK105229 (P.M.), and the Gutsy Kids Fund including a philanthropic donation from the Karen and Brock Wagner Family (R.K.).
Funding
Research reported in this publication was supported primarily by the
National Institute of Diabetes andDigestive andKidneyDiseases of the
National Institutes of Health K23DK094832 (M.J.R.). Biospecimens were
obtained fromtheRisk Stratification andIdentificationof Immunogenetic
and Microbial Markers of Rapid Disease Progression in Children with
Crohn’s Disease (RISK) Study, funded by the Crohn’s and Colitis
Foundation. This project also was supported in part by the National
Institutes of Health Clinical and Translational Science Award
Supplementary Table 1.Targets on Gene Expression Array
Gene Protein function Assay ID
IL4 Type 2 cytokine Hs00174122_m1
IL5 Type 2 cytokine Hs00174200_m1
IL13 Type 2 cytokine Hs00174379_m1
IL13RA2 Type 2 cytokine receptor/protein induced by IL13 Hs00152924_m1
IL33 Cytokine that induces type 2 immune responses Hs01125943_m1
IL1RL1(s) IL33 receptor (soluble) that regulates type 2 immune responses Hs01073297_m1 IL1RL1(m) IL33 receptor (membrane) that induces type 2 immune responses Hs01073295_m1 CCL11 Chemokine associated with eosinophil recruitment and type 2 immune responses Hs00237013_m1 CHI3L1 Protein induced by type 2 immune responses Hs00609691_m1 ICOS T-cell co-stimulatory molecular that augments type 2 immune responses Hs00359999_m1 GATA3 Type 2 T-cell transcription factor Hs00231122_m1
RORA Group 2 innate lymphoid cell transcription factor Hs00536545_m1
CLDN2 Tight junction protein induced by IL13 Hs01549234_m1
IFNG Type 2 cytokine Hs00174143_m1
TBX21 Type 1 transcription factor Hs00203436_m1
IL17A Type 17 cytokine Hs00174383_m1
IL23A Cytokine that augments type 17 immune responses Hs00372324_m1
RORC Type 17 transcription factor Hs01076122_m1
IL22 Type 17 cytokine Hs01574154_m1
AHR Group 3 ILC transcription factor Hs00169233_m1
IL10 T-regulatory cell cytokine Hs00174086_m1
TGFB1 Cytokine that induces T-regulatory cell and type 17 T-cell differentiation Hs00171257_m1 S100A8 Component of calprotectin/marker of inflammation Hs00374264_g1
Supplementary Table 2.Comparison Between the Studied RISK Cohort Subset and Overall RISK Cohort
Entire RISK cohort (N¼1812)
Non-IBD CDic CDc UC
Studied subset (N¼49)
RISK cohort (N¼408)
Studied subset (N¼46)
RISK cohort (N¼606)
Studied subset (N¼36)
RISK cohort (N¼210)
Studied subset (N¼56)
RISK cohort (N¼200)
Age,y 12.7 (9.9, 14.9) 12.8 (10.8, 15.0) 12.7 (9.5, 15.0) 12.4 (10.9, 13.6) 12.4 (9.9, 14.7) 12.7 (10.8, 14.5) 12.5 (9.4, 15.0) 13.5 (10.8, 15.5) 13.1 (10.2, 15.0)
A1a: 0 to<10 y 460 (25.4) 9 (18.4) 116 (28.7) 11 (23.9) 152 (25.1) 6 (17.1) 57 (27.1) 13 (23.2) 49 (24.5)
A1b: 10 to<17 y 1348 (74.6) 39 (79.6) 288 (71.3) 35 (76.1) 454 (74.9) 30 (85.7) 153 (72.9) 43 (76.8) 151 (75.5)
Male sex 1055 (58.2) 23 (46.9) 226 (55.4) 25 (54.3) 377 (62.2) 17 (47.2) 120 (57.1) 30 (53.6) 106 (53.0)
Diagnosis
Non-IBD 408 (22.5) 49 (100) 408 (100) 0 (0) 0 (0) 0 (0) 0 (0) 0 (0) 0 (0)
CD 1118 (61.7) 0 (0) 0 (0) 46 (100) 606 (100) 36 (100) 210 (100) 0 (0) 0 (0)
UC 200 (11.0) 0 (0) 0 (0) 0 (0) 0 (0) 0 (0) 0 (0) 56 (100) 200 (100)
IBD-U 86 (4.7) 0 (0) 0 (0) 0 (0) 0 (0) 0 (0) 0 (0) 0 (0) 0 (0)
CD locationa
L1 181 (16.2) 0 (0) 0 (0) 0 (0) 0 (0)
L2: 210 (18.8) 0 (0) 0 (0) 36 (100) 210 (100)
L3 606 (54.2) 46 (100) 606 (100) 0 (0) 0 (0)
L4 only 18 (1.6) 0 (0) 0 (0) 0 (0) 0 (0)
Insufficient data 103 (9.2) 0 (0) 0 (0) 0 (0) 0 (0)
Upper GI
L4a 531 (47.5) 32 (69.6) 322 (53.1) 17 (47.2) 82 (39.0)
L4b 147 (13.1) 12 (26.1) 97 (16.0) 0 (0) 20 (9.5)
UC extentb
E1 5 (2.5) 2 (3.6) 5 (2.5)
E2 26 (13.0) 7 (12.5) 26 (13.0)
E3 22 (11.0) 7 (12.5) 22 (11.0)
E4 112 (56.0) 36 (64.3) 112 (56.0)
Insufficient data 35 (17.5) 4 (7.1) 35 (17.5)
Macroscopic rectal involvement
846 (60.3) 46 (100) 409 (67.5) 36 (100) 157 (74.8) 56 (100) 177 (88.5)
PGA
Inactive 50 (3.6) 0 (0) 13 (2.1) 1 (2.8) 11 (5.2) 1 (1.8) 7 (3.5)
Mild 458 (32.6) 11 (23.9) 168 (27.7) 7 (19.4) 62 (29.5) 20 (35.7) 63 (31.5)
Moderate 684 (48.7) 22 (47.8) 324 (53.5) 19 (52.8) 106 (50.5) 23 (41.1) 101 (50.5)
Severe 209 (14.9) 13 (28.3) 98 (16.2) 9 (25.0) 31 (14.8) 12 (21.4) 29 (14.5)
Insufficient data 3 (0.2) 0 (0) 3 (0.5) 0 (0) 0 (0) 0 (0) 0 (0)
PUCAI 45 (30, 60) 45 (35, 60) 45 (30, 60)
Rectal deep ulcers 158 (11.3) 5 (10.9) 75 (12.4) 12 (33.3) 36 (17.1) 10 (17.9) 28 (14.0)
NOTE. Quantitative variables are expressed as medians (quartile 1, quartile 3), and dichotomous variables are shown as n (%). IBD-U, inflammatory bowel disease unclassified; PUCAI, Pediatric Ulcerative Colitis Activity Index.
a
L1, terminal ileal±limited cecal disease; L2, colonic; L3, ileocolonic; L4, upper gastrointestinal (GI) disease; L4a, upper GI disease proximal to ligament of Treitz, and L4b: upper GI disease distal to ligament of Treitz.
b
Supplementary Table 3.Characteristics of the Cincinnati Cohort Patients
Non-IBD (n¼17) CD (n¼20) UC (n¼14)
Age at biopsy collection,y 15.8 (10.5, 16.6) 15.0 (11.2, 6.7) 18.0 (14.5, 19.0)
Male sex 7 (41.2) 15 (75.0) 25 (54.3)
Age at diagnosis,y 10.6 (9.2, 10.6) 14.4 (11.6, 16.5)
A1a: 0 to<10 y 8 (40.0) 3 (21.4)
A1b: 10 to<17 y 11 (55.0) 10 (71.4)
A2: 17–40 y 1 (5.0) 1 (7.1)
Time since diagnosis,y 2.2 (0, 4.7) 2.8 (1.0, 6.2)
Biopsy specimen collected at diagnostic endoscopy 9 (45.0) 0 (0.0)
CD location
L1: terminal ileal±limited cecal disease 0 (0) 0 (0)
L2: colonic 8 (40.0) 0 (0)
L3: ileocolonic 12 (60.0) 46 (100)
L4a: upper disease proximal to ligament of Treitz 11 (55.0) 32 (69.6)
L4b: upper disease distal to ligament of Treitz 2 (10.0) 12 (26.1)
UC extent
E1: ulcerative proctitis 1 (7.1)
E2: left-sided colitis 3 (21.4)
E3: extensive colitis 3 (21.4)
E4: pancolitis 7 (50.0)
Macroscopic rectal involvement 20 (100) 14 (100)
Clinical disease activity
shPCDAI 25 (12.5, 35)
PUCAI 30 (15, 60)
Endoscopic disease activity 22 (47.8)
SES-CD 12 (8.5, 17)
Mayo endoscopic score
Mild 4 (28.6)
Moderate 3 (21.4)
Severe 7 (50.0)
Medications
None 5 (25.0) 0 (0.0)
Oral corticosteroids 2 (10.0) 7 (50.0)
Rectal corticosteroids 1 (5.0) 2 (14.3)
Oral mesalamine 4 (20.0) 10 (71.4)
Antibiotic 3 (15.0) 0 (0.0)
6-mercaptopurine or azathioprine 5 (25.0) 2 (14.3)
Methotrexate 0 (0.0) 1 (7.1)
Anti-TNF biologic 2 (10.0) 3 (21.4)
NOTE. Quantitative variables are expressed as medians (quartile 1, quartile 3), and dichotomous variables are shown as n (%). PUCAI, Pediatric Ulcerative Colitis Activity Index; SES-CD, Simple Endoscopic Score for Crohn’s Disease; shPCDAI, Short Pediatric Crohn’s Disease Activity Index.
Supplementary Table 4.Univariate Logistic Regression for Discriminating UC From CDc
Gene ORa 95% CI Pvalue
IL5 1.147 1.050–1.644 .003
IL13 1.100 0.998–1.212 .056
IL13RA2 1.311 1.045–1.644 .020 IL1RL1(m) 1.798 1.129–2.865 .014
ICOS 1.435 0.923–2.229 .109
IL17A 1.265 1.032–1.551 .024 IL23A 1.391 1.063–1.821 .016
a
Supplementary Table 5.Change in Effect Estimate After Bivariate Analyses WithS100A8
Gene
Effect estimate
Change,% Univariate Bivariate
IL5 0.138 0.126 -8.6
IL13 0.095 0.078 -18.1
IL13RA2 0.270 0.332 þ22.8 IL1RL1(m) 0.587 0.561 -4.4
ICOS 0.361 0.277 -23.3
IL17A 0.235 0.232 -1.7
IL23A 0.330 0.328 -0.7
Supplementary Table 6.Inclusion ofS100A8in Multivariate Logistic Regression Model for Discriminating UC From CDc
Gene ORa 95% CI Pvalue
IL5 1.133 1.032–1.238 .009
IL17A 1.232 0.976–1.467 .132 S100A8 0.959 0.747–1.233 .747
a
Supplementary Table 7.Univariate Logistic Regression of Gene Expression for Predicting UC Clinical Outcomes
Gene
Remission Response
6 month 12 month 6 month 12 month
ORa(95% CI) Pvalue OR (95% CI) Pvalue OR (95% CI) Pvalue OR (95% CI) Pvalue
IL5 1.119 (0.978–1.279) .104 1.050 (0.921–1.198) .466 1.116 (0.981–1.271) .095 1.126 (0.979–1.294) .094 IL13 1.115 (0.973–1.279) .118 1.126 (0.978–1.297) .099 1.182 (1.028–1.359) .019 1.172 (1.012–1.359) .034
IL13RA2 1.350 (0.939–1.942) .105 0.847 (0.595–1.208) .359 1.206 (0.855–1.701) .286 1.046 (0.733–1.493) .804 IL1RL1(m) 1.241 (0.618–2.494) .543 0.716 (0.331–1.550) .397 1.751 (0.786–3.891) .144 0.690 (0.314–1.517) .356 ICOS 1.151 (0.581–2.283) .686 1.198 (0.631–2.273) .582 1.032 (0.515–2.066) .930 1.103 (0.570–2.137) .772 IL17A 1.253 (0.919–1.706) .153 1.111 (0.854–1.445) .433 1.239 (0.929–1.650) .170 1.117 (0.861–1.449) .407 IL23A 1.311 (0.887–1.934) .175 1.071 (0.746–1.538) .711 1.199 (0.813–1.767) .360 1.047 (0.718–1.527) .810
NOTE. Bold text indicatesP<.05.
a
Odds of outcome per unit increase in Cq value for the listed gene.
Supplementary Table 8.Comparison of Baseline Characteristics and Medication Exposures Between UC Patient Gene Expression Clusters
Clusters 1–3 (n¼33)
Clusters 4 and 5 (n¼13)
P value
Baseline characteristics
Age,y 13.6 (10.7–15.1) 12.2 (11.5–15.8) .813
Male sex 19 (57.6) 5 (38.5) .330
UC extent E1: ulcerative
proctitis
1 (3.1) 0 (0) .246a
E2: left-sided colitis 2 (6.3) 2 (15.4) E3: extensive colitis 4 (12.5) 4 (30.8) E4: pancolitis 25 (78.1) 7 (53.8) Data not available 1 (3.1) 0 (0) PGA
Inactive 1 (3.0) 0 (0) .546a
Mild 15 (45.5) 4 (30.8)
Moderate 9 (27.3) 5 (38.5)
Severe 8 (24.2) 4 (30.8)
Rectal deep ulcers 5 (15.6) 2 (15.4) 1.00 Medication exposures
6 months n¼31 n¼13
Corticosteroids 24 (77.4) 12 (92.3) .401 Mesalamine 24 (77.4) 11 (84.6) .703 Thiopurines 10 (32.3) 6 (46.2) .496
Methotrexate 0 (0) 0 (0) –
Anti-TNF biologic 5 (16.1) 4 (30.8) .414
12 months n¼28 n¼11
Corticosteroids 23 (82.1) 0 (90.9) .655 Mesalamine 22 (78.6) 9 (81.8) 1.00 Thiopurines 12 (46.4) 4 (36.4) .725
Methotrexate 1 (3.6) 1 (9.1) .489
Anti-TNF biologic 7 (25.0) 6 (54.5) .131
NOTE. Quantitative variables are expressed as medians (quartile 1, quartile 3) and dichotomous variables are shown as n (%).
a