Mathematical and Software Engineering, Vol. 4, No. 1 (2018), 7-11. Varεpsilon Ltd, http://varepsilon.com
Approach to Find Optimal Graphic Container
Using Segmental Steganographic Algorithm
Hristo Paraskevov and Aleksandar Stefanov
Department of Computer Systems and Technologies, Faculty of Mathematics and Informatics, Konstantin Preslavsky University of Shumen, 9712 Shumen,
Bulgaria
Abstract
The article proposes an approach to selecting a suitable graphic container from multiple images for a specific message. Searching for an optimal container requires an analysis that takes into account both the human perception of the image and the mathematical relationships that can be analyzed in detail about the contents of the container. Experimental results have shown that if one image is split into separate zones, and in each one a steganographic embedding of information is applied, in one of them the changes are the least.
Keywords: Steganography; Image processing; Steganalysis; Information security
1 Introduction
Most of the research is aimed at creating improved stereotypes in order to increase the processing speed of embedding and retrieving the secret message, increasing the capacity, increasing the stability of the hidden message after various attacks, using different types of containers, and messages, the use of complex mathematical dependencies, etc.
When improving steganographic methods in image files, the right approach to container selection is also very important. In practice, this choice has to be transformed into a well-thought-out and conducted analysis, where the right indicators must be selected and used to make the best choice.
Incorrect container selection could compromise the hidden transmission of information, regardless of the well selected steganographic algorithm.
2 Methods and Algorithms
Vision is a heuristic process. The three-dimensional vision can be explained as a synthesis. This requires a clear view of vision as a phenomenon and a visual process as a function of the viewer. "We" do not reflect the world outside, and "our brain" transforms the impulses from the eye.
The brain adjusts to see what it sees and does not receive it passively. The brain blends memory, expectation and sensation to generate visual integrity [1,2,3].
objects, trusting them to determine the place of the object in the space.
This gave rise to the idea of the algorithm - to find a suitable area for embedding the hidden message in order to reduce the changes in the container. To make the right choice, not only one but multiple images are used.
The algorithm divides each of the files into zones (sectors) and embeds the hidden message into them. On the basis of certain criteria, all the results obtained are analyzed both in all areas of the file and in all files. The file on the base where the smallest modification was made in a particular area is selected as a container.
From the point of view of obscurity, it is advisable that the size of the carrier file is not too large, because its larger size raises the suspicion that it may be the carrier of other, invisible information at first glance.
There is no precompression block in the algorithm that would allow the volume of the inserted message to be increased. For this reason, the maximum amount of information to be deployed in the image is determined by the size of the sector minus the header information divided by eight. The size of the carrier file does not change when a message is embedded.
3 Results and Discussion
Experiment 1:
In this experiment, all images from the 100 image database were used, and a 14 000 byte text message was generated by Lorem Ipsum.
It aims to fill almost the capacity of the picture container and examine the new file for visual defects and changes in image color, Fig. 1.
(а) Original (b) Stego file
Fig. 1 Visual analysis
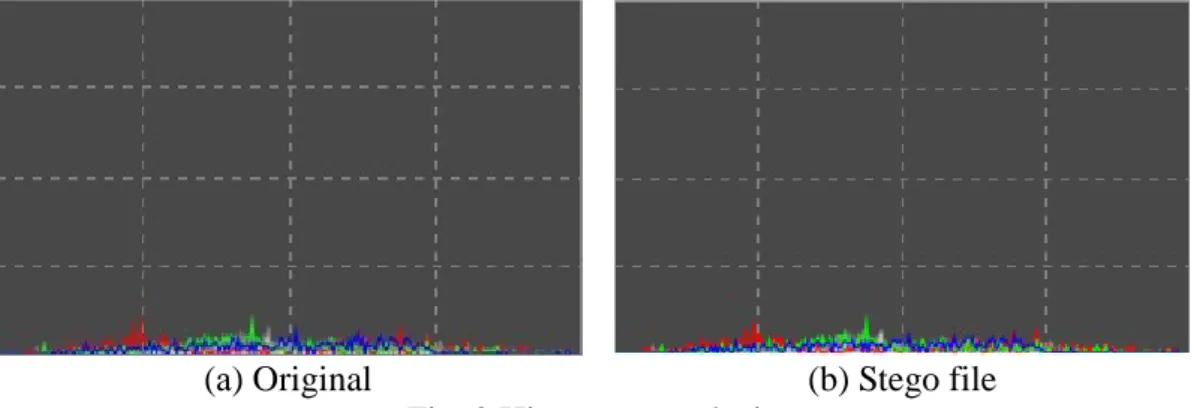
After the visual evaluation, the histograms of the original images and stefofiles were also analyzed, Fig. 2.
(а) Original (b) Stego file
Experiment 2:
Embedding efficiency Ee is the ratio of the size of the largest message that can be
embedded in the container to the container size.
c mes e
V V
Е = . (1)
where:
Vmes – size of hidden message in KB or MB
Vc – size of the container in KB or MB.
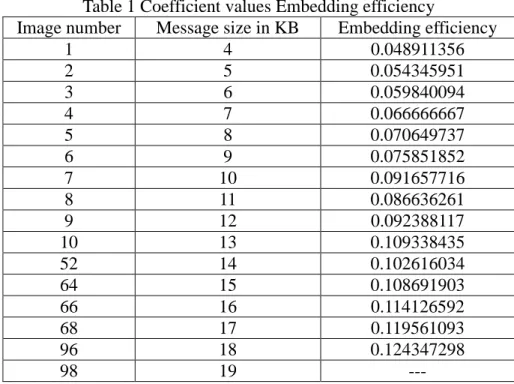
All baseline images were used to examine the Embedding efficiency of the container, with the built-in message of different sizes. The experimental data of randomly selected images is presented in the following Table 1.
Table 1 Coefficient values Embedding efficiency
Image number Message size in KB Embedding efficiency
1 4 0.048911356
2 5 0.054345951
3 6 0.059840094
4 7 0.066666667
5 8 0.070649737
6 9 0.075851852
7 10 0.091657716
8 11 0.086636261
9 12 0.092388117
10 13 0.109338435
52 14 0.102616034
64 15 0.108691903
66 16 0.114126592
68 17 0.119561093
96 18 0.124347298
98 19 ---
The results clearly show the gradual increase in the value of the built-in coefficient. Image 98 shows that the size of the message is larger than the LSB allowable embedding and therefore can not be calculated correctly. This proves that the algorithm fully meets the requirements of the LSB method.
Experiment 3:
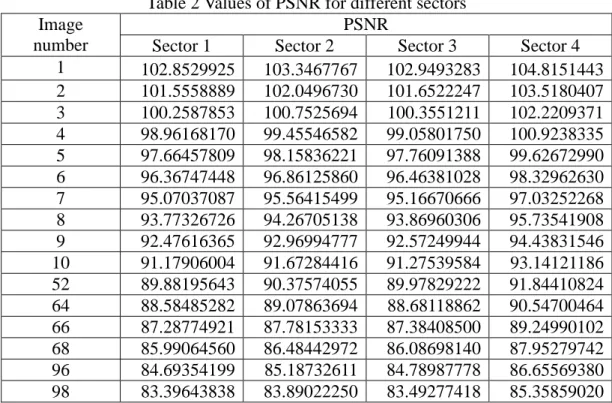
In the PSNR study, all images from the base were used, with the embedded message of varying sizes. The following table, Table 2, presents the experiment data of randomly selected images using sector embedding.
The results clearly show the difference of two units of PSNR values in the same image, depending on the particular sector in which the image is inserted. This means that there is a container from the base that will be most suitable for creating a stegofile.
Experiment 4:
Table 2 Values of PSNR for different sectors Image
number
PSNR
Sector 1 Sector 2 Sector 3 Sector 4
1 102.8529925 103.3467767 102.9493283 104.8151443
2 101.5558889 102.0496730 101.6522247 103.5180407
3 100.2587853 100.7525694 100.3551211 102.2209371
4 98.96168170 99.45546582 99.05801750 100.9238335
5 97.66457809 98.15836221 97.76091388 99.62672990
6 96.36747448 96.86125860 96.46381028 98.32962630
7 95.07037087 95.56415499 95.16670666 97.03252268
8 93.77326726 94.26705138 93.86960306 95.73541908
9 92.47616365 92.96994777 92.57249944 94.43831546
10 91.17906004 91.67284416 91.27539584 93.14121186
52 89.88195643 90.37574055 89.97829222 91.84410824
64 88.58485282 89.07863694 88.68118862 90.54700464
66 87.28774921 87.78153333 87.38408500 89.24990102
68 85.99064560 86.48442972 86.08698140 87.95279742
96 84.69354199 85.18732611 84.78987778 86.65569380
98 83.39643838 83.89022250 83.49277418 85.35859020
The search for the appropriate container for the respective message can be done by looking at the minimum value between the difference in the number of zeros in the container and the stereo file to the difference between the zeros and the units in the container.
(2)
where:
S0 - Count of zeros in the stego file
C0 - Count of zeros in the container
C1 - Count of units in the container
Following the experiment, the following data are obtained, Table 3.
Table 3 TargetCover coefficient values
Image number
Container Stegofile
TargetCover Count of
zeros
Count of units
Count of zeros
Count of units
1 622729 583175 626681 579223 9.991404
2 643600 562304 647266 558638 4.509447
3 633218 571486 635749 568955 4.099981
4 624673 554975 628273 551375 5.165141
5 647594 558310 651318 554586 4.170960
6 530851 678749 537953 671647 4.801958
7 654026 418486 657266 415246 1.375563
8 625098 585222 630523 579797 13.60467
9 696528 509376 697594 508310 0.569590
10 526601 567415 530636 563380 9.886314
as a container and will further seek to select the sector with the smallest changes.
4 Conclusion
Searching for an optimal container requires an analysis that takes into account both the human perception of the image and the mathematical relationships that can be analyzed in detail about the contents of the container.
From the point of view of human perception, it turned out that the eye of a person does not look at all the details of an image, and on the basis of his experience and sensation, the brain complements the areas "not seen" by the eyes. Based on this analysis, the idea of searching for zones in the file, in which changes even if made, will be the least reported.
The analysis of mathematical dependencies has proved the hypothesis that areas can be selected in the file where the changes are minimal.
The experiments have shown a very close connection between the container and the secret message - the same secret message inserted into different files brings different changes to the containers.
Acknowledgements
This work is partially supported by the Scientific fund RD-08-101/06.02.2017.
References
[1] Palmer, S. (1999) Science of Vision:Photons to Phenomenology. Cambridge: The MIT Press.
[2] Marr, D. (1982) Vision. A Computional Investigation into the Human
Representation and Proccssing of Visual Information. New York: W. H. Freeman
and Co., 1982.
[3] Gibson, J. (1986) Ecological Approach to Visual Perception. Hillsdale, New Jersey London & Lawrence Erlbaum Associates.
[4] Helmholtz, H. von (1867) Handbuch der physiologischen Optik.