Item Type
Article
Authors
Hajjaj, Amal; Jaber, Nizar; Alcheikh, Nouha; Younis, Mohammad I.
Citation
Hajjaj, A. Z., Jaber, N., Alcheikh, N., & Younis, M. I. (2020). A
Resonant Gas Sensor Based on Multimode Excitation of a Buckled
Microbeam. IEEE Sensors Journal, 20(4), 1778–1785. doi:10.1109/
jsen.2019.2950495
Eprint version
Post-print
DOI
10.1109/JSEN.2019.2950495
Publisher
Institute of Electrical and Electronics Engineers (IEEE)
Journal
IEEE Sensors Journal
Rights
(c) 2019 IEEE. Personal use of this material is permitted.
Permission from IEEE must be obtained for all other users,
including reprinting/ republishing this material for advertising or
promotional purposes, creating new collective works for resale
or redistribution to servers or lists, or reuse of any copyrighted
components of this work in other works.
Download date
08/01/2021 23:07:18
Abstract— We report a new gas sensing technique based on the
simultaneous tracking of multiple modes of vibration of an electrothermally heated bridge resonator operated near the buckling point. The proposed technique maximizes the sensitivity of the sensor to changes in gases concentrations. We demonstrate a 200% frequency shift in contrast to 0.5% resistance change using the conventional resistive technique. The method also demonstrates selective identification for some gases without the need for surface functionalization of the microstructure. The proposed method is simple in principle and design and is promising for achieving practical low-cost gas sensors.
Index Terms—Gas sensor, multimode, buckling point, heated
microbeam
I. INTRODUCTION
icro and nanoelectromechanical systems (MEMS and NEMS) have experienced rapid growth and demonstrated great potential in wide range of sensing applications, such as ultra-small mass quantification [1-3], gas detection [4-7], pressure measurements [8-10], and charge sensing [11, 12]. This can be attributed to their distinctive features, such as low cost, small footprint, and low power consumptions. Particularly, gas sensors based M/NEMS structures have been employed in several applications, such as medical and healthcare, food and agriculture safety, and environmental monitoring [13-17].
The quest for ultra-sensitive low-cost miniaturized gas sensors in the past few decades has sparked interest to seek alternative techniques other than the conventional gas sensors, which require large surface area and special coating materials for selective and sensitive detection. Functionalization is realized by coating the surface of the gas sensor with a thin layer of material that have affinity for particular gases, such as gold for mercury detection [18], polymer doped with carbon nanotube to detect Carbon dioxide [19], palladium for Hydrogen sensing [20], and metal-organic frameworks for humidity and volatile organic compounds [4, 21]. The performance of such devices depends on the functionalization type, thickness, and sensor design. Also, the miniaturization of The authors are with the Physical Sciences and Engineering Division, King Abdullah University of Science and Technology, Thuwal, 23955-6900, Saudi Arabia.
A. Z. Hajjaj is with the Wolfson School of Mechanical, Electrical and Manufacturing Engineering, Loughborough University, LE11 3TU, UK.
these devices is limited since it leads to the reduction of the coated surface area exposed to gas, which weakens the sensor performance and sensitivity.
MEMS gas sensors based on thermal conductivity measurements [22-26] have been known to be among the promising alternative candidates. These sensors rely on thermal energy dissipation (cooling or heating) of a heated structure due to the alteration of the surrounding gas concentration. This alleviates the requirement of large surface area and the complications due to the functionalization process. The temperature of the heated structure is altered from the surrounding gas properties; mainly its effective thermal conductivity. These sensors are fabricated from materials with high temperature coefficient of resistance (i.e., the resistance-change factor per degree Celsius of temperature resistance-change), which enables sensitive measurement of the bridge temperature by tracking its electrical resistance. The micro-hot-plates are the most developed and investigated MEMS structures used as thermal conductivity based gas sensor [24, 25, 27, 28]. In recent studies [22, 23], MEMS heated bridges have been employed to detect noble gases and demonstrated promising results for binary gas mixtures. These sensors show long lifetime and great stability compared to absorption-based gas sensors [23, 29, 30].
The thermal conductivity based gas sensors rely on the resistance variation of the heated structures due to gas exposure, which is typically less than few percents. Hence, there is a strong demand for a more sensitive probe to measure the gas concentration. Monitoring the frequency shifts of MEMS resonators due to gas concentration changes has been demonstrated as an ultra-sensitive detection technique of gases up to the molecule levels [4, 18, 20, 21, 31]. Moreover, several dynamical features, such as the bifurcation points, internal resonance, and secondary resonances have been utilized to improve the sensor sensitivity. In a previous work [8], we exploited the buckling point (bifurcation point) of heated silicon bridge to demonstrate sensitive and scalable pressure sensor. The concept is based on tracking the fundamental natural frequency of the electrothermally buckled bridge upon changing the surrounding air pressure. Raising the surrounding pressure increases the heat dissipation, which reduces the bridge temperature. The cooling effect of air changes the N. Jaber is with the School of Mechanical Engineering, Purdue University, West Lafayette, IN, 47906, USA.
ŧ N. Jaber and A. Z. Hajjaj contributed equally to this work
Corresponding author: M. I. Younis, e-mail:[email protected], ORCID: orcid.org/0000-0002-9491-1838
A Resonant Gas Sensor Based on Multimode
Excitation of a Buckled Microbeam
Amal Z. Hajjaj
ŧ, Nizar Jaber
ŧ, Nouha Alcheikh, and Mohammad I. Younis
concentration and potentially identifying the gas type in some applications using an electrothermally heated bridge microbeam operated near the buckling point. The method is based on the simultaneous recording of the frequencies of the first and second modes while changing the gas concentration and type. A finite element analysis based on multi-physics simulations is presented to validate the proposed technique on various toxic gases. A wide range of targeted gases is demonstrated since the presented method does not rely on surface functionalization.
II. EXPERIMENTAL SETUP
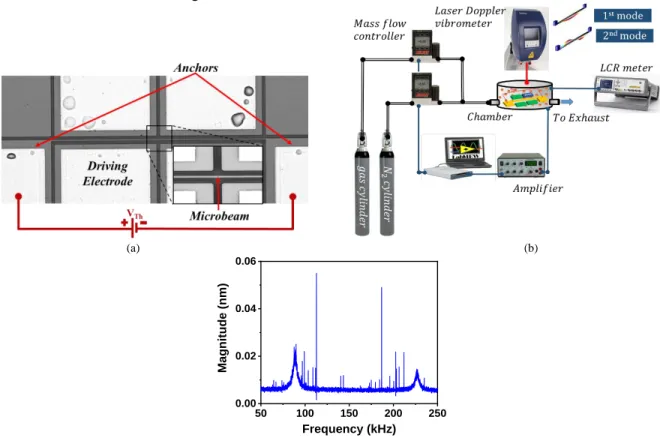
To demonstrate the concept, we utilize an in-plane clamped-clamped microbeam, Fig. 1a, fabricated from a highly conductive 30 μm Silicon device layer using the standard surface micromachining process. The process steps are lithography to transfer the device design from the mask to the wafer, metal sputtering to create the connection pads, deep reactive ion etch (DRIE) to form the structure, and vapor hydrofluoric acid dry etch (vpour-HF) to release the device. The tested microbeam is of length 500 μm, width (depth into the wafer) 30 μm, and thickness 2 μm. The microbeam is separated from a stationary electrode with a transduction gap of width 8 μm. Here, we use a half electrode configuration to break the
The experimental setup, shown in Fig. 1b, is used to expose the device to different types and levels of gas concentration and track the change in the resonance frequencies. The microbeam is placed in a test chamber, which is equipped with ports to provide the actuation signals. The device is tested under atmospheric pressure and room temperature. The gas setup is composed of two mass flow controllers, which control the flow of the targeted gas and the dry Nitrogen (N2). The ratio of the
two flow values determines the gas concentration inside the chamber. Note here that the sensor is placed inside the chamber away from the gas inlet where different gas concentrations are injected. Also, measurements are taken at steady-state conditions once the concentration inside the chamber reaches constant value.
We utilize the laser Doppler vibrometer to measure the resonance frequencies of the microbeam due to white noise signal. Fig. 1c shows an example of such measurements. Also, a separate voltage source, VTh, is utilized to induce a current
flowing through the microbeam, which heats it up by the Joule’s heating effect, and hence alters its stiffness and resonance frequencies. Using the LABVIEW software and the LCR meter, we record the real-time variation of the microbeam resistance as exposed to different gas concentrations.
(a) (b)
(c)
Fig. 1. (a) A top view image of the tested in-plane clamped-clamped microbeam. (b) A schematic of the experimental setup.(c) The white noise signal output measured by the laser vibrometer showing the first symmetric and antisymmetric resonances at VTh=0V.
III. FINITE ELEMENT SIMULATIONS
To emphasize the potential of the proposed technique in
detecting several harmful and toxic gases, we have conducted a multi-physics finite elements study using COMSOL Multiphysics.
50 100 150 200 250
0.00 0.02 0.04 0.06
Magnitud
e (nm)
To take into account the various physical domains, various solvers have been coupled including the Solid Mechanics, Electric Currents, and Heat Transfer interface domains. The model couples the Joules heating of doped polysilicon and convective heat transfer for the surrounding gas. The Heat Transfer Module captures the effects of heating and cooling in the simulated structures. It has the ability to compute conductance of heat through the solid, and couples it with conductive heat transfer within the fluid (the gas mixture). Hence, the heat will be transferred from the microbeams to the surrounding gases in the test chamber (simulated here as a cubic volume) and vice versa, which will lead to cooling/heating the microbeam surface. The anchors of the bridge resonator are assigned a fixed constraint boundary condition with ambient temperature at their bottom. The rest of the faces of the structure are set to a convective heat boundary condition, where the heat flux option is used for external natural convection with the gas mixture (the mixture of Nitrogen and the targeted gas) at ambient temperature and atmospheric pressure. The model takes into account the temperature dependence of the thermal properties of the gas mixture and the polysilicon microbeam. The effective thermal conductivity of the gas mixture (keff),
known to be a nonlinear function of different parameters (thermal conductivity, viscosity, molar mass of each gas), is calculated using the Wassiljewa formula, as shown in Eq. (1), and then implemented in the software [33, 34].
𝑘𝑒𝑓𝑓= ∑
𝑝𝑖𝑘𝑖
∑𝑛𝑗=1𝑝𝑗𝐴𝑖𝑗 𝑛
𝑖=1 (1)
where ki is the thermal conductivity of each gas component i,
pi (pj) is the concentration of component i (j), and Aij is a
function that depends on the molar mass and the viscosity of the mixed gases (i and j). In this work, we calculated Aij based on
the method of Mason and Saxena [35]. IV. PRINCIPLE OF OPERATION
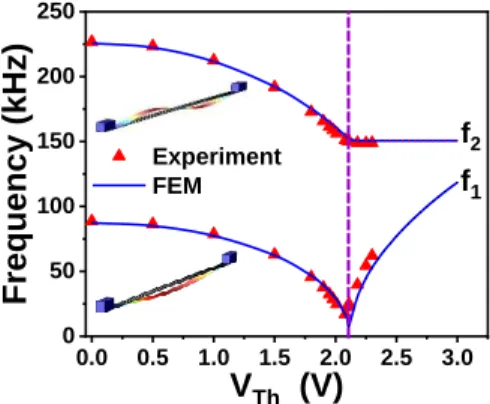
Fig. 2 shows the measured and simulated frequencies of the first, f1, and second, f2, mode of vibration at different
electrothermal voltages. As shown, increasing the electrothermal voltage, VTh, reduces the resonance frequency
values, which can be attributed to the decrease in the microbeam stiffness due to the induced compressive stress until the buckling point. After buckling, a sudden increase in the first mode (first symmetric mode) is observed due to the stretching mechanism, which increases the stiffness of the buckled microbeam. The second mode (first antisymmetric mode) frequency remains constant and is not affected with the stretching because of the pure bending nature of the second mode shape. A good agreement is shown among the experimental and FEM results. A detailed procedure is given in [36] for analytically solving the resonance frequency of the straight clamped-clamped beam under electrothermal voltage (using the exact solution developed by Nayfeh and co-authors [37, 38]). Note here that the straight beam resonator is used to take advantage of the buckling bifurcation (where the beam stiffness reaches almost zero) at which the beam is very sensitive to a small stiffness change compared to the sensitivity
of as-fabricated curved beams (known to have high stiffness due to curvature) to the small stiffness variation [8]. As already shown in [36], the presence of DC electrostatic voltage induces a static deflection that leads to decrease in the dip of the first resonance frequency. In this work, we used a very low DC electrostatic voltage in order to minimize the effect on the dip in the fundamental frequency around buckling, and hence get benefit of the high slope around the buckling point.
Fig. 2. Variation of the first two resonance frequencies of the bridge resonator with VTh obtained experimentally (scatters) and theoretically using
COMSOL (lines). The vertical line shows the operating point (buckling point) of the sensor. Note that at the buckling point (buckling bifurcation due to the stiffness variation of the resonator with the electrothermal voltage) the first mode frequency does not reach zero due to the electrostatic bias, which perturbs the symmetric bifurcation [36].The insets display the mode shapes of the two sensed modes generated by COMSOL.
Operating the resonator near the buckling point maximizes the sensitivity of the first mode frequency to axial stress, which can be altered due to cooling and heating effects [8]. Exposing the resonator to gases with higher/lower thermal conductivity compared with Nitrogen reduces/increases the axial stress inside the microbeam, which alters the values of the resonance frequencies. Hence, by tracking the shift in the first mode, we can quantify the concentration of the targeted gas, while by tracking the shift in the second mode, we can identify the type of gas if it has higher/lower thermal conductivity compared to Nitrogen. Although this does not lead to fully selective detection technique, it can be used for some applications of binary mixtures or those requiring identifying the presence of a specific gas of thermal conductivity much different than air. To demonstrate the concept, we expose the resonator to gases having higher thermal conductivity (Helium (He) and Methane (CH4)) and lower thermal conductivity (Carbon dioxide (CO2)
and Argon (Ar)) compared to Nitrogen, Table I. TABLE 1
THERMAL CONDUCTIVITY OF TESTED GASES Gas Type Thermal Conductivity (W/mK)
Helium (He) 0.151
Methane (CH4) 0.035
Nitrogen (N2) 0.026
Argon (Ar) 0.018
Carbon dioxide (CO2) 0.017
0.0 0.5 1.0 1.5 2.0 2.5 3.0
0 50 100 150 200 250
f2 f1
Frequency (
kHz)
V
Th(V)
Experiment FEM
Due to the experimental setup limitation, the real-time tracking of the resonance frequencies cannot be performed at this stage. A real-time measurement of the resistance variation is performed for different gas concentrations in order to check the repeatability and the time response to the gas exposure. As known for doped Silicon bridge resonator, the resistance variation with temperature is assumed to be linear (since the doping of the silicon wafer is assumed to be uniform), and hence the variation of the resistance at different gas concentrations can be correlated to the temperature variation of the microbeam [39, 40]. The resistance variation is correlated to the stress variation, and hence the resonance frequency variation. Tracking the resistance variation to different gas
to prove the reversibility and the repeatability of the proposed technique.
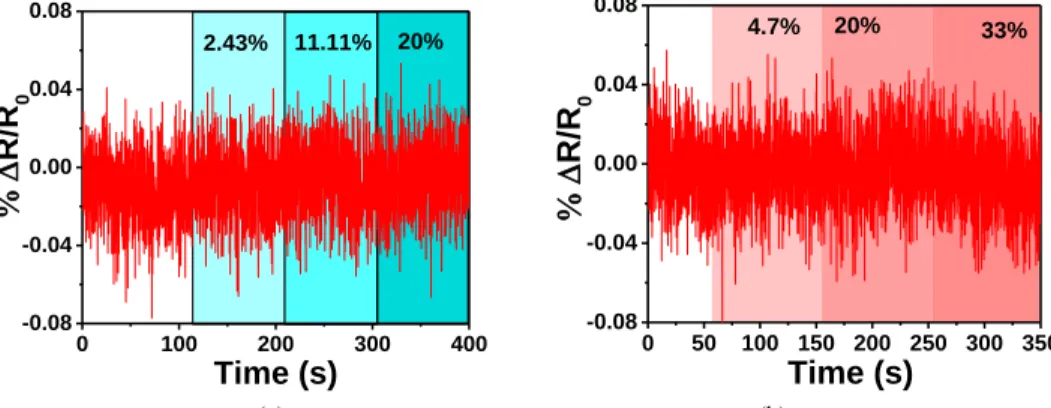
We start by flushing the chamber with Nitrogen at atmospheric pressure and ambient temperature. At almost zero electrothermal voltage (10mV), we measure the resistance variation of the microbeam at different concentrations of Methane and Carbon dioxide, which have higher and lower thermal conductivities, respectively, compared to Nitrogen. Fig. 3 shows that no resistance variation is reported as varying both gas concentrations. This indicates that there is no physical or chemical interaction between the microbeam and the gas molecules.
(a) (b)
Fig. 3. Normalized resistance variation with time for different concentration percentages of Nitrogen (N2) mixed with Methane (CH4) (a) and Carbon dioxide
(CO2) (b) for non-heated resonator for VTh=10mV. R0 denotes the mean resistance of the bridge resonator as flushing Nitrogen. The white zone denotes the Nitrogen
flushing of the test chamber.
Next, we tune the electrothermal voltage at the buckling point to maximize the proposed sensor sensitivity to any axial change due to the presence of different gases. Firstly, we expose the chamber with different concentrations of Methane, without exceeding 20% for safety reason, while recording the real-time variation of the resistance of the microbeam. Fig. 4a shows that as the concentration of Methane increases, the resistance of the
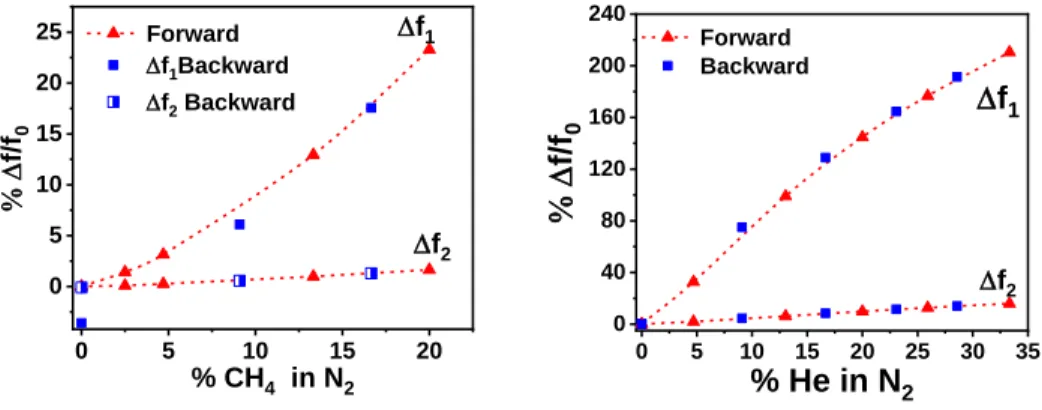
microbeam decreases due to the cooling of the microbeam. This proves that as the Methane concentration increases, the effective thermal conductivity of the medium surrounding the microbeam increases leading to more convection of the beam surface, which reduces the microbeam temperature. The reduction in the temperature reduces the compressive force, which increases the first and second resonance frequencies as shown in Fig. 4c.
(a) (b)
0 100 200 300 400
-0.08 -0.04 0.00 0.04 0.08
20% 11.11%
R/R
0
Time (s)
2.43%0 50 100 150 200 250 300 350
-0.08 -0.04 0.00 0.04 0.08
33% 20%
R/R
0
Time (s)
4.7%0 2000 4000 6000 8000 10000
-0.12 -0.09 -0.06 -0.03 0.00 0.03
20% 13.3% 9.09% 6.94% 4.7%
R/R
0
Time (s)
2.43%
0 1000 2000 3000 4000 5000
-0.6 -0.4 -0.2 0.0
4.7%
33% 20%
11.11%
R/R
0
(c) (d)
Fig. 4. (a) and (b) Normalized resistance variation with time for different percent of Nitrogen (N2) mixed with (a) Methane (CH4) and (b) Helium (He). The
white zones in (a) and (b) denote the Nitrogen flushing of the test chamber and R0 denotes the mean resistance of the bridge resonator as flushing Nitrogen. (c) and
(d) Normalized frequency shift with different percentages of Methane and Helium mixed with Nitrogen, respectively. Results in (c) and (d) are shown when increasing (forward) and decreasing (backward) the gas concentration. VTh is fixed for all results at buckling to maximize the sensor sensitivity.
Next, we expose the resonator to Helium that has higher thermal conductivity compared to Nitrogen. Fig. 4b shows a decrease in the resistance with the Helium concentration. Also, the normalized resistance variation is demonstrated to be higher than Methane. As shown in Fig. 4d, exposing the resonator to different concentrations of Helium increases the frequency values of the first and second modes due to the increase in the effective thermal conductivity that cools down the microbeam, and hence decreases the compressive axial stress. High sensitivity is shown even for the same concentration of Helium, reaching 200% compared to Methane, which reaches 25%. This could be explained by the higher thermal conductivity of Helium compared to Methane (4 times higher). As shown in Fig. 4a and 4b, the response returns to the original value upon flushing the chamber with Nitrogen, which confirms the
reversibility of the sensor.
On the other hand, exposing the resonator to Argon increases the resistance of the microbeam, as depicted in Fig. 5a. Increasing the Argon concentration decreases the effective thermal conductivity of the medium surrounding the microbeam; hence results in less heat convection from the microbeam. This increases the temperature and also the compressive stress in the microbeam. Increasing the Argon concentration raises the frequency of the first mode while the second mode remains constant, Fig. 5c. Similar results are shown for Carbon dioxide, Figs. 5b and 5d. The same percentage of the frequency variation of the first resonance frequency was shown for both Argon and Carbon dioxide, reaching 60%, since they have almost the same value of thermal conductivity.
(a) (b)
(c) (d)
0 5 10 15 20
0 5 10 15 20 25
f2
f/f
0
% CH4 in N2 Forward
f1Backward
f2 Backward
f1
0 5 10 15 20 25 30 35
0 40 80 120 160 200 240
f2
f/f
0
% He in N
2Forward Backward
f
10 1000 2000 3000 4000 5000
0.00 0.03 0.06 0.09 0.12 0.15
4.7% 33%
20%
R
R
0Time (s)
11.11%
0 4000 8000 12000 16000
-0.03 0.00 0.03 0.06 0.09 0.12 0.15
20%
33%
13.3%
6.97%9.09%
4.7%
R/R
0
Time (s)
2.43%0 5 10 15 20 25 30 35
0 20 40 60
f2
f/f
0
% Ar in N
2Forward
Backward f1
0 5 10 15 20 25 30 35
0 10 20 30 40 50 60
f2 f1
f/f
0
% CO2 in N2
Forward
f1 Backward
Normalized frequency shift with different percentages of Argon and Carbon dioxide mixed with Nitrogen, respectively. Results in (c) and (d) are shown when increasing (forward) and decreasing (backward) the gas concentration. VTh is fixed for all results at buckling to maximize the sensor sensitivity.
In contrast to resistance measurements, the frequency values show significant improvement in the sensor response for all tested gases, which shows two orders of magnitude improvement under the same gas concentration value. Note here that no hysteresis was shown experimentally as varying the gas concentration from low to high values (forward) and from high to low values (backward).
One should note that the operation speed of the proof of concept gas sensor is limited by several factors, mainly the time needed to reach a stable gas concentration inside the chamber and the thermal time constant of the MEMS sensor. It is worth to mention here that the frequency measurements (a continuous frequency measurements) at each gas concentration shown in Figs 4 and 5 were taken after being sure that the targeted concentration is reached at steady conditions inside the chamber (approximately after five minutes, which was an over-conservative estimation). This latter depends on the size of chamber, the gas flow rate, and the position of the sensor inside the test chamber. Note that the thermal time constant of the proposed MEMS sensor is around 176 µs [8]. For faster operation and real implementation, the sensor needs to be further miniaturized and its packaging needs to be well designed (in order to decrease the time needed to reach a stable gas concentration).
One should mention that the proposed sensor might be promising for multi gas mixture to replace or be combined with well-established gas sensing methods, such as chromatography [41], ion-mobility spectrometry [42], and mass spectrometry [43]. Combining the advantages of each technique could help in the development of more sensitive and selective multi gas sensor. However, at the presented configuration, the proposed sensor is able to demonstrate the type and the concentration of one injected gas in a known environment. If we have two different targeted and known gases with one has a higher thermal conductivity than air and the other one of lower thermal conductivity than air, then the presented sensor can distinguish between them (by tracking the second mode) and can identify the concentration (by tracking the first mode). In another scenario where both injected gases have both higher/lower thermal conductivities than air, the proposed sensors at the present configuration will fail to measure the concentration and distinguish the type of injected gases. Hence, in similar case the concentration of one the injected gas must be known. To overcome such limitation, the presented technique could be combined with another gas sensing method such as chromatograph (that helps to separate the gases before reaching
the sensor surface) or by using a network of sensors (adopting same technique but having different geometries). This needs to be accounted for in the future development of the proposed sensor.
Furthermore, the sensitivity of the proposed device to temperature variation from the environment is an imperative factor that needs to be accounted for. The proposed technique does not simultaneously compensate the environmental temperature variation as demonstrated in some proposed gas sensors in the literature [4]. Calibration experiments, for instance, can be conducted to overcome the variation of ambient temperature. Another factor to be considered is the low quality factor of the proposed gas sensor as operated at atmospheric pressure, which represents one major limitation of the frequency based gas sensors compared to the resistant based gas sensors [40]. Accordingly, these concerns need further investigation for the final implementation of the proposed gas sensor.
Note here that the current detection method using laser, as evident from Fig. 1c, does not suffer considerably from noise. In more practical scenarios, where resonances are detected electrically, parasitic and other sources of noise can have more impact on the resolution of measurements.
Detecting harmful gases, such as Hydrogen (H2), Propane
(C3H8), and Carbon monoxide (CO), etc., has been the focus of
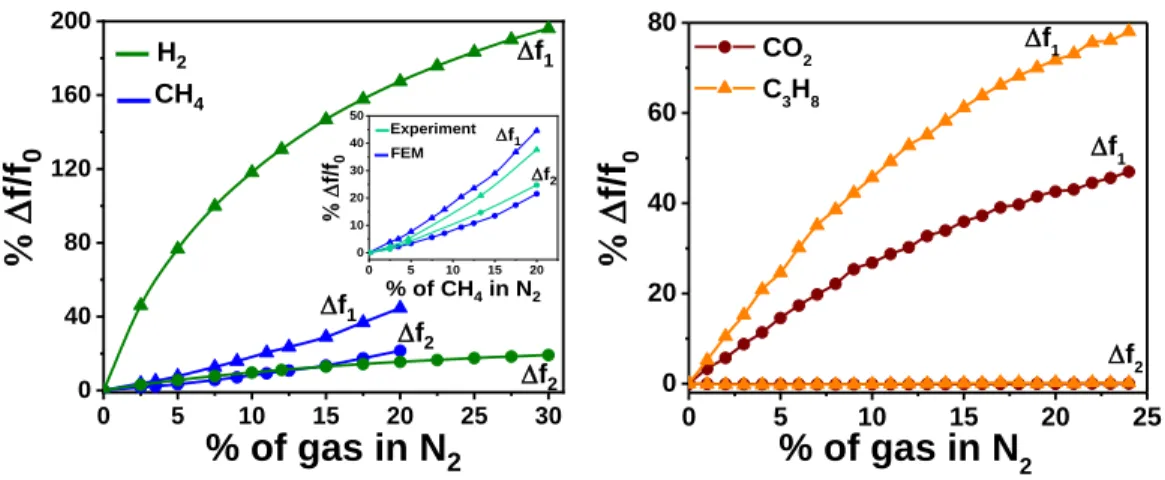
several studies in the past few decades [44-46]. Such gases cause serious environmental and health problems. To demonstrate the potential of the proposed technique in detecting such harmful gases, we simulated the resonance frequencies variation of the bridge microbeam under consideration, with different gas concentrations, Hydrogen, Methane, Propane, and Carbon dioxide, are shown in Fig. 6. The simulation results prove the same concept presented experimentally and demonstrate the applicability of the proposed concept in different harmful gases without the need for any specific functionalization for each gas. The inset of Fig. 6a shows a comparison between the experimental data and the simulated data for the Methane case. The small deviation among both simulated and experimental results could be explained by the approximate model since we are referring to the Wassiljewa formula [33, 34] to calculate the effective thermal conductivity of the gas mixture at each gas concentration. The proposed finite element model can be employed to optimize the sensor design to get higher frequency variation for lower gas concentration.
(a) (b)
Fig. 6. Simulated normalized frequency shifts of the first and second more of the resonator with different percentages of various gases mixed with Nitrogen (N2), using the software COMSOL Multiphysics. (a) Methane (CH4) and Hydrogen (H2). (b) Carbon dioxide (CO2) and Propane (C3H8). The inset of (a) shows a
comparison between the experimental data and the simulated results, using FEM, for the Methane case.
VI. CONCLUSIONS
We proposed a new sensitive sensor for measuring the gas concentration and potentially identifying the gas type using an electrothermally heated bridge operated near the buckling point. The concept is based on the simultaneous tracking of the resonance frequency of the first and second vibration modes at different gas concentration levels. The frequency values depend on the effective convective cooling/heating of the gas mixture surrounding the heated bridge MEMS resonators. By tracking the shift in the first mode, the concentration of the targeted gas is quantified. The shift in the second mode is employed to determine the type of gas for some applications (having higher/lower effective thermal conductivity compared to Nitrogen). The results demonstrate the possibility of realizing a gas sensor that can determine the type of gas without the need for selective coating. In contrast to resistance-based measurement, operating the bridge near the buckling point and monitoring the frequency shift maximize the sensor sensitivity. Under the same value of gas concentration, the results show up to 200% relative frequency change compared with few percent when tracking the resistance value. The obtained results motivate in-depth studies for the implementation of the proposed sensor in binary and multi gas mixtures. The significant advantage of the proposed scalable gas sensor is the simplicity of fabrication, operating principle, and sensing scheme. Also, the proposed sensor can target wide range of gases as the presented technique does not rely on surface functionalization. The device design can be further optimized to enhance the sensitivity and selectivity of the proposed sensor, which enables the detection of low concentration of different harmful gases.
ACKNOWLEDGMENT
We acknowledge the financial support from King Abdullah University of Science and Technology (KAUST).
REFERENCES
[1] K. Ekinci, X. Huang, and M. Roukes, “Ultrasensitive nanoelectromechanical mass detection,” Applied Physics Letters,
vol. 84, no. 22, pp. 4469-4471, 2004.
[2] Y.-T. Yang, C. Callegari, X. Feng et al., “Zeptogram-scale
nanomechanical mass sensing,” Nano letters, vol. 6, no. 4, pp. 583-586, 2006.
[3] B. Lassagne, D. Garcia-Sanchez, A. Aguasca et al., “Ultrasensitive mass sensing with a nanotube electromechanical resonator,” Nano letters, vol. 8, no. 11, pp. 3735-3738, 2008.
[4] N. Jaber, S. Ilyas, O. Shekhah et al., “Multimode excitation of a metal organics frameworks coated microbeam for smart gas sensing and actuation,” Sensors and Actuators A: Physical, vol. 283, pp. 254-262, 2018.
[5] I. Bargatin, E. Myers, J. Aldridge et al., “Large-scale integration of
nanoelectromechanical systems for gas sensing applications,” Nano letters, vol. 12, no. 3, pp. 1269-1274, 2012.
[6] S. B. Truax, K. S. Demirci, L. A. Beardslee et al., “Mass-sensitive detection of gas-phase volatile organics using disk microresonators,” Analytical chemistry, vol. 83, no. 9, pp. 3305-3311, 2011.
[7] X. Zhou, A. Wang, Y. Wang et al., “Crystal-Defect-Dependent Gas-Sensing Mechanism of the Single ZnO Nanowire Sensors,” ACS sensors, vol. 3, no. 11, pp. 2385-2393, 2018.
[8] A. Z. Hajjaj, N. Alcheikh, M. A. A. Hafiz et al., “A scalable pressure
sensor based on an electrothermally and electrostatically operated resonator,” Applied Physics Letters, vol. 111, no. 22, pp. 223503, 2017.
[9] C. Stampfer, T. Helbling, D. Obergfell et al., “Fabrication of
single-walled carbon-nanotube-based pressure sensors,” Nano letters, vol. 6, no. 2, pp. 233-237, 2006.
[10] R. J. Dolleman, D. Davidovikj, S. J. Cartamil-Bueno et al., “Graphene squeeze-film pressure sensors,” Nano letters, vol. 16, no. 1, pp. 568-571, 2015.
[11] P. Thiruvenkatanathan, J. Yan, and A. A. Seshia, "Ultrasensitive mode-localized micromechanical electrometer." pp. 91-96. [12] H. Zhang, J. Huang, W. Yuan et al., “A high-sensitivity
micromechanical electrometer based on mode localization of two degree-of-freedom weakly coupled resonators,” Journal of Microelectromechanical Systems, vol. 25, no. 5, pp. 937-946, 2016. [13] T. Fischer, A. Agarwal, and H. Hess, “A smart dust biosensor powered by kinesin motors,” Nature nanotechnology, vol. 4, no. 3, pp. 162, 2009.
[14] J. Kim, M. Kim, M.-S. Lee et al., “Wearable smart sensor systems
integrated on soft contact lenses for wireless ocular diagnostics,”
Nature communications, vol. 8, pp. 14997, 2017.
[15] C. Hagleitner, A. Hierlemann, D. Lange et al., “Smart single-chip gas sensor microsystem,” Nature, vol. 414, no. 6861, pp. 293, 2001. [16] S. Neethirajan, D. Jayas, and S. Sadistap, “Carbon dioxide (CO 2) sensors for the agri-food industry—a review,” Food and Bioprocess Technology, vol. 2, no. 2, pp. 115-121, 2009.
[17] H. Q. Nguyen, B. Q. Ta, N. Hoivik et al., "Carbon nanotube based gas sensor for expiration detection of perishable food." pp. 675-678.
0 5 10 15 20 25 30
0 40 80 120 160 200
0 5 10 15 20
0 10 20 30 40 50
f2
f1
f/f0
% of CH4 in N2 Experiment FEM
f2 f2
f1
f1
f/f
0
% of gas in N
2H2
CH4
0 5 10 15 20 25
0 20 40 60 80
CO2
C3H8
f1 f1
f/f
0
% of gas in N
2no. 13, pp. 1695-1697, 1995.
[19] Y.-T. Lai, J.-C. Kuo, and Y.-J. Yang, “A novel gas sensor using polymer-dispersed liquid crystal doped with carbon nanotubes,”
Sensors and Actuators A: Physical, vol. 215, pp. 83-88, 2014. [20] J. Henriksson, L. G. Villanueva, and J. Brugger, “Ultra-low power
hydrogen sensing based on a palladium-coated nanomechanical beam resonator,” Nanoscale, vol. 4, no. 16, pp. 5059-5064, 2012. [21] N. Jaber, S. Ilyas, O. Shekhah et al., “Multimode MEMS Resonator
for Simultaneous Sensing of Vapor Concentration and Temperature,” IEEE Sensors Journal, vol. 18, no. 24, pp. 10145-10153, 2018.
[22] D. Struk, A. Shirke, A. Mahdavifar et al., “Investigating time-resolved response of micro thermal conductivity sensor under various modes of operation,” Sensors and Actuators B: Chemical,
vol. 254, pp. 771-777, 2018.
[23] A. Mahdavifar, M. Navaei, P. J. Hesketh et al., “Transient thermal response of micro-thermal conductivity detector (µTCD) for the identification of gas mixtures: An ultra-fast and low power method,”
Microsystems & Nanoengineering, vol. 1, pp. 15025, 2015. [24] I. Elmi, S. Zampolli, E. Cozzani et al., “Development of
ultra-low-power consumption MOX sensors with ppb-level VOC detection capabilities for emerging applications,” Sensors and Actuators B: Chemical, vol. 135, no. 1, pp. 342-351, 2008.
[25] M. Decarli, L. Lorenzelli, V. Guarnieri et al., “Integration of a
technique for the deposition of nanostructured films with MEMS-based microfabrication technologies: application to micro gas sensors,” Microelectronic Engineering, vol. 86, no. 4-6, pp. 1247-1249, 2009.
[26] T. Kawano, H. C. Chiamori, M. Suter et al., “An electrothermal
carbon nanotube gas sensor,” Nano letters, vol. 7, no. 12, pp. 3686-3690, 2007.
[27] M. Zanini, J. Visser, L. Rimai et al., “Fabrication and properties of
a Si-based high-sensitivity microcalorimetric gas sensor,” Sensors and Actuators A: Physical, vol. 48, no. 3, pp. 187-192, 1995. [28] S. Semancik, R. E. Cavicchi, M. Wheeler et al., “Microhotplate
platforms for chemical sensor research,” Sensors and Actuators B: Chemical, vol. 77, no. 1-2, pp. 579-591, 2001.
[29] D. Puente, F. J. Gracia, and I. Ayerdi, “Thermal conductivity microsensor for determining the Methane Number of natural gas,”
Sensors and Actuators B: Chemical, vol. 110, no. 2, pp. 181-189, 2005.
[30] D. Cruz, J. Chang, S. Showalter et al., “Microfabricated thermal conductivity detector for the micro-ChemLab™,” Sensors and Actuators B: Chemical, vol. 121, no. 2, pp. 414-422, 2007. [31] Y. Hwang, H. Sohn, A. Phan et al., “Dielectrophoresis-assembled
zeolitic imidazolate framework nanoparticle-coupled resonators for highly sensitive and selective gas detection,” Nano letters, vol. 13, no. 11, pp. 5271-5276, 2013.
[32] N. Jaber, A. Ramini, A. A. Carreno et al., “Higher order modes
excitation of electrostatically actuated clamped–clamped microbeams: experimental and analytical investigation,” Journal of Micromechanics and Microengineering, vol. 26, no. 2, pp. 025008, 2016.
[33] S. Udina, M. Carmona, G. Carles et al., “A micromachined
thermoelectric sensor for natural gas analysis: Thermal model and experimental results,” Sensors and Actuators B: chemical, vol. 134, no. 2, pp. 551-558, 2008.
[34] S. Udina, M. Carmona, A. Pardo et al., “A micromachined
thermoelectric sensor for natural gas analysis: Multivariate calibration results,” Sensors and Actuators B: Chemical, vol. 166, pp. 338-348, 2012.
[35] B. E. Poling, J. M. Prausnitz, and J. P. O'connell, The properties of gases and liquids: Mcgraw-hill New York, 2001.
[36] A. Z. Hajjaj, N. Alcheikh, A. Ramini et al., “Highly tunable
electrothermally and electrostatically actuated resonators,” Journal of Microelectromechanical Systems, vol. 25, no. 3, pp. 440-449, 2016.
[37] A. H. Nayfeh, W. Kreider, and T. Anderson, “Investigation of natural frequencies and mode shapes of buckled beams,” AIAA journal, vol. 33, no. 6, pp. 1121-1126, 1995.
[38] A. H. Nayfeh, and P. F. Pai, Linear and nonlinear structural mechanics: John Wiley & Sons, 2008.
Systems, vol. 26, no. 4, pp. 837-845, 2017.
[40] A. Mahdavifar, R. Aguilar, Z. Peng et al., “Simulation and fabrication of an ultra-low power miniature microbridge thermal conductivity gas sensor,” Journal of The Electrochemical Society,
vol. 161, no. 4, pp. B55-B61, 2014.
[41] J. Bryant-Genevier, K. Scholten, S. K. Kim et al., “Multivariate curve resolution of co-eluting vapors from a gas chromatograph with microsensor array detector,” Sensors and Actuators B: Chemical, vol. 202, pp. 167-176, 2014.
[42] V. Gund, S. Ardanuc, Y. Shi et al., "Low-voltage (< 5V) ion-mobility spectrometer array for label-free gas detection." pp. 2767-2770.
[43] M. Geear, R. R. Syms, S. Wright et al., “Monolithic MEMS
quadrupole mass spectrometers by deep silicon etching,” Journal of Microelectromechanical Systems, vol. 14, no. 5, pp. 1156-1166, 2005.
[44] F. DiMeo Jr, S. Chen, P. Chen et al., “MEMS-based hydrogen gas sensors,” Sensors and Actuators B: Chemical, vol. 117, no. 1, pp. 10-16, 2006.
[45] A. Tischner, T. Maier, C. Stepper et al., “Ultrathin SnO2 gas sensors
fabricated by spray pyrolysis for the detection of humidity and carbon monoxide,” Sensors and Actuators B: Chemical, vol. 134, no. 2, pp. 796-802, 2008.
[46] S. E. Moon, N. J. Choi, H. K. Lee et al., “Semiconductor‐Type MEMS Gas Sensor for Real‐Time Environmental Monitoring Applications,” Etri Journal, vol. 35, no. 4, pp. 617-624, 2013.