AUSTRALIAN JOURNAL OF BASIC AND
Open Access Journal
Published BY AENSI Publication
© 2016 AENSI Publisher All rights reserved
This work is licensed under the Creative Commons Attribution http://creativecommons.org/licenses/by/4.0/
To Cite This Article: Dr. R. Kotteeswaran and Dr. L. Sivakumar Approach. Aust. J. Basic & Appl. Sci., 10(5):
Coal Gasifier Control
Approach
1Dr. R. Kotteeswaran and 2Dr. L. Sivakumar
1,2St.Joseph’s College of Engineering, Sri Krishna College of
Address For Correspondence:
Hussain S. Akbar, Kirkuk University/College of Science
A R T I C L E I N F O
Article history:
Received 12 January 2016 Accepted 22 February 2016 Available online 1 March 2016
Keywords:
ALSTOM benchmark challenge, Coal gasifier, Heuristic algorithm, Multi Input Multi Output Process, Particle Swarm Optimization, PID controller.
Integrated Gasification Combined Cycle (IGCC) is an
enhanced thermal efficiency from 33 to 45%. The main source of energy for IGCC plants is solid or liquid fuel. Generation of electricity occurs in two stages namely gasification and power generation. In gasification process, any carbonaceous material (solid or liquid) is converted into syngas (also called synthesis gas or producer gas) under definite pressure and temperature. Purified syngas runs the gas turbine to generate electricity and exhaust gas from the gas turbine enters Heat Reco
steam turbine to produce additional power.
Coal gasifier one of the essential unit of IGCC, converts coal into syngas under certain temperature and pressure. Figure 1 shows schematic of co
flow, coal flow, steam mass flow, limestone mass flow) and four outputs (syngas calorific value, bedmass, syngas pressure, syngas temperature) with a high degree of cross coupling
Sulphur in the coal and its flow rate must be set to a fixed ratio of coal flow, nominally 1:10 limestone to coal. Thus, the process becomes four-input, four
exhibits a complex dynamic behavior with mixed fast and slow dynamics and it is highly difficult to control.
AUSTRALIAN JOURNAL OF BASIC AND
APPLIED SCIENCES
ISSN:1991-8178 EISSN: 2309-8414 Journal home page: www.ajbasweb.com
© 2016 AENSI Publisher All rights reserved
This work is licensed under the Creative Commons Attribution International License (CC BY). http://creativecommons.org/licenses/by/4.0/
Dr. R. Kotteeswaran and Dr. L. Sivakumar., Coal Gasifier Control – A Heuristic Algorithm Based Optimization ): 161-167, 2016
Coal Gasifier Control – A Heuristic Algorithm Based Optimization
St.Joseph’s College of Engineering, Sri Krishna College of Engineering and Technology.
Hussain S. Akbar, Kirkuk University/College of Science-Physics Dept. Mobil :009647702383015, [email protected]
A B S T R A C T
Integrated Gasification Combined Cycle produces electricity with improved efficiency compared to conventional Thermal Powerplant. It uses syngas gas, also known as coal gas as the fuel which is derived from the coal. Coal gasifier, a subsystem in IGCC based power plant, is a highly nonlinear Multi Input Multi Output (MIMO) process that converts coal into syngas under certain boundary conditions (which include certain temperature and pressure). The performance should meet certain stringent input constraints at all operating points during the disturbances that arise at the input and output side of the gasifier. The present work deals with optimizing the performance of fluidised bed coal gasifier of 87 MW IGCC power plant so as to meet the stringent performance requirements during the disturbances emanating from calorific value of the coal and load side of the gasifier. The dynamic model of coal gasifier has been developed by ALSTOM Power Technology, UK demanding solutions from the academic community. Researchers used different methods and obt
different degrees. In this paper, the authors improve the performance of coal gasifier using Particle Swarm Optimization algorithm and examine the performance at all operating points. Meeting the performance requirements is the pri
controller design. The designed controller satisfies the performance requirements without violating the constraints.
INTRODUCTION
Gasification Combined Cycle (IGCC) is an effective method of generating
enhanced thermal efficiency from 33 to 45%. The main source of energy for IGCC plants is solid or liquid fuel. Generation of electricity occurs in two stages namely gasification and power generation. In gasification process, eous material (solid or liquid) is converted into syngas (also called synthesis gas or producer gas) pressure and temperature. Purified syngas runs the gas turbine to generate electricity and exhaust gas from the gas turbine enters Heat Recovery Steam Generator (HRSG) to produce steam which in turn runs the steam turbine to produce additional power.
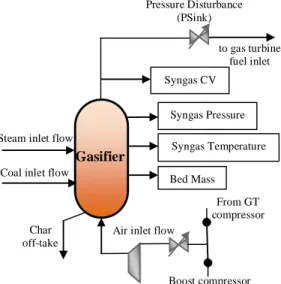
Coal gasifier one of the essential unit of IGCC, converts coal into syngas under certain temperature and pressure. Figure 1 shows schematic of coal gasifier. It has five manipulated inputs (char extraction flow, air mass flow, coal flow, steam mass flow, limestone mass flow) and four outputs (syngas calorific value, bedmass, syngas pressure, syngas temperature) with a high degree of cross coupling among them. Limestone is added to remove the Sulphur in the coal and its flow rate must be set to a fixed ratio of coal flow, nominally 1:10 limestone to coal.
input, four-output regulatory problem for the control design. Coa exhibits a complex dynamic behavior with mixed fast and slow dynamics and it is highly difficult to control.
A Heuristic Algorithm Based Optimization
A Heuristic Algorithm Based Optimization
produces electricity with improved efficiency compared to conventional Thermal Powerplant. It uses syngas gas, also known as coal gas as the fuel which is derived from the coal. Coal gasifier, a subsystem in IGCC based lti Input Multi Output (MIMO) process that converts coal into syngas under certain boundary conditions (which include certain temperature and pressure). The performance should meet certain stringent input-output he disturbances that arise at the input and output side of the gasifier. The present work deals with optimizing the performance of fluidised bed coal gasifier of 87 MW IGCC power plant so as to meet the stringent ances emanating from calorific value of the coal and load side of the gasifier. The dynamic model of coal gasifier has been developed by ALSTOM Power Technology, UK demanding solutions from the academic community. Researchers used different methods and obtained the performance to different degrees. In this paper, the authors improve the performance of coal gasifier using Particle Swarm Optimization algorithm and examine the performance at all operating points. Meeting the performance requirements is the prime concern of this controller design. The designed controller satisfies the performance requirements
generating clean power with enhanced thermal efficiency from 33 to 45%. The main source of energy for IGCC plants is solid or liquid fuel. Generation of electricity occurs in two stages namely gasification and power generation. In gasification process, eous material (solid or liquid) is converted into syngas (also called synthesis gas or producer gas) pressure and temperature. Purified syngas runs the gas turbine to generate electricity and exhaust very Steam Generator (HRSG) to produce steam which in turn runs the
Fig. 1: Schematic of coal gasifier
The statespace model of ALSTOM gasifier is given by X Ax(t) Bu(t)
Y Cx(t) Du(t) •
= +
= + (1)
Where,
x(t) = internal state matrix of gasifier (25 x 1) u(t) = input variable matrix (6 x 1)
A = system matrix (25 x 25) B = input matrix (25 x 6)
Y = output variables matrix (4 x 1) C = observable matrix (25 x 4) D = disturbance matrix (4 x 6)
The system matrix is of 25th order and analysis and control of such higher order system becomes difficult when stringent constraints on input and output variables are to be fulfilled.
Alstom Benchmark Challenge:
A linear model of coal gasifier was developed by ALSTOM Power Technology, UK. ALSTOM desired the academic community to design a suitable controller which will ensure the specified dynamic performance characteristics for the gasifier in closed loop operation when step and sinusoidal disturbances were introduced around three operating load points (0%, 50% and 100%). This requirement constitutes ALSTOM Benchmark Challenge I (Dixon, R., et al., 2000). The constraints on input and output variables to be adhered during closed loop disturbance studies are given in table 1 and 2 respectively. A nonlinear model of gasifier was released as benchmark challenge II in June 2002 (Dixon, R., 2002), included a statespace model written in Matlab/Simulink environment. The specified dynamic performance characteristics in challenge II are to be met for the following special tests.
• Gasifier dynamic performance during pressure disturbance (step and sinusoidal) at 0%, 50% and 100% operating points.T
• he dynamic performance during ramping up of the load from 50% to 100%
• Gasifier dynamic performance test for multiple disturbances, one from load side (throttle side) and the other from input side by way of step change in calorific value (CV) of the coal fed into the gasifier. A sinusoidal variation in throttle valve reflecting fluctuating load or change in grid frequency is represented as equivalent changes in syngas pressure at the throttle valve as0.2 (2 × 0.4 ). The step change in CV of fuel is to be taken as ±18% of the CV from the design value. Further this type of multiple disturbances is to be studied around three operating load points.
A. Input – output constraints:
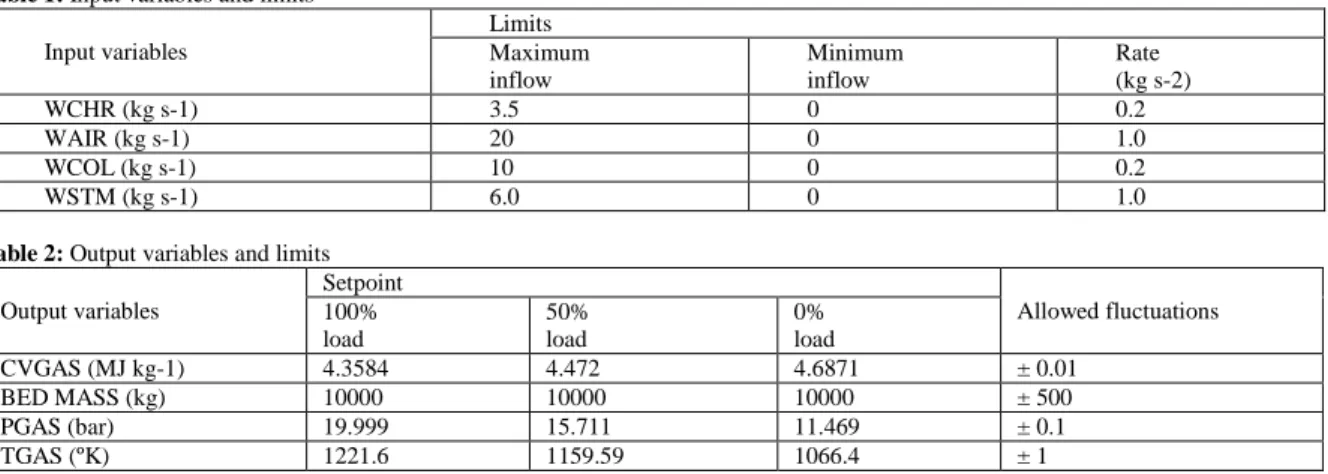
During the disturbance, the controllers manipulate different process input variable such as coal inlet flow (WCOL), steam inlet flow (WSTM), air inlet flow (WAIR) and char extraction flow (WCHR). These input variables and rate of change of these input variables should lie within specified limits. Table 1 shows the allowable limits of these input variables.
Air inlet flow
Pressure Disturbance (PSink)
to gas turbine fuel inlet
From GT compressor
Boost compressor atmospheric inlet Steam inlet flow
Coal inlet flow
Char off-take
Syngas Pressure
Syngas Temperature
Bed Mass Syngas CV
Table 1: Input variables and limits Input variables
Limits Maximum inflow
Minimum inflow
Rate (kg s-2)
WCHR (kg s-1) 3.5 0 0.2
WAIR (kg s-1) 20 0 1.0
WCOL (kg s-1) 10 0 0.2
WSTM (kg s-1) 6.0 0 1.0
Table 2: Output variables and limits Output variables
Setpoint
Allowed fluctuations 100%
load
50% load
0% load
CVGAS (MJ kg-1) 4.3584 4.472 4.6871 ± 0.01
BED MASS (kg) 10000 10000 10000 ± 500
PGAS (bar) 19.999 15.711 11.469 ± 0.1
TGAS (ºK) 1221.6 1159.59 1066.4 ± 1
Similarly the transient variations in the output variables syngas calorific value (CVGAS), bedmass (MASS), syngas pressure (PGAS) and syngas temperature (TGAS) should lie within specified limits around steady state value corresponding to different operating conditions. Table 2 shows the values of output variables and allowed fluctuations at steady state. During the performance test (pressure disturbance test, load change test and coal quality test), all the inputs and outputs should meet the performance requirements around all operating regions (0%, 50% and 100% load).
Since from its inception, numerous classical and advanced control strategies have been developed (Asmar, B.N., et al., 2000; Griffin, A., et al., 2000; Chin, C.S. and N. Munro, 2003; Dixon, R. and A.W. Pike, 2006; Seyab, R., K. Shakir and Y. Cao, 2006; Seyab, R.K.A., et al., 2006; Simm and G.P. Liu, 2006; Nobakhti and H. Wang, 2008; Agustriyanto, R. and J. Zhang, 2009; Xue, Y., D. Li, and F. Gao, 2010; Tan, W., G. Lou and L. Liang, 2011; Kotteeswaran, R., L. Sivakumar, 2012; Huang, D. Li, and Y. Xue, 2013) and (Kotteeswaran, R. and L. Sivakumar, 2013). Asmer et al (2000) proposed Baseline PI controller in which, three PI controllers and a feed forward plus feedback controller is used for regulating the outputs. The output variables CVGAS, PGAS and TGAS are controlled by manipulating the input variables WAIR, WSTM and WCHR respectively, while WCOL (feedback) and WCHR (feed forward) regulate Bedmass. On the other hand, the use of metaheuristic algorithms in process control has gained popularity among the academic community. These algorithms have also been used to tune the Baseline PI controller which yielded good results. Kotteeswaran and Sivakumar proposed Metaheuristic algorithms such as Bat Algorithm (BA) (Kotteeswaran, R. and L. Sivakumar, 2013) and (Kotteeswaran, R. and L. Sivakumar, 2013), Cuckoo Search (CS) algorithm (Sivakumar, L. and R. Kotteeswaran, 2014), Firefly Algorithm (FA) (Kotteeswaran, R. and L. Sivakumar, 2013) and (Kotteeswaran, R. and L. Sivakumar, 2014), Multi Objective Particle Swarm Optimization algorithm (Kotteeswaran, R. and L. Sivakumar, 2014) and (Kotteeswaran, R. and L. Sivakumar, 2014).
Particle Swarm Optimization algorithm based tuning of PI controller:
Heuristic algorithms (Kennedy, J., R.C. Eberhart, 1995) are often nature-inspired and they have gained more popularity among the researchers in recent past. These algorithms are flexible and versatile, and they are very efficient in solving nonlinear, large complicated design problems, with real-world applications such as business planning, data mining, bioinformatics, and industrial applications. Heuristic algorithms are particularly suitable when conventional algorithms do not provide an optimum solution, get stuck at local minima and also it takes very long time to compute. Heuristic algorithms are very diverse, including Particle Swarm Optimization, Firefly Algorithm (FA), Artificial Bee Colony (ABC), Ant Colony Optimization (ACO), Bat Algorithm (BA), Harmony Search (HS), Cuckoo Search (CS), Genetic Algorithm (GA) and many others.
Particle Swarm Optimization (PSO) algorithm is an evolutionary type global optimization method developed by Kennedy and Eberhart (Yang, X.-S., 2010). PSO is based on the motivation of social activities in flock of birds and school of fish. It is extensively used in various engineering optimization problems due to its high computational efficiency. Compared with other optimization techniques such as GA and ACO, PSO has superior search performance for many complex optimization problems with faster and more stable convergence rates (Latha, K., et al., 2013). In PSO algorithm, very few parameters are to be assigned compared to other nature inspired algorithms and the convergence of the algorithm seems to be best among all the Heuristic algorithms.
In addition, PSO has been widely used in process control applications with different structures. PSO algorithm can also be combined with other novel techniques to form new methodologies for solving complex systems.
B. PSO Algorithm:
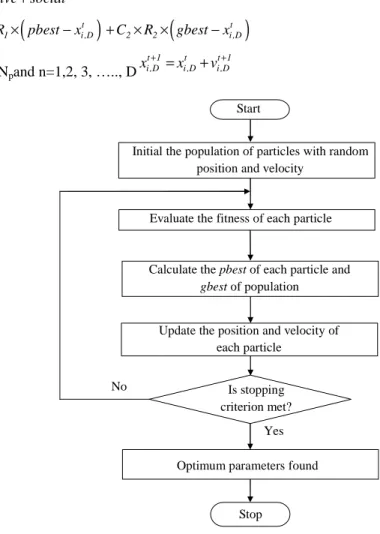
beginning of search, each bird (particle) in the swarm is distributed randomly throughout the D dimensional search space. With the supervision of the objective Function, each particle in the swarm dynamically adjust their velocity and position by its own flying experience and their companions flying experience. During each iteration, particles remember their best position attained so far (pbest), and also obtains the global best position information achieved by any particle in the population (gbest). Figure 2 shows the flowchart for PSO based optimization scheme.
At iteration t, each particle i has its position defined by t
i ,n i ,1 i ,2 i ,D
x =x , x ,,...x
and velocity defined as t
i ,n i ,1 i ,2 i ,D
v =v ,v ,,...v
in search space D. Velocity and position of each particle are updated in the next iteration as:
t 1 i ,D
x+ =Inertia cognitive social+ +
(2)
(
)
(
)
+ = × + × × − + × × −
t 1 t t t
i ,D i ,D 1 1 i ,D 2 2 i ,D
v W v C R pbest x C R gbest x
(3) where, i=1, 2, 3, …..,Npand n=1,2, 3, ….., D
+ = + +
t 1 t t 1
i ,D i ,D i ,D
x x v
(4)
Fig. 2: Flowchart of PSO algorithm
The inertia of weight Wrepresented in Equation (3), is an important factor for PSO’s convergence. It controls the impact of previous velocities on the current velocity. A large inertia weight factor facilitates global exploration while small weight factor facilitates local exploration. Therefore, it is better to choose large weight factor for initial iterations and gradually reduce weight factor in successive iterations. This can be done by using the following equation:
(
)
= max− max− min × max
W W W W Iter / Iter
(5) Where Wmax and Wminare initial and final weight respectively, Iter is current iteration number and Itermaxis the
maximum iteration number.
Acceleration constant C1is called cognitive parameter which pulls each particle towards local best position
and constant C2 is called social parameter which pulls the particle towards global best position. R1 and R2 are
known as random numbers in the range 0-1. The particle position is updated by Equation (4). The process is repeated until stopping criterion is met.
Yes No
Start
Initial the population of particles with random position and velocity
Evaluate the fitness of each particle
Calculate the pbest of each particle and gbest of population
Update the position and velocity of each particle
Is stopping criterion met?
Optimum parameters found
C. PSO based optimization scheme:
The proposed PSO based optimization scheme is shown in Fig. 3. The parameters of pressure loop PI controller are optimally tuned so as to obtain the desired performance of the gasifier. Hence, these parameters are assumed as decision variables and MAE for syngas pressure (PGAS) is taken as objective function. Further, while selecting the best optimal value for controller parameters performance constraints on other outputs such as CVGAS, Bedmass and TGAS are taken into consideration.
Fig. 3: Block diagram of PSO based optimization scheme
Decision variables =[Pr _ , _ ] (6)
Objective function ( ) = ( ) − ( )
!"# (7)
where, ysp(t) is the reference for PGAS and ym(t) is the measured PGAS.
The gasifier process is initialized with 0% load along with sinusoidal PSink. At each iteration, MAE for PGAS is calculated for all the particles. PSO algorithm finds each particle’s personal best (Pbest) MAE and
swarm’s best (gbest) MAE which is further used to find the decision variables for the next iteration. This process
continues till the stopping criterion is met. The parameters for PSO algorithm such as size of the swarm, bird step, W1C1 and C2 are taken as 20, 40, 0.35, 1.7 and 2.3 respectively. At the end of the search optimal controller
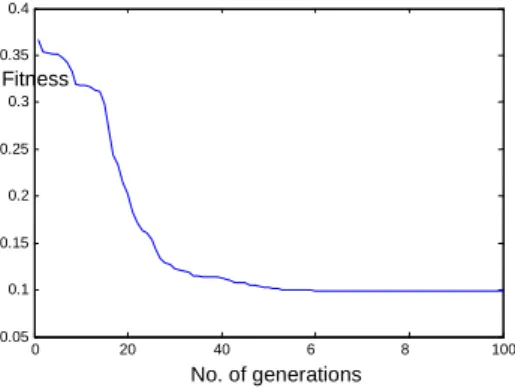
parameters are obtained which satisfies all the performance requirements. The convergence of PSO algorithm is shown in Fig. 4.
Fig. 4: Convergence of PSO algorithm
It is observed that the PSO algorithm for this application converges at 61st iteration at 0.0992 bar with the decision variables (PI controller constants) shown in Table 3.
Table 3: PSO based Pressure loop PI Controller Parameters
Sl. No Parameters Parameter values
1 Pr_Kp 3.365187e-04
2 Pr_Ki 1.202437e-07
These parameters are used in the PI controller for PGAS of Baseline PI controller and further analysis is carried out.
Performance tests:
The performance tests such as pressure disturbance, load change and coal quality tests are conducted to verify the designed controller. The requirement is that the response should meet the constraints (Table 1 and 2) at 0%, 50% and 100% operating points during the performance tests, good output tracking during load change test and wide coal quality variations during coal quality test.
D. Pressure Disturbance Test:
At 100% load, a step change in PSink disturbance is applied at 30 second to the gasifier and the dynamic +
+ Coal Gasifier Pressure loop
PI controller PSO Algorithm
y(t) r(t)
PSink disturbance
Gd
u(t) e(t)
Pr_Kp Pr_Ki
+ -
max
) (t
e
0 20 40 6 8 100
0.05 0.1 0.15 0.2 0.25 0.3 0.35 0.4
response is investigated. It is observed that all the outputs meet the performance requirements comfortably. Similarly the gasifier is initialized with 50% and 0% load conditions and the response is investigated. Figure 5 shows the response of the outputs (error) and inputs of the gasifier during step change in PSink for 0%, 50% and 100% load conditions. All the outputs meet the performance requirements comfortably at all operating conditions. The peak overshoots and undershoots are within the acceptable limits for all the test scenarios. During 100% operating region, coal flow rate saturates at 10 kg/s at around 150 second. This is not considered as performance violation since it is associated with control value dynamics.
a) Inputs and limits b) Outputs and limits
Fig. 5: Response to step PSink at 0%, 50% and 100% load
a) Inputs and limits b) Outputs and limits
Fig. 6: Response to sinusoidal PSink at 0%, 50% and 100% load
The above procedure is repeated for sinusoidal PSink disturbance at all load conditions. Figure 6 shows the error response of gasifier at 0%. 50% and 100% loads during sinusoidal PSink disturbance. All the outputs and inputs satisfy the performance requirements. The peak overshoots and undershoots of all the outputs lies within the acceptable limits. Performance indices such as MAE and IAE are calculated for 300 seconds during each scenario. Table 4 shows the comparison of MAE values during step and sinusoidal PSink disturbance. The process is well tuned for step change in PSink disturbance as compared to sinusoidal PSink change. All the output variables meet the transient performance requirements as mentioned in Table 1 and Table 2 around all operating regions.
E. Load change test:
The system is initialized at 50% load in steady state and ramped it to 100% over a period of 10 mimutes (5% per minute) and the response is monitored for 90 minutes. LOAD, CVGAS and PGAS track their demand rapidly to setpoint while Bedmass takes additional time to reach its steady state. The manipulated inputs variables coal flow and char flow have reached their steady state instantly.
0 100 200 300
0 1 2 3 C h a r (k g /s )
0 100 200 300
0 5 10 15 20 A ir ( k g /s )
0 100 200 300
0 2 4 6 8 10 Time (s) C o a l (k g /s )
0 100 200 300
0 2 4 6 S te a m ( k g /s ) Time (s) 100% Load 50% Load 0% Load
0 100 200 300
-0.01 -0.005 0 0.005 0.01 C V G A S ( M J /k g )
0 100 200 300
-0.5 0 0.5 M a s s ( to n n e s
) 100% Load
50% Load 0% Load
0 100 200 300
-0.1 -0.05 0 0.05 0.1 Time (s) P G A S ( b a r)
0 100 200 300
-1 -0.5 0 0.5 1 Time (s) T G A S ( K )
0 100 200 300
0 1 2 3 C h a r (k g /s )
0 100 200 300
0 5 10 15 20 A ir ( k g /s )
0 100 200 300
0 2 4 6 8 10 Time (s) C o a l (k g /s )
0 100 200 300
0 2 4 6 S te a m ( k g /s ) Time (s) 100% Load 50% Load 0% Load
0 100 200 300
-0.01 -0.005 0 0.005 0.01 C V G A S ( M J /k g )
0 100 200 300
-0.5 0 0.5 M a s s ( to n n e s
) 100% Load
50% Load 0% Load
0 100 200 300
-0.1 -0.05 0 0.05 0.1 Time (s) P G A S ( b a r)
0 100 200 300
Table 4: Summary of test output results
Output Maximum Absolute Error(MAE)
CS-PI FA-PI BA-PI Baseline PI PSO- PI
Step, 100% load CVGAS(KJ/kg) MASS(kg) PGAS(bar) TGAS(K) 6.0736 6.9382 0.0409 0.2787 5.3641 6.9382 0.0448 0.2535 5.7223 6.9382 0.0425 0.2660 4.8533 6.9382 0.0499 0.2395 5.8927 6.9382 0.0416 0.2720 Step, 50% load
CVGAS(KJ/kg) MASS(kg) PGAS(bar) TGAS(K) 6.7232 8.4548 0.0496 0.3187 5.8782 8.4548 0.0526 0.2863 6.2948 8.4548 0.0510 0.3024 5.031 8.4548 0.0577 0.2660 6.4965 8.4548 0.0503 0.3101 Step, 0% load
CVGAS(KJ/kg) MASS(kg) PGAS(bar) TGAS(K) 8.0184 11.053 0.0760 0.4034 6.6961 11.053 0.0759 0.3584 7.2488 11.053 0.0759 0.3818 5.8914 11.053 0.0772 0.3236 7.5896 11.0529 0.0760 0.3922 Sine, 100% load
CVGAS(KJ/kg) MASS(kg) PGAS(bar) TGAS(K) 3.7562 10.756 0.0291 0.3523 3.7022 10.676 0.0348 0.3442 3.7311 10.718 0.0318 0.3485 4.1024 10.858 0.0496 0.3784 3.7435 10.7365 0.0305 0.3503 Sine, 50% load
CVGAS(KJ/kg) MASS(kg) PGAS(bar) TGAS(K) 4.3039 12.719 0.0363 0.3912 4.2112 12.605 0.0430 0.3805 4.2572 12.664 0.0396 0.3862 4.7122 12.852 0.0623 0.4226 4.2770 12.6908 0.0380 0.3886 Sine, 0% load
CVGAS(KJ/kg) MASS(kg) PGAS(bar) TGAS(K) 6.8594 16.296 0.0991 0.5145 5.8054 16.177 0.09989 0.45036 6.1002 16.239 0.0998 0.4747 5.8585 16.346 0.1196 0.4791 6.3350 16.2672 0.0997 0.4909
F. Coal quality test:
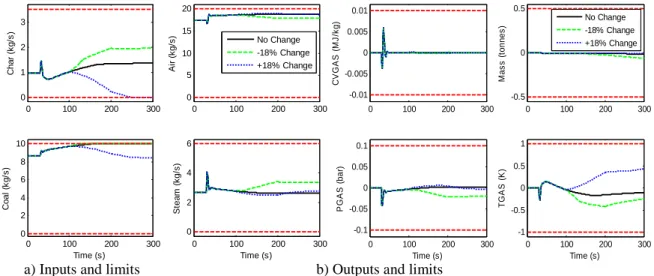
The investigation on the performance of the proposed controller during coupled disturbances, both from input and output sides of the gasifier constitute the ‘Benchmark challenge II’. In other words, disturbances in PSink (output side of gasifier) and change in calorific value of the coal (input side of gasifier) are to be simultaneously introduced to the plant model. Accordingly, six types of pressure disturbance tests are conducted along with change in calorific value of the fuel and deviation from the desired performance is investigated. The maximum allowable limits for coal quality variations are ± 18% with respect to the original calorific value of the coal.
a) Inputs and limits b) Outputs and limits
Fig. 7: Response at 100 % Load for step change in PSink coupled with change in coal quality
0 100 200 300
0 1 2 3 C h a r (k g /s )
0 100 200 300
0 5 10 15 20 A ir ( k g /s )
0 100 200 300
0 2 4 6 8 10 Time (s) C o a l (k g /s )
0 100 200 300
0 2 4 6 S te a m ( k g /s ) Time (s) No Change -18% Change +18% Change
0 100 200 300
-0.01 -0.005 0 0.005 0.01 C V G A S ( M J /k g )
0 100 200 300
-0.5 0 0.5 M a s s ( to n n e s )
0 100 200 300
-0.1 -0.05 0 0.05 0.1 Time (s) P G A S ( b a r)
0 100 200 300
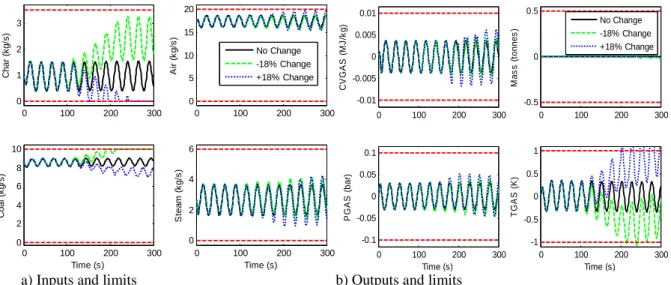
a) Inputs and limits b) Outputs and limits
Fig. 8: Response at 100 % load for sinusoidal change in PSink coupled with change in coal quality
a) Inputs and limits b) Outputs and limits
Fig. 9: Response at 50% Load for step change in PSink coupled with change in coal quality
a) Inputs and limits b) Outputs and limits
Fig. 10: Response at 50% load for sinusoidal change in PSink coupled with change in coal quality
0 100 200 300
0 1 2 3 C h a r (k g /s )
0 100 200 300
0 5 10 15 20 A ir ( k g /s )
0 100 200 300
0 2 4 6 8 10 Time (s) C o a l (k g /s )
0 100 200 300
0 2 4 6 S te a m ( k g /s ) Time (s) No Change -18% Change +18% Change
0 100 200 300
-0.01 -0.005 0 0.005 0.01 C V G A S ( M J /k g )
0 100 200 300
-0.5 0 0.5 M a s s ( to n n e s )
0 100 200 300
-0.1 -0.05 0 0.05 0.1 Time (s) P G A S ( b a r)
0 100 200 300
-1 -0.5 0 0.5 1 Time (s) T G A S ( K ) No Change -18% Change +18% Change
0 100 200 300
0 1 2 3 C h a r (k g /s )
0 100 200 300
0 5 10 15 20 A ir ( k g /s )
0 100 200 300
0 2 4 6 8 10 Time (s) C o a l (k g /s )
0 100 200 300
0 2 4 6 S te a m ( k g /s ) Time (s) No Change -18% Change +18% Change
0 100 200 300
-0.01 -0.005 0 0.005 0.01 C V G A S ( M J /k g )
0 100 200 300
-0.5 0 0.5 M a s s ( to nn e s )
0 100 200 300
-0.1 -0.05 0 0.05 0.1 Time (s) P G A S ( b a r)
0 100 200 300
-1 -0.5 0 0.5 1 Time (s) T G A S ( K ) No Change -18% Change +18% Change
0 100 200 300
0 1 2 3 C h a r (k g /s )
0 100 200 300
0 5 10 15 20 A ir ( k g /s )
0 100 200 300
0 2 4 6 8 10 Time (s) C o a l (k g /s )
0 100 200 300
0 2 4 6 S te a m ( k g /s ) Time (s) No Change -18% Change +18% Change
0 100 200 300
-0.01 -0.005 0 0.005 0.01 C V G A S ( M J /k g )
0 100 200 300
-0.5 0 0.5 M a s s ( to n n e s )
0 100 200 300
-0.1 -0.05 0 0.05 0.1 Time (s) P G A S ( b a r)
0 100 200 300
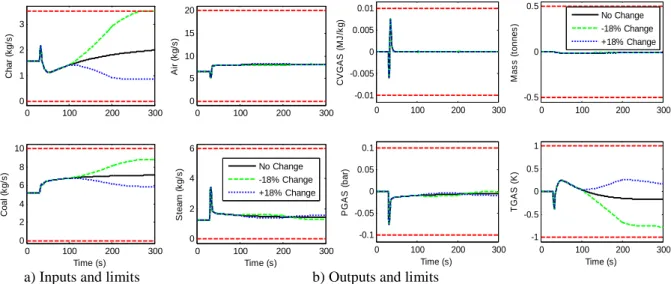
a) Inputs and limits b) Outputs and limits
Fig. 11: Response at 0% load for step change in PSink coupled with change in coal quality
a) Inputs and limits b) Outputs and limits
Fig. 12: Response at 0% Load for sinusoidal change in PSink coupled with change in coal quality
Figure 7 to 12 shows the dynamic performance of the gasifier during the above test at different scenarios. It is observed that, except two cases (i.e. during 0% and 100% load for sinusoidal pressure disturbance), all the output variables are well within the limits for maximum variation in coal quality (±18%).The violation variables (both inputs and outputs) under each scenario are also shown in Table 5 for better understanding of this test. TGAS violates the constraints at upper end and lower end during 100% load with sinusoidal change in PSink while PGAS violates at 0% load with sinusoidal change in PSink.
Table 5: Summary of allowed coal quality variation (%) and Violation variables under coal quality change (↑- variable reaches its upper limit, ↓ variable reaches its lower limit)
Load 100% 50% 0%
Disturbance Sine Step Sine Step Sine Step
Coal qualityIncrease (+18%) WCHR↓ TGAS↑
WCHR↓ WCHR↓ Within limits WSTM↓
PGAS↑
Within limits Coal quality decrease(-18%) WCOL↑
TGAS↓
WCOL↑ Within limits Coal ↑ PGAS↑
WSTM ↓
WCHR↑
Table 6: Comparison of allowed coal quality variation (%)
Load 100% 50% 0%
Disturbance Sine Step Sine Step Sine Step
Baseline PI (-14,11) (-18,18) (-18,16) (-18,18) (0,0) (-18,18)
Simm A (-13,8) (-5,14) (-14,14) (-12,18) (0,5) (-8,18)
FA-PI (-16,12) (-18,18) (-18,18) (-18,18) (0,3) (-18,18)
BA-PI (-15,12) (-18,18) (-18,17) (-18,18) (0,4) (-18,18)
CS-PI (-15,12) (-18,18) (-18,17) (-18,18) (0,6) (-18,18)
PSO-PI (-15,12) (-18,18) (-18,18) (-18,18) (0,6) (-18,18)
0 100 200 300
0 1 2 3 C h a r (k g /s )
0 100 200 300
0 5 10 15 20 A ir ( k g /s )
0 100 200 300
0 2 4 6 8 10 Time (s) C o a l (k g /s )
0 100 200 300
0 2 4 6 S te a m ( k g /s ) Time (s) No Change -18% Change +18% Change
0 100 200 300
-0.01 -0.005 0 0.005 0.01 C V G A S ( M J /k g )
0 100 200 300
-0.5 0 0.5 M a s s ( to n n e s )
0 100 200 300
-0.1 -0.05 0 0.05 0.1 Time (s) P G A S ( b a r)
0 100 200 300
-1 -0.5 0 0.5 1 Time (s) T G A S ( K ) No Change -18% Change +18% Change
0 100 200 300
0 1 2 3 C h a r (k g /s )
0 100 200 300
0 5 10 15 20 A ir ( k g /s )
0 100 200 300
0 2 4 6 8 10 Time (s) C o a l (k g /s )
0 100 200 300
0 2 4 6 S te a m ( k g /s ) Time (s) No Change -18% Change +18% Change
0 100 200 300
-0.01 -0.005 0 0.005 0.01 C V G A S ( M J /k g )
0 100 200 300
-0.5 0 0.5 M a s s ( to n n e s )
0 100 200 300
-0.1 -0.05 0 0.05 0.1 Time (s) P G A S ( b a r)
0 100 200 300
Table 6 shows the quantitative analysis at different scenarios. PSO based PI controller satisfies the constraints during 8 test cases, which is considered as the best performance reported in recent literature. The gasifier performs well over a wide range of coal qualityvariations.
Conclusion:
PSO algorithm has been successfully applied to optimally tune the parameters of pressure loop PI controller. Control of gasifier at 0% load during sinusoidal pressure disturbance is considered as most difficult test case. The controller parameters (Pr_Kp and Pr_Ki) are taken as decision variables while minimization of MAE of PGAS at 0% load is taken as objective function. Optimum controller settings are obtained at the end of the search process. The controller parameters are evaluated by examining the Performance tests. Pressure disturbance test shows excellent results and meets the performance requirement satisfactorily even at 0% load. Load change test and coal quality tests also provide good results. The gasifier performs well over a wide range of coal quality variations in 4 out of 6 test scenarios.
REFERENCES
Agustriyanto, R. and J. Zhang, 2009. “Control structure selection for the ALSTOM gasifier benchmark process using GRDG analysis,” Int. J. Model. Identif. Control., 6(2): 126-135.
Asmar, B.N., W.E. Jones and J.A. Wilson, 2000. “A process engineering approach to the ALSTOM gasifier problem,” Proc. Inst. Mech. Eng. Part I J. Syst. Control Eng., 214(6): 441-452.
Chin, C.S. and N. Munro, 2003.“Control of the ALSTOM gasifier benchmark problem using H2 methodology,” J. Process Control, 13(8): 759-768.
Dixon, R. and A.W. Pike, 2006. “Alstom Benchmark Challenge II on Gasifier Control,” IEE Proc. - Control Theory Appl., 153(3): 254-261.
Dixon, R., 2002. ALSTOM Benchmark Challenge II: Control of a Non-linear Gasifier Process, Published by ALSTOM Power Technology Centre, Leicester LE8 6LH, UK.
Dixon, R., A.W. Pike and M.S. Donne, 2000. “The ALSTOM benchmark challenge on gasifier control,” Proc. Inst. Mech. Eng. Part I J. Syst. Control Eng., 214(6): 389-394.
Griffin, A., P. Schroder, A.J. Chipperfield and P.J. Fleming, 2000. “Multi-objective optimization approach to the ALSTOM gasifier problem,” Proc. Inst. Mech. Eng. Part I J. Syst. Control Eng., 214(6): 453-469.
Huang, D. Li, and Y. Xue, 2013. “Active disturbance rejection control for the ALSTOM gasifier benchmark problem,” Control Eng. Pract., 21(4): 556-564.
Kennedy, J., R.C. Eberhart, 1995. Particle swarm optimization, In Proceedings of IEEE – International Conference on Neural Networks, pp: 1942-1948.
Kotteeswaran, R. and L. Sivakumar, 2013. “A novel bat algorithm based re-tuning of PI controller of coal gasifier for optimum response,” in Lecture Notes in Computer Science (including subseries Lecture Notes in Artificial Intelligence and Lecture Notes in Bioinformatics), 8284 LNAI, pp: 506-517.
Kotteeswaran, R. and L. Sivakumar, 2013. “Optimal Partial-Retuning of Decentralised PI Controller of Coal Gasifier Using Bat Algorithm,” Swarm, Evol. Memetic, pp: 750-761.
Kotteeswaran, R. and L. Sivakumar, 2013. “Partial-retuning of decentralised PI controller of nonlinear multivariable process using firefly algorithm,” in 2013 International Conference on Human Computer Interactions (ICHCI), pp: 1-7.
Kotteeswaran, R. and L. Sivakumar, 2013.“Normalized normal constraint algorithm based multi-objective optimal tuning of decentralised PI controller of nonlinear multivariable process - Coal gasifier,” in Lecture Notes in Computer Science (including subseries Lecture Notes in Artificial Intelligence and Lecture Notes in Bioinformatics), 8297 LNCS, 1: 333-344.
Kotteeswaran, R. and L. Sivakumar, 2014. “Levy guided Firefly algorithm based tuning of decentralised PI controller of nonlinear multivariable system - Coal gasifier,” IFAC Proc., 3(1): 127-134.
Kotteeswaran, R. and L. Sivakumar, 2014. “Optimal tuning of decentralized PI controller of nonlinear multivariable process using archival based Multiobjective particle swarm optimization,” Model. Simul. Eng., 2014.
Kotteeswaran, R. and L. Sivakumar, 2014. “Performance evaluation of optimal PI controller for ALSTOM gasifier during coal quality variations,” J. Process Control., 24(1): 27-36.
Kotteeswaran, R., L. Sivakumar, 2012. Lower Order Transfer Function Identification of Nonlinear MIMO System-ALSTOM Gasifier, International Journal of Engineering Research and Applications, 2(4): 1220-1226.
Latha, K., V. Rajinikanth, and P.M. Surekha, 2013. PSO-Based PID Controller Design for aClass of Stable and Unstable Systems, ISRNArtificial Intelligence.
Seyab, R., K. Shakir and Y. Cao, 2006. “Nonlinear model predictive control for the ALSTOM gasifier.,” J. Process Control., 21(4): 519-528.
Seyab, R.K.A., Y. Cao and S.H. Yang, 2006. “Predictive control for the ALSTOM gasifier problem.,” IEE Proc. - Control Theory Appl., 153(3): 293-301.
Simm and G.P. Liu, 2006. “Improving the performance of the ALSTOM baseline controller using multiobjective optimisation,” IEE Proc. - Control Theory Appl., 153(3): 286-292.
Sivakumar, L. and R. Kotteeswaran, 2014. “Soft Computing Based Partial-Retuning of Decentralised PI Controller of Nonlinear Multivariable Process,” in ICT and Critical Infrastructure: Proceedings of the 48th Annual Convention of Computer Society of India- Vol I, vol. 248 VOLUME, S. C. Satapathy, P. S. Avadhani, S. K. Udgata, and S. Lakshminarayana.
Tan, W., G. Lou and L. Liang, 2011. “Partially decentralized control for ALSTOM gasifier.,” ISA Trans., 50(3): 397-408.
Xue, Y., D. Li, and F. Gao, 2010.“Multi-objective optimization and selection for the PI control of ALSTOM gasifier problem,” Control Eng. Pract., 18(1): 67-76.