RESEARCH ARTICLE
Maximizing gain in high-throughput
screening using conformal prediction
Fredrik Svensson
1,2*, Avid M. Afzal
1, Ulf Norinder
3,4and Andreas Bender
1Abstract
Iterative screening has emerged as a promising approach to increase the efficiency of screening campaigns com-pared to traditional high throughput approaches. By learning from a subset of the compound library, inferences on what compounds to screen next can be made by predictive models, resulting in more efficient screening. One way to evaluate screening is to consider the cost of screening compared to the gain associated with finding an active com-pound. In this work, we introduce a conformal predictor coupled with a gain-cost function with the aim to maximise gain in iterative screening. Using this setup we were able to show that by evaluating the predictions on the training data, very accurate predictions on what settings will produce the highest gain on the test data can be made. We evaluate the approach on 12 bioactivity datasets from PubChem training the models using 20% of the data. Depend-ing on the settDepend-ings of the gain-cost function, the settDepend-ings generatDepend-ing the maximum gain were accurately identified in 8–10 out of the 12 datasets. Broadly, our approach can predict what strategy generates the highest gain based on the results of the cost-gain evaluation: to screen the compounds predicted to be active, to screen all the remaining data, or not to screen any additional compounds. When the algorithm indicates that the predicted active compounds should be screened, our approach also indicates what confidence level to apply in order to maximize gain. Hence, our approach facilitates decision-making and allocation of the resources where they deliver the most value by indicating in advance the likely outcome of a screening campaign.
Keywords: Conformal prediction, HTS, Gain-cost function, PubChem datasets
© The Author(s) 2018. This article is distributed under the terms of the Creative Commons Attribution 4.0 International License (http://creativecommons.org/licenses/by/4.0/), which permits unrestricted use, distribution, and reproduction in any medium, provided you give appropriate credit to the original author(s) and the source, provide a link to the Creative Commons license, and indicate if changes were made. The Creative Commons Public Domain Dedication waiver (http://creativecommons.org/ publicdomain/zero/1.0/) applies to the data made available in this article, unless otherwise stated.
Background
High throughput screening (HTS) has long been a para-digm in early-stage drug discovery [1]. With the advance-ments in screening technology and automation, it has become feasible to screen libraries in an iterative fashion, screening a small part of the library and using the result to make inferences about what compounds to screen next [2–5]. This allows for a smaller part of the library to be screened while still identifying a large portion of the active compounds. This is a setup that is well suited for machine learning approaches as the first part of the library that is screened can be used to train the learning algorithms.
To evaluate such a machine learning system, we need some way to quantify its performance. Evaluation of vir-tual screening methods has been the objective of many studies, but tend to focus on how well techniques per-form on average across different datasets, often in the form of dedicated benchmark datasets [6, 7]. These evaluations are generally based on how well active com-pounds are enriched in a certain fraction of the data-set, sometimes with the additional consideration that hits should appear as early as possible in the hit list [8]. However, in an iterative screening scenario, when data from the first screening iteration is available, there are a number of practical considerations of a somewhat differ-ent nature, such as how large a portion of the database should be screened in the next iteration, that are not answered directly by the enrichment and related met-rics. Consider for example a very small selection of the library yielding a very high enrichment but few identified actives compared to a larger selection of the compound
Open Access
*Correspondence: [email protected]
1 Department of Chemistry, Centre for Molecular Informatics, University
library yielding a lower enrichment but more different chemotypes.
One way to evaluate what number of compounds to screen is to consider the problem in terms of gain and cost, similar to many problems in other fields [9–11]. The evaluation of a compound is associated with a certain cost while the identification of an active compound rep-resents a gain. It is desirable to find a way to select com-pounds for evaluation in a way that maximizes the overall gain after deducting the cost of screening. This can eas-ily be expressed in a simple function that can be used to evaluate the outcome of any screening set. The main challenge with such an approach is the assignment of the gain component of the gain-cost function. Whereas cost is typically readily assessed, the gain of finding a hit rep-resents a more abstract value. Many different approaches could potentially be factored into the assignment of the gain, for example, one could consider how many com-pounds it would be acceptable to screen to identify one hit and assign the gain accordingly, or as used in this study, assign the gain to a magnitude that would make a full HTS screen approximately breakeven.
A prerequisite for the gain-cost evaluation to be pro-spectively meaningful as a tool for evaluating differ-ent predictors, is that the results on the training data also extend to new data. Conformal prediction is a frame-work for generating confidence predictors that produce predictions with a fixed error rate [12]. This is achieved through evaluating new predictions by comparing them to the predictions of known instances in a calibration set. For binary classification, labels are then assigned to the new instance in a way that can result in four differ-ent outcomes: the instance belongs to either of the two labels, both labels simultaneously or none of the labels. Two factors make conformal predictors highly suit-able for bioactivity prediction: their ability to accurately predict minority classes [13–15], since in a screen there tends to be many inactive compounds for each active, and the ability to control the error rate and thereby limit-ing the number of false positives. Conformal predictors have previously been successfully applied for bioactivity modelling [3, 16, 17].
As the efficiency (number of single label predictions) generated by the conformal predictor will vary depending on the confidence level applied, evaluating different con-fidence levels will identify if it is better to screen a small set of compounds with higher confidence or a larger set but with more uncertainty. This approach also does not require the user to decide on an exact number of com-pounds to screen in the next iteration, but instead, this will be provided by the predictor based on the selected confidence. For the conformal prediction framework to guarantee the error rate, the data considered needs to be
exchangeable [12]. In an iterative screening setup, this has implications on how to select the compounds for the initial round of screening, and the only way to guarantee exchangeability (as long as the sample is large enough) would be to draw a random sample of the available data.
We have previously reported a preliminary study on the use of a combination of a gain-cost function and confor-mal predictors in the context of iterative screening [18]. In this work, we expand this to more datasets and pro-vide a more in depth analysis. By training conformal pre-dictors on an initial training set consisting of 20% of each dataset, we show that the parameters that optimise gain in the remaining screening set can be identified. Over-all, this study shows that this conformal gain-cost driven method is a promising approach to optimize compound selection in screening programs in terms of optimising the gain.
Methods
Data
Large screening datasets were selected from PubChem [19] to represent a spread in terms of size and ratio of active to inactive compounds. 12 selected datasets (Table 1) were downloaded from PubChem and pre-pared using the IMI eTOX project standardizer [20] in order to generate consistent compound representations. The structures were then further subjected to tautomer standardization using the MolVS standardizer [21]. Activity was assigned according to the PubChem anno-tation, and compounds with ambiguous activity were discarded.
Feature generation
We have previously applied a set of 97 physicochemical/ structural feature descriptors in previous studies with good results [3, 15]. These 97 descriptors (physicochemi-cal), as well as full-length Morgan fingerprint descrip-tors (fingerprints), were calculated using RDKit [22]. The latter were subsequently hashed onto a binary feature vector of length 4096 by modulo calculations on the gen-erated fingerprint indices using an in-house Perl script.
Machine learning and conformal prediction
building every model. The data-split and validation strat-egy is shown schematically in Fig. 1.
All models were developed using scikit-learn [23], using default parameters unless otherwise indicated, and inductive conformal predictors were derived utilising the nonconformist package [24]. For all models random for-est ensembles consisting of 500 trees were used as the underlying models. We applied the aggregated confor-mal predictor procedure using 100 iterations [25]. For internal validation, each one of these iterations randomly leaves out 20% of the compounds and the generated model is used to predict the left out compounds. The median of the predicted conformal prediction p-values for each class (active or inactive) across all iterations is then used to derive the predicted labels.
Using the percentage of trees in the random forest ensemble predicting each of the classes (class probability)
as the conformal prediction conformity (similarity) meas-ure the method assigns classes to new compounds by comparing the class probability against the correspond-ing sorted list for the calibration set, see Fig. 2.
The predicted class probabilities for classes 1 and 2, e.g. active and inactive class, of the new compound is placed in the sorted list of the calibration set probabili-ties for classes 1 and 2, respectively, and thus adding one compound to the list for each class. For each class, the position of the new compound in these sorted lists is determined and the fraction with lower probabilities is calculated. This fraction is, for each class, compared to the corresponding significance level set by the user. For a new compound to be part of a class the computed frac-tion must be larger or equal to the set significance level.
This procedure is illustrated for the four possible out-comes from a binary classification task in Fig. 2. New compound 1 has predicted class probabilities for class 1 and 2 of 0.75 and 0.25, respectively. Placing these prob-abilities in the corresponding sorted calibration set list of probabilities results in positions 9 and 1, respectively, and the corresponding calculated fractions are 0.80 and 0.0. The set significance level in this example is 0.20. This means that new compound 1 can be assigned to class 1 (0.80 ≥ 0.20) but not to class 2 (0.0 < 0.20). Similarly, new
compound 2 can only be assigned to class 2. However, for new compound 3 and 4 the situation is different. For new compound 3 the calculated fractions for both classes are above or equal to the set significance level and, con-sequently, this compound is assigned to both class 1 and 2 (the “both” class). For new compound 4 the situation is the opposite and both calculated fractions are below the set significance level. Thus, new compound 4 cannot be assigned to any of the two classes by the model (the “empty” class). For new compound 4 it should be noted,
Table 1 The datasets employed in this study
AID Description Active Inactive % Active
411 qHTS Assay for Inhibitors of Firefly Luciferase 1577 70,097 2.2
868 Screen for Chemicals that Inhibit the RAM Network 3545 191,037 1.8
1030 qHTS Assay for Inhibitors of Aldehyde Dehydrogenase 1 (ALDH1A1) 16,117 148,322 7.8
1460 qHTS for Inhibitors of Tau Fibril Formation, Thioflavin T Binding 5825 221,867 2.6
1721 qHTS Assay for Inhibitors of Leishmania Mexicana Pyruvate Kinase (LmPK) 1089 290,104 0.4 2314 Cycloheximide Counterscreen for Small Molecule Inhibitors of Shiga Toxin 37,055 259,401 12.5
2326 qHTS Assay for Inhibitors of Influenza NS1 Protein Function 1073 260,701 0.4
2451 qHTS Assay for Inhibitors of Fructose-1,6-bisphosphate Aldolase from Giardia Lamblia 2061 276,158 0.7
2551 qHTS for inhibitors of ROR gamma transcriptional activity 16,824 256,777 6.1
485290 qHTS Assay for Inhibitors of Tyrosyl-DNA Phosphodiesterase (TDP1) 986 345,663 0.3
485314 qHTS Assay for Inhibitors of DNA Polymerase Beta 4522 315,791 1.4
504444 Nrf2 qHTS screen for inhibitors 7472 285,618 2.5
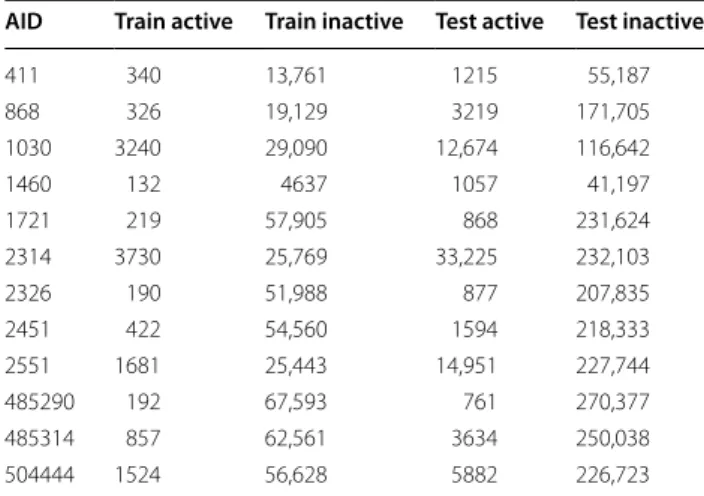
Table 2 Number of compounds in training and test data for all the datasets after data processing
AID Train active Train inactive Test active Test inactive
411 340 13,761 1215 55,187
868 326 19,129 3219 171,705
1030 3240 29,090 12,674 116,642
1460 132 4637 1057 41,197
1721 219 57,905 868 231,624
2314 3730 25,769 33,225 232,103
2326 190 51,988 877 207,835
2451 422 54,560 1594 218,333
2551 1681 25,443 14,951 227,744
485290 192 67,593 761 270,377
485314 857 62,561 3634 250,038
for clarity, that 4 decision trees did not give a class assign-ment, e.g. the resulting leaf node was unable to provide a majority class vote.
For a more in-depth explanation of the implementation of conformal prediction, we refer the reader to a recent study by Norinder et al. [26].
Gain‑cost function
As previously described [18], we defined a gain-cost function to evaluate the results from the screening
We applied three different screening cost levels (arbi-trary units), high (14), medium (10), and low (6). The dif-ferent cost levels can be thought of as representations of different assay setups, where for example a more complex phenotypic assay is more costly per compound screened compared to a biochemical assay on isolated protein
(1)
gain=
|train|
i=1
hit gain−
|train|
i=1
screen cost
+
|test|
i=1
hit gain−
|test|
i=1
screen cost.
[27, 28]. We then decided on a gain of 400 per identified hit. These values were applied in our previous study on gain-cost [18], and represent a gain-cost balance that, on average, would result in an approximately breakeven out-come, in terms of cost-gain, for the four HTS screening campaigns considered in that study.
Summary of screening set‑up
The screening workflow proposed in this study utilizes an initial screen of 20% of each compound library. The results from this initial screening are then used to train a conformal predictor and different confidence levels of the predictor are then evaluated using the internal valida-tion procedure and the defined gain-cost funcvalida-tion. High confidence levels will generate few predicted active com-pounds with a higher accuracy while a low confidence level will generate many predicted actives with lower accuracy. This way it is evaluated if it is better to screen many compounds expecting a lower hit-rate or few com-pounds with a higher hit-rate. All the initial screening data (20% of each library) was then used to construct a predictor that was used to predict the remaining 80% of the screening library based on the confidence level
indicated from the internal validation to give the highest gain. Compounds receiving a single label prediction as active are then considered for testing.
Performance evaluation measures
Since the prediction of a conformal predictor is a set of labels rather than always a single label, they are gener-ally evaluated by their validity and efficiency [12]. Valid-ity is defined as the fraction of predictions containing the correct label. This means in a binary classification that a single label prediction is correct if the label is the correct one, a dual label is always correct, and an empty predic-tion is always incorrect. The validity is guaranteed to cor-respond to the user-defined confidence level as long as the data is exchangeable. The efficiency of a conformal predictor is defined as the number of single label predic-tions, a higher fraction of single label predictions means a more efficient predictor.
Results and discussion
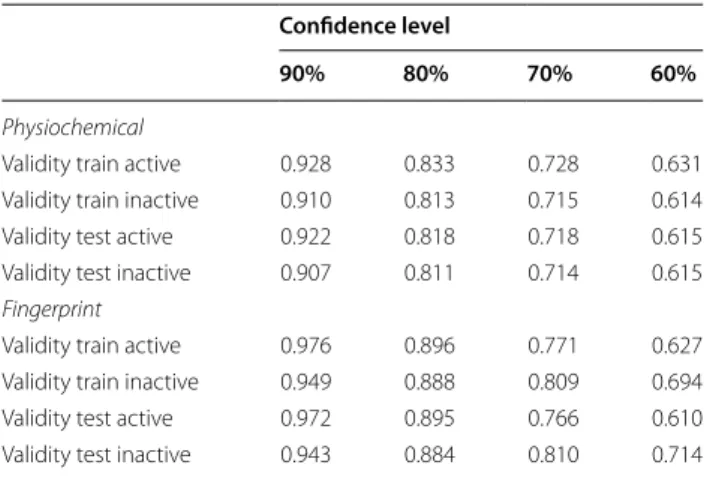
Table 3 summarizes the validities of the generated con-formal predictors. Overall the models based on phys-icochemical descriptors corresponded better to the set confidence level which is of importance in conformal prediction in relation to what can be expected from predictions on new data [12]. We therefore choose to base the main discussions around the results from the
physicochemical-based models while supplementing the discussion with results from the fingerprint based mod-els when merited. Detailed results for both approaches is available in the Additional file 1.
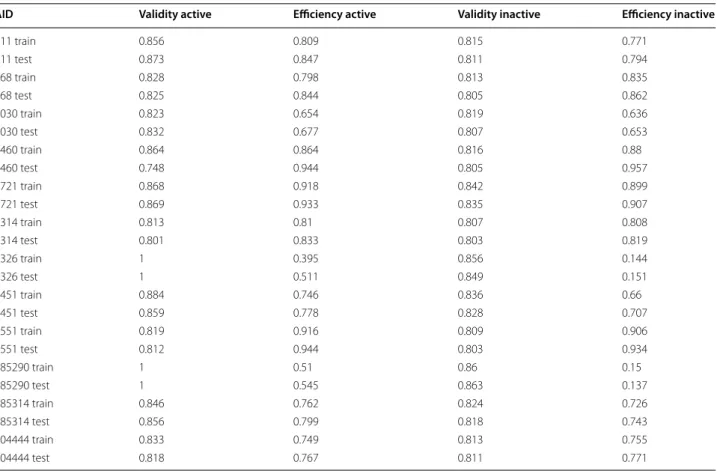
An overview of the performance of the models using the physicochemical descriptors is summarised in Table 4. It can be seen that the resulting models for the different datasets varied greatly in performance. Some
Fig. 2 Illustration of how conformal prediction classes are assigned
Table 3 Average validity of the physicochemical and fin-gerprint based models
Confidence level
90% 80% 70% 60%
Physiochemical
Validity train active 0.928 0.833 0.728 0.631
Validity train inactive 0.910 0.813 0.715 0.614
Validity test active 0.922 0.818 0.718 0.615
Validity test inactive 0.907 0.811 0.714 0.615
Fingerprint
Validity train active 0.976 0.896 0.771 0.627
Validity train inactive 0.949 0.888 0.809 0.694
Validity test active 0.972 0.895 0.766 0.610
datasets were poorly predicted, especially the two data-sets 2326 and 485290 produced poor models with very low efficiency (0.395 and 0.51 respectively), likely due to the extreme imbalance in the ratio of active to inac-tive compounds, 0.37 and 0.28%, respecinac-tively (Table 2), in the training data. The other datasets showed satisfactory outcomes with validities close to the desired 0.8 and effi-ciencies ranging from 0.6 to 0.9 in the internal validations on the training data. The trends observed in the train-ing data when applytrain-ing the internal validation procedure translated very well to how the models performed when applied to the test data with an average absolute differ-ence in the validity of 0.02 and 0.01 for active and inac-tive compounds respecinac-tively.
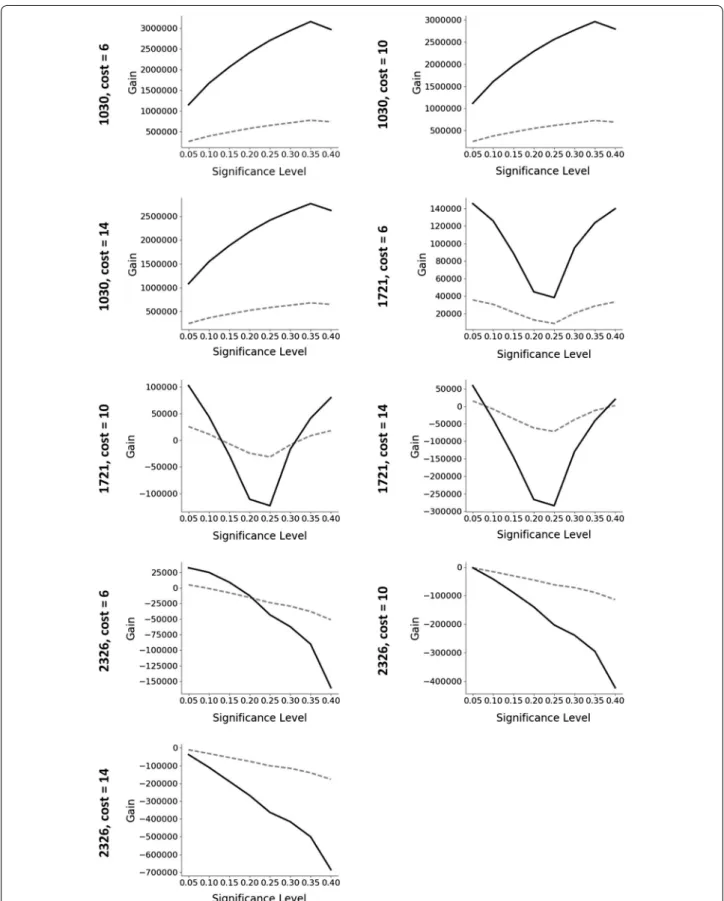
The total gain-cost evaluation for both the internal validation and the remaining test dataset for three cases displaying very different trends are shown in Fig. 3 (plots for all the datasets are available in the Additional file 1). Although the outcome is different between the datasets, it can be seen that the trend observed on the gain-cost evaluation on the training data is closely mirrored also in the test data.
If the optimal approach identified using the internal validation procedure had been used to select the next screening set from the remaining compounds, the gain would have been maximized in 8 of the 12 datasets at screening cost 6, in 9 of the 12 datasets at screening cost 10, and in 10 of the 12 datasets at screening cost 14 (see Additional file 2 for tabularised values).
Three principally different outcomes from the results of the cost-gain evaluations were indicated by the internal validation procedure: to screen the compounds predicted to be active (maximum gain obtained for one of the eval-uated conformal predictors), to screen all the remaining data (maximum gain obtained for the full training data), or not to screen any additional compounds (all screening outcomes indicate a loss).
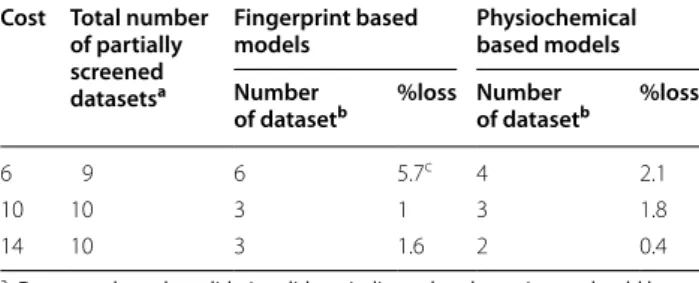
Furthermore, for the cases where the maximum gain for the test set was not correctly predicted by the internal training set validation, e.g. 411, 868, 1460, 2326, 2451 and 485314 at various cost levels, the average loss percent-age of the total gain (training and test set) is, with one exception, very small and only in the order of 0.5–2.1% (Table 5). For dataset 2326 using fingerprints, the internal
Table 4 Validity and efficiency for active and inactive compounds at the 80% confidence level for the derived conformal predictors based on physicochemical descriptors
Train denotes the results from the internal validation and test when the models are applied to the external test set
AID Validity active Efficiency active Validity inactive Efficiency inactive
411 train 0.856 0.809 0.815 0.771
411 test 0.873 0.847 0.811 0.794
868 train 0.828 0.798 0.813 0.835
868 test 0.825 0.844 0.805 0.862
1030 train 0.823 0.654 0.819 0.636
1030 test 0.832 0.677 0.807 0.653
1460 train 0.864 0.864 0.816 0.88
1460 test 0.748 0.944 0.805 0.957
1721 train 0.868 0.918 0.842 0.899
1721 test 0.869 0.933 0.835 0.907
2314 train 0.813 0.81 0.807 0.808
2314 test 0.801 0.833 0.803 0.819
2326 train 1 0.395 0.856 0.144
2326 test 1 0.511 0.849 0.151
2451 train 0.884 0.746 0.836 0.66
2451 test 0.859 0.778 0.828 0.707
2551 train 0.819 0.916 0.809 0.906
2551 test 0.812 0.944 0.803 0.934
485290 train 1 0.51 0.86 0.15
485290 test 1 0.545 0.863 0.137
485314 train 0.846 0.762 0.824 0.726
485314 test 0.856 0.799 0.818 0.743
504444 train 0.833 0.749 0.813 0.755
validation significantly underestimates the subsequent total gain by as much as 24%. This is one of the more poorly modelled datasets, potentially indicating that this approach should not be attempted if the internal valida-tion of the models indicates poor performance.
Despite having a generally lower performance with regards to validity and efficiency, the models based on fingerprints seem to be able to identify settings for the confidence levels that enable somewhat higher gains from screening the training set and the predicted test subset gain, compared to the corresponding models based on physicochemical descriptors for the investi-gated datasets (Table 6). However, it is difficult to com-pare the performance in terms of percentage since in some cases, 485314 at cost level 14, will generate a loss for the physicochemical descriptor-based model in com-parison to a small gain for the fingerprint based model. Excluding this example the fingerprint models perform, on average, 14–16% better with large variations (2–51%) between datasets and cost levels. On the other hand, for dataset 868, where the physicochemical descriptor-based model outperforms the fingerprint-descriptor-based model, the improvement is 23, 42 and 71% for cost levels 6, 10 and 14, respectively. Considering the grave underestima-tion of dataset 2326 (Table 5), the latter models seem to be more robust in nature compared to the corresponding models based on fingerprints.
Another important aspect of the presented procedure in this work is the correct identification of the cases where it would be beneficial, from a gain perspective, to screen the entire library as opposed to a subset of the same library. For datasets 1030, 2314 and 2551 the pre-dictions from the internal validation indicate that screen-ing the entire library would result in the highest gain. This is subsequently also found in all cases for screening the corresponding test set. Also for all cases where the training set validation procedure indicates that no gain can be obtained for the screening, this translated to the corresponding test set.
For some of the investigated cases the internal valida-tion indicates a gain for screening a subset, but when considering the cost for screening the full training set (in order to build the predictive models) the result is an overall loss. This is strongly correlated to the percent-age of active compounds in the training set. Thus, the investigated datasets with fewest actives, i.e. 1721, 2326 and 485290, show this behavior for many of the cost lev-els. For the 19 cases where the cost of screening the full training set is more than five times the indicated gain for screening a subset of the training set, only in one case (dataset 868, fingerprints, cost 14, factor 8) does the subsequent subset screening of the test set result in a small overall gain. This is an additional factor to consider when deciding to screen a particular compound library for a target, namely, that if the cost of screening in rela-tion to the predicted gain is very large, as indicated by the internal validation of the small training set, then the likelihood of generating an overall gain from subsequent screening of a predicted subset is very low. Again, such indications add knowledge for deciding upon to perform a subsequent screen or not of the remaining library for the target in question.
The high translatability of the results from inter-nal model validation is a key feature of the presented approach. Knowing in advance what the likely outcome of a screening campaign will be in terms of gain facilitates decision making and allow resources to be focused where testing delivers the most value. However, the results from this kind of evaluations are only one factor and other aspects, e.g. importance of the target in question and/or finding new (types of) active compounds, will also influ-ence decisions and may also be taken into consideration.
Although we applied the cost-gain function together with a conformal predictor, the concept of a cost-gain functions as a way to evaluate compound selection for screening can be paired with any prediction method. In our opinion this has many advantages over traditionally used evaluation metrics and we hope that this approach will be more widely applied than just within the context described herein.
Table 5 Average percent loss in gain where training data did not correctly predict maximum gain for the test set
a Datasets where the validation did not indicate that the entire set should be
screened for maximum gain
b Datasets where the optimum training set validation setting did not
correspond to the maximum test set gain
c Fails for dataset 2326: 23.9%. Excluding this result: 2.1%
Cost Total number of partially screened datasetsa
Fingerprint based
models Physiochemical based models Number
of datasetb %loss Number of datasetb %loss
6 9 6 5.7c 4 2.1
10 10 3 1 3 1.8
14 10 3 1.6 2 0.4
Table 6 Number of times the highest gain (training and test set) was obtained from fingerprint (FP) and phys-icochemical (PC) descriptors based models respectively
a Ties occur when the validation indicates that the entire library should be
screened
Cost Max gain FP Max gain PC Tiesa
6 6 3 3
10 9 1 2
Nevertheless, we think the conformal framework adds a number of additional benefits. Firstly, it provides an easy way to tune the number of single class predictions. Secondly, the setup is in our opinions easier to communi-cate to non-computational scientists since the concept of certainty is easily appreciated. Finally, conformal predic-tors are an easy way to handle the imbalance in the data-sets used for training, where there are typically very few active compounds compared to inactive.The presented cost-gain function in this work represents a very basic approach and additional research is required both to establish how to best assign the gain component as well as expanding the complexity of the considered variables. These questions and the expansion to more datasets will be the focus of future studies.
Conclusions
We present a workflow for the optimization of screen-ing gain based on conformal prediction and a gain-cost function. This approach represents a new way of evaluat-ing iterative screenevaluat-ing campaigns and optimizevaluat-ing screen-ing efficiency. This approach was applied to 12 bioactivity datasets derived from PubChem using two different fea-ture spaces, and we show that the method consistently indicates the optimal gain or a very close approximation to the optimal gain on the test data.
We show that, by using 20% of the screening library as an initial screening set, very accurate predictions of the gain for the remaining library can be obtained, identify-ing the optimal gain in between 8 and 10 out of 12 cases depending on the cost function used. Also, when the algorithm fails to identify the optimal settings the loss compared to the maximum is very small, in all but one case, falling in the range of 0.5–2.1%.
The described approach provides guidance on what selection of compounds to screen from the remaining library, or where appropriate, indicates that the entire library or that no more compounds should be screened in order to maximize gain or, for the last case, minimize loss.
Abbreviation
HTS: high throughput screening.
Additional files
Additional file 1. Plots showing the results of the gain-cost function for each dataset using three different cost levels.
Additional file 2. Information about the applied datasets, performance of the predictive models, and evaluation of the gain- cost function for the different datasets and settings.
Authors’ contributions
FS contributed concept. All authors co-designed the experiments. All authors contributed to the interpretation of results. FS and UN wrote the manuscript. AMA and AB reviewed and edited the manuscript. All authors read and approved the final manuscript.
Author details
1 Department of Chemistry, Centre for Molecular Informatics, University
of Cambridge, Lensfield Road, Cambridge CB2 1EW, UK. 2 IOTA
Pharmaceu-ticals, St Johns Innovation Centre, Cowley Road, Cambridge CB4 0WS, UK.
3 Unit of Toxicology Sciences, Karolinska Institutet, Swetox, Forskargatan 20,
151 36 Södertälje, Sweden. 4 Department of Computer and Systems Sciences,
Stockholm University, Box 7003, 164 07 Kista, Sweden.
Acknowledgements
The authors acknowledge Dr. Anna-Lena Gustavsson, Chemical Biology Con-sortium Sweden, CBCS, Karolinska Institutet, SciLifeLab, Stockholm, for fruitful discussions on the design of the gain vs. cost function in screening.
Competing interests
The authors declare that they have no competing interests.
Availability of data and materials
The datasets supporting the conclusions of this article are available in the PubChem repository, under their corresponding AID numbers. All Python packages and programmes used are freely available, see the respective references.
Ethics approval and consent to participate
Not applicable.
Funding
The research at Swetox (UN) was supported by Knut and Alice Wallenberg Foundation and Swedish Research Council FORMAS. AMA was supported by AstraZeneca.
Publisher’s Note
Springer Nature remains neutral with regard to jurisdictional claims in pub-lished maps and institutional affiliations.
Received: 15 November 2017 Accepted: 9 February 2018
References
1. Macarron R, Banks MN, Bojanic D et al (2011) Impact of high-throughput screening in biomedical research. Nat Rev Drug Discov 10:188–195. https://doi.org/10.1038/nrd3368
2. Paricharak S, IJzerman AP, Bender A, Nigsch F (2016) Analysis of iterative screening with stepwise compound selection based on Novartis in-house HTS data. ACS Chem Biol 11:1255–1264. https://doi.org/10.1021/ acschembio.6b00029
3. Svensson F, Norinder U, Bender A (2017) Improving screening efficiency through iterative screening using docking and conformal prediction. J Chem Inf Model 57:439–444. https://doi.org/10.1021/acs.jcim.6b00532 4. Pertusi DA, O’Donnell G, Homsher MF et al (2017) Prospective
assessment of virtual screening heuristics derived using a novel fusion score. SLAS Discov Adv Life Sci R&D 22:995–1006. https://doi. org/10.1177/2472555217706058
5. Maciejewski M, Wassermann AM, Glick M, Lounkine E (2015) Experimental design strategy: weak reinforcement leads to increased hit rates and enhanced chemical diversity. J Chem Inf Model 55:956–962. https://doi. org/10.1021/acs.jcim.5b00054
7. Mysinger MM, Carchia M, Irwin JJ, Shoichet BK (2012) Directory of useful decoys, enhanced (DUD-E): better ligands and decoys for better bench-marking. J Med Chem 55:6582–6594. https://doi.org/10.1021/jm300687e 8. Truchon J-F, Bayly CI (2007) Evaluating virtual screening methods: good
and bad metrics for the “early recognition” problem. J Chem Inf Model 47:488–508. https://doi.org/10.1021/ci600426e
9. Marmot MG, Altman DG, Cameron DA, Dewar JA, Thompson SG, Wilcox M (2017) The benefits and harms of breast cancer screening: an independent review. Lancet 380:1778–1786. https://doi.org/10.1016/ s0140-6736(12)61611-0
10. Bahnsen AC, Stojanovic A, Aouada D, Ottersten B (2013) Cost sensitive credit card fraud detection using Bayes minimum risk. In: 2013 12th inter-national conference on machine learning and applications, pp 333–338 11. Bahnsen A, Stojanovic A, Aouada D, Ottersten B (2014) Improving credit card fraud detection with calibrated probabilities. In: Proceedings of the 2014 SIAM international conference on data mining. Society for Industrial and Applied Mathematics, pp 677–685
12. Vovk V, Gammerman A, Shafer G (2005) Algorithmic learning in a random world. Springer, New York, pp 1–324
13. Norinder U, Boyer S (2017) Binary classification of imbalanced datasets using conformal prediction. J Mol Graph Model 72:256–265. https://doi. org/10.1016/j.jmgm.2017.01.008
14. Löfström T, Boström H, Linusson H, Johansson U (2015) Bias reduction through conditional conformal prediction. Intell Data Anal 19:1355–1375 15. Svensson F, Norinder U, Bender A (2017) Modelling compound
cytotoxic-ity using conformal prediction and PubChem HTS data. Toxicol Res (Camb) 6:73–80. https://doi.org/10.1039/C6TX00252H
16. Eklund M, Norinder U, Boyer S, Carlsson L (2012) Application of conformal prediction in QSAR. In: IFIP advances in information and communication technology, pp 166–175
17. Eklund M, Norinder U, Boyer S, Carlsson L (2013) The application of conformal prediction to the drug discovery process. Ann Math Artif Intell 74:117–132. https://doi.org/10.1007/s10472-013-9378-2
18. Norinder U, Svensson F, Afzal AM, Bender A (2017) Maximizing gain in HTS screening using conformal prediction. Proc Mach Learn Res 60:103–117 19. Wang Y, Bryant SH, Cheng T et al (2017) PubChem BioAssay: 2017 update.
Nucleic Acids Res 45:D955–D963
20. IMI eTOX project standardizer. https://pypi.python.org/pypi/standardiser 21. MolVS standardizer. https://pypi.python.org/pypi/MolVS
22. RDKit: Open-source cheminformatics. http://www.rdkit.org
23. Pedregosa F, Varoquaux G, Gramfort A et al (2011) Scikit-learn: machine learning in Python. J Mach Learn Res 12:2825–2830. https://doi. org/10.1007/s13398-014-0173-7.2
24. nonconformist package. https://github.com/donlnz/nonconformist 25. Carlsson L, Eklund M, Norinder U (2014) Aggregated conformal
predic-tion. In: Iliadis L, Maglogiannis I, Papadopoulos H et al (eds) Artificial intelligence applications and innovations: AIAI 2014 workshops: CoPA, MHDW, IIVC, and MT4BD, Rhodes, Greece, 19–21 September 2014. Pro-ceedings. Springer, Berlin, pp 231–240
26. Norinder U, Carlsson L, Boyer S, Eklund M (2014) Introducing conformal prediction in predictive modeling. A transparent and flexible alternative to applicability domain determination. J Chem Inf Model 54:1596–1603. https://doi.org/10.1021/ci5001168
27. Schrijver I, Baron EJ (2002) Labor and cost requirements of two commercial assays for qualitative molecular detection of hepati-tis C virus. J Clin Microbiol 40:3476–3477. https://doi.org/10.1128/ JCM.40.9.3476-3477.2002