R E S E A R C H A R T I C L E
Open Access
Reproducibility and repeatability of
same-day two sequential FDG PET/MR
and PET/CT
David Groshar
1,2†, Hanna Bernstine
1,2†, Natalia Goldberg
1, Meital Nidam
1, Dan Stein
1, Ifat Abadi-Korek
1and Liran Domachevsky
1*Abstract
Background:To determine PET/CT and PET/MR reproducibility and PET/MR repeatability of fluorine 18 fluorodeoxyglucose (FDG) uptake measurements in tumors in cancer patients.
Methods:This IRB approved prospective study was performed between October 2015 and February 2016 in consecutive patients who performed same day PET/CT and two sequential PET/MR. Thirty three patients with visible tumors (N= 63) were included. SUV for body weight (SUV) and lean body mass (SUL) were obtained. Volume of interest (VOI) with a threshold of 40% was used and SUV/L’s, metabolic tumor volume (MTV) and tumor to liver ratio (T/L) were calculated. Measurements were plotted in a scattered diagram to visually identify correlation, a regression line was drawn and the equation of the line was calculated. Bland-Altman plots expressed as percentages were constructed to assess the agreement between measurements. The maximal clinically acceptable limits range was defined as ±30%.
Results:Lesional SUV’s, SUL’s and MTV corrected to body weight (BW) and lean body mass (LBM) demonstrated strong positive linear correlation between PET/CT and PET/MR and between two sequential PET/MR. The 95% limits of agreement ranged from -27.7 to 17.5 with a mean of -5.1 and -27.6 to 17.9 with a mean of -4.9 for SUVpeak and SULpeak, respectively for sequential PET/MR. Other PET metrics demonstrated limits range that is above ±30% between PET/CT and PET/MR and between two sequential PET/MR.
Conclusion:PET/MR SUV/L peak has a clinically acceptable repeatability performance and can be used to evaluate the response to treatment.
Keywords:PET/MR, SUV, Reproducibility, Repeatability, Reliability
Background
The introduction of hybrid PET/MR imaging offers a new modality that combines high soft-tissue contrast resolution of MR with metabolic imaging from PET within a single imaging session. This modality has shown promising results in oncological imaging and could be useful in the management of patients with cancer [1]. Quantitative or semi-quantitative imaging biomarkers such as fluorine 18 fluorodeoxyglucose (FDG) may predict response to therapy earlier compared to conventional
imaging as metabolic changes in tumors may precede changes in tumor size and texture and determine tissue viability [2].
FDG uptake can be assessed qualitatively as mild, moderate or intense compared to the background uptake in normal appearing tissues of which liver parenchyma is the most commonly used. However, quantitative or semi-quantitative PET metrics, rather than qualitative assess-ments, should be used in order to obtain comparable results both from sequential studies of a single patient and between different patient groups [3]. Indeed, SUV that is a semi quantitative measurement to evaluate FDG uptake in a tumor or organ by PET/CT has been successfully used in clinical studies in addition to visual assessments. * Correspondence:[email protected]
†Equal contributors
1Department of Nuclear Medicine, Assuta Medical Center, 20 habarzel st.,
6971028 Tel-Aviv, Israel
Full list of author information is available at the end of the article
The use of semi-quantitative measurements for patient follow-up or for comparison between different scanners relies on the high degree of repeatability and reproduci-bility, respectively. Knowledge of the expected range in reproducibility and repeatability is needed to determine what change in parameters between two examinations can be considered significant in an individual patient or between patient groups. Commercially available Dixon-based PET/MR attenuation correction (MRAC) differs from density-based PET/CT attenuation correction (CTAC) and has been shown to affect FDG uptake measurements in tumor lesions and in normal appearing structures [4]. Several studies have compared FDG PET images from PET/CT and PET/MR in clinical data [1, 5–13] and found similar diagnostic performance and detection rates, despite some differences in the semi-quantitative assessment of FDG uptake [14]. Unlike previous reports the test-retest repeatability in this study was performed on the same day and patients were randomized regarding the order of PET/ CT and PET/MR studies. Same-day repeatability with studies performed in sequence enables evaluation of the PET/MR system reliability as variables related to the patient such as patient habitus or changes in tissues following therapy are similar, while randomization of patients ob-viates differences in biodistribution which still affect FDG uptake even with a modest temporal offset. The purpose of this observational prospective study is to determine PET/CT and PET/MR reproducibility and test-retest PET/MR repeatability of lesional FDG PET metrics obtained by PET/CT and by two sequential PET/MR examinations performed on the same day in patients with cancer.
Methods
This observational prospective study was approved by the institutional review board. Informed written consent was obtained from all patients participating in the study. Between October 2015 and February 2016, consecutive patients who performed PET/CT and two sequential non-enhanced whole-body PET/MR were enrolled. All patients had a biopsy-proven cancer (Table 1) and under-went PET/CT either for initial evaluation or for follow-up. Patients were randomized using a simple randomization to a group in which sequential PET/MR was performed first and to a second group in which PET/CT was per-formed first (Table 1). The sequential PET/MR studies were conducted in a row (i.e., immediately after the first PET/MR scan was ended the second PET/MR was started). Only patients with visible tumor based on PET/ CT and PET/MR findings were included. A total of 33 out of 67 patients with 63 conspicuous tumor lesions (mean age 53.1 ± 12.1years, 19 females, mean age 52.4 ± 11.8 years and 14 males, mean age 54.1 ± 12.5 years) were included (Table 1).
PET/CT Protocol
PET/CT was performed using an integrated PET/CT scan-ner (GEMINI TF, PHILIPS Medical Systems, Cleveland, Ohio, USA). Intravenously FDG dose of 5.18MBq/kg (varied from 370 to 666 MBq) and 800–1000 mL of diluted iodinated contrast material was administered orally for bowel opacification. Contrast-enhanced 64-slice multi-detector CT was performed from skull base to mid-thigh with the arm-up position with tube volt-age of 120 kVp, spiral CT at 0.8s per rotation with modulated 30–250 mAs, section thickness of 3.00 mm, and 3.00 mm interval with image reconstruction every 3.0 mm. Intravenous iodine contrast media (Omnipaque 300; iohexol 0.623 g/ml, GE Healthcare, USA; 1.5 cm3/kg) was administered in all examinations, except for pa-tients with known iodine hypersensitivity or renal in-sufficiency. PET emission images were obtained with 2 min of acquisition per bed position with five to six bed positions from skull base to mid-thigh. PET data was reconstructed using 3D- ordered subset expect-ation maximizexpect-ation (OSEM), (3 iterexpect-ation and 20 subsets, Table 1Patient characteristic
Patients with visible lesions
(N= 33)
Age (years) 53.1 ± 12.1 (28–75)
Gender Female n = 19, age 52.4 ± 11.8
Male n = 14, age 54.1 ± 12.5
MR first 16
CT first 17
Time to CT (minutes) 110 ± 32 (47–185)
Time to MR (minutes) 104 ± 36 (41–175)
Time to exam (minutes) 81 ± 22 (41–175)
Time between exams (minutes)
53 ± 17 (25–88)
Blood glucose levels (mg/dl)
95.47 ± 26.4 (69–203)
BMI 25.8 ± 5.1 (16.2–35.7)
Disease Breast 12
Lung 7
Lymphoma 2
Melanoma 1
CRC 7
Head and neck 3
other 1
Number of lesions
1 13
2 10
4 mm Gaussian filter) on 144 matrix with CT-based at-tenuation correction.
PET/MR Protocol
FDG PET/MR was performed from skull base to mid-thigh with the arm-down position, on the Biograph mMR (Siemens AG, healthcare sector, Erlangen, Germany) sim-ultaneous PET/MR system. Patients were positioned su-pine and multi-step/multi-bed scanning was performed in caudo-cranial direction with four bed positions. We used a 24–channel spine RF coil integrated within the MR bed and 3 surface body coils (6 channel each) to cover the thorax, abdomen and pelvis. For the neck we used a 16-channel RF head/neck coil.
PET data was acquired in the list mode and recon-structed with 3D-OSEM, (3 iteration and 21 subsets, 4 mm Gaussian filter) on 172 matrix. Each bed position was started with coronal Dixon-based sequences for MR attenuation correction (MRAC) (breath holding) (19s). This was followed by axial T2 half-fourier acquisition single shot turbo spin echo (HASTE) (free breathing) (36s), coronal T2 HASTE with fat suppression (FS) (Inversion recovery (IR) –based) (44s) and axial T1 volu-metric interpolated breath-hold examination (VIBE) Dixon (breath holding) (20s). PET data was acquired simul-taneously with acquisition time of 5 min for each bed position. Similar parameters were used for the sequential PET/MR scan.
Image analysis
We used dedicated software (Syngo.via; Siemens AG, healthcare sector, Erlangen, Germany) for maximal, peak and mean SUV calculations normalized for body weight (SUV) and lean body mass (SUL).
SUV/Lmax is a single-pixel value of the maximal SUV/L within the sphere, whereas SUV/Lpeak is the mean SUV/L within a predetermined volume of interest (VOI) of 1ml around the voxel with the highest SUV/L in the sphere. SUV/Lmean is the average SUV/L value within the sphere.
Normalization for BW was performed using the pa-tient weight in kg, measured before FDG injection and for LBM using the following formula:
LBM femaleð Þ ¼ ð1:07 X BWÞð Þkg
–148 BW kg½ ð Þ=body height cmð Þ2
LBM maleð Þ ¼ ð1:1 X BWÞð Þkg
–128 BW kg½ ð Þ=body height cmð Þ2
Studies were searched for the presence of lesions by visual analysis. Characterization of lesions was per-formed based on increased FDG uptake compared to surrounding tissue and abnormal structure on CT and
MR and was conducted by a dual board-certified in radiology and nuclear medicine physician (L.D., with 3 years of experience) and a board-certified nuclear medicine physician (H.B., with 9 years of PET/CT experience). However, measurements were only conducted by a board-certified nuclear medicine physician (H.B.). There was no lower or upper size limit for any visible lesion.
A spherical VOI was placed in the lesion and an iso-contour VOI with a threshold of 40% of SUV/Lmax cor-rected to LBM and BW was drawn in up to 3 distinct separated lesions (i.e., the largest lesions were selected) per each patient. In addition, a VOI with a diameter of 3 cm was drawn on the right lobe of the liver and tumor to liver ratio was determined. All VOI’s were visually evaluated on axial, sagittal and coronal planes to be cer-tain that the VOI is well located in the desired area.
Statistical analysis
Values are shown as mean ± SD from sequential PET/ MR variables and from variables values from PET/MR and PET/CT. For PET/MR and PET/CT comparison, the average of the two PET/MR measurements was used. Measurements were plotted in a scattered diagram to visually identify correlation, a regression line was drawn and the equation of the line was calculated.
Bland-Altman plots were constructed for each PET metrics variable to assess the agreement between the measurements. The maximal clinically acceptable limits range was defined as ±30%, based on the PERCIST defi-nition for partial response and progressive disease [15].
Statistical analysis was performed using SPSS (IBM version 21) and MedCalc (version 16.2.0).
Results
Lesional correlation and agreement between PET/CT and PET/MR
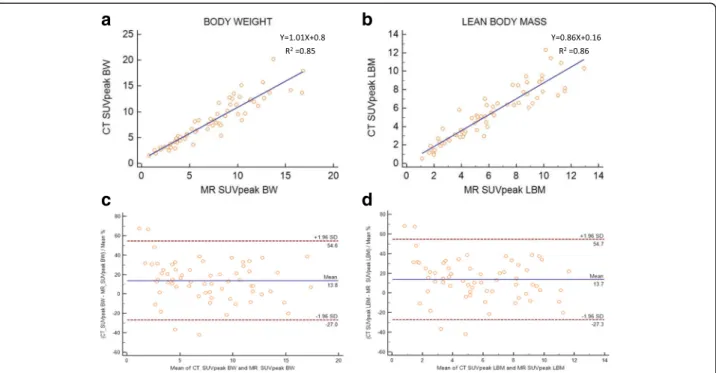
A mixed effects model that accounted for correlation of several lesional measurements within a patient showed no significant effect on the results. PET/CT and PET/ MR SUV and SUL measurements of lesions, liver and tumor to liver ratio are shown in Table 2. Lesional SUV’s and SUL’s corrected to BW and LBM demonstrated strong positive linear correlation between PET/CT and PET/MR (Fig. 1).
The 95% limits of agreement and mean difference expressed as percentages for lesional SUV max, peak and mean corrected to BW and LBM were above the clinically acceptable range (Table 4).
correlation between PET/CT and PET/MR (Fig. 2). Bland-Altman plots for MTV with y-axis values expressed as percentages showed 95% limits of agreement ranging from -41.7 to 96.2 with a mean of 27.3 and -43.4 to 88 with a mean of 22.3 corrected to BW and LBM, respectively (Fig. 2).
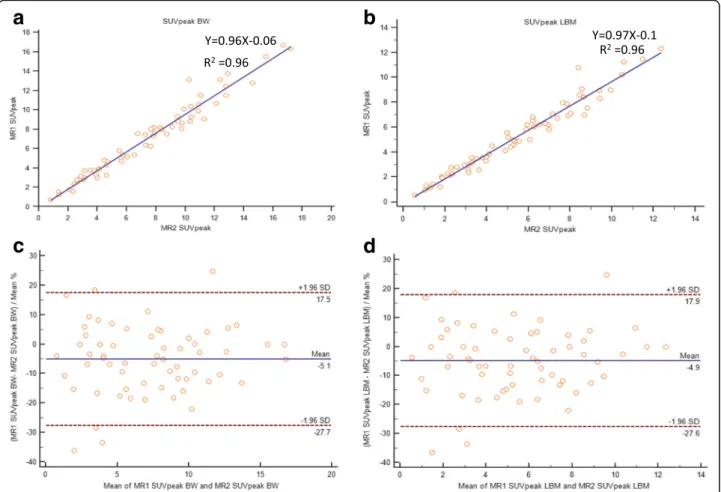
Lesional correlation and agreement between two sequential PET/MR
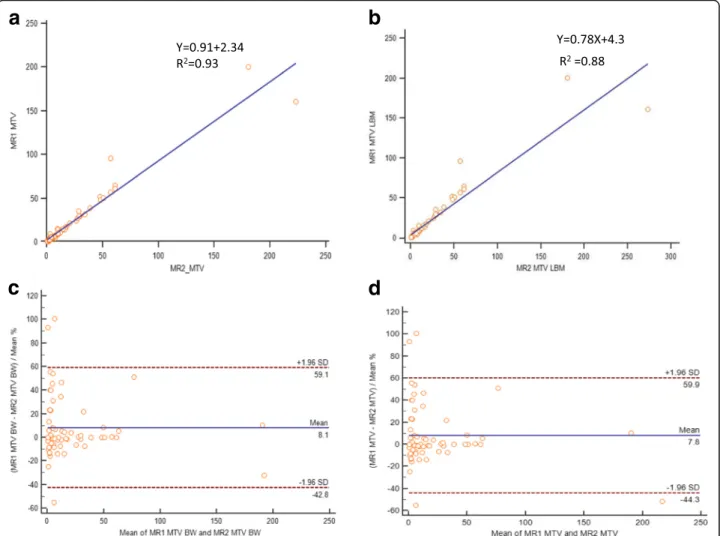
Two sequential PET/MR SUV and SUL measurements of lesions, liver and tumor to liver ratio are shown in Table 3. Lesional SUV’s and SUL’s corrected to BW and LBM dem-onstrated strong positive linear correlation between two sequential PET/MR (Fig. 3). The 95% limits of agreement and mean difference expressed as percentages for lesional SUVpeak corrected to BW and LBM were below the clinically acceptable range of ±30%, but was larger for SUVmax and mean (Table 4). Representative Bland-Altman plots for SUVpeak with y-axis values expressed as percentages showed 95% limits of agreement ranging from -27.7 to 17.5 with a mean of -5.1 and -27.6 to 17.9 with a mean of -4.9 corrected to BW and LBM, respectively (Fig. 3). Lesional MTV corrected to BW and LBM demon-strated strong linear correlation between two sequential PET/MR (Fig. 4). Bland-Altman plots for MTV with y-axis values expressed as percentages showed 95% limits of agreement ranging from -42.8 to 59.1 with a mean of 8.1 and -44.3 to 59.9 with a mean of 7.8 corrected to BW and LBM, respectively (Fig. 4). After exclusion of tumors with Table 2PET/CT and PET/MR SUV and SUL measurements of
tumor, liver and tumor to liver ratio (ratio)
Tumor Liver Ratio
SUV max
PET/CT 10.54 ± 5.41 2.74 ± 0.57 4.97 ± 2.91
PET/MR 10.02 ± 5.23 2.30 ± 0.69 4.76 ± 3.18
SUV mean
PET/CT 6.11 ± 3.13 2.17 ± 0.41 3.01 ± 1.81
PET/MR 5.66 ± 2.84 1.80 ± 0.36 3.24 ± 1.69
SUV peak
PET/CT 8.14 ± 4.32 2.66 ± 0.41 3.21 ± 1.92
PET/MR 7.25 ± 3.95 2.01 ± 0.39 3.75 ± 2.21
SUL max
PET/CT 7.81 ± 3.97 2.28 ± 0.31 3.58 ± 2.04
PET/MR 7.42 ± 3.85 1.64 ± 0.29 4.74 ± 2.78
SUL mean
PET/CT 4.5 ± 2.27 1.56 ± 0.25 3.08 ± 1.84
PET/MR 4.17 ± 2.09 1.30 ± 0.24 3.35 ± 1.85
SUL peak
PET/CT 6.01 ± 3.1 1.92 ± 0.25 3.28 ± 1.94
PET/MR 5.35 ± 2.88 1.46 ± 0.26 3.79 ± 2.23
Fig. 1Scatter diagram with regression line and Bland-Altman plots between PET/CT and PET/MR SUVpeak measurements corrected to body weight
volume less than 10ml the 95% limits of agreement ranged from -29.5 to 38.8 with a mean of 4.6 and -34 to 41.8 with a mean of 3.9 corrected to BW and LBM (Fig. 5).
Discussion
Our study demonstrates strong correlation of lesional PET metrics between same day PET/CT and PET/MR and between two sequential PET/MR with good lesional SUV/L peak agreement between two sequential PET/MR.
As a new modality PET/MR test-retest repeatability and agreement with regard to SUV/L’s measurements has to be validated. Furthermore, reproducibility and agreement of PET-based variables between PET/MR and PET/CT must also be assessed as patients may swap between these modalities on follow-up studies. Principal factors that differ between PET/CT and PET/MR and might affect reliability include: different methods to cre-ate attenuation correction maps, scanning time, different PET detectors and MR hardware. Data regarding the re-liability of FDG PET/MR metrics is sparse.
Reproducibility between PET/CT with PET/MR
With regard to lesional reproducibility, there are con-flicting results in the literature. Al-Nabhani et al. [8] have shown that lesional SUVmean measurements were approximately 10% higher on PET/MR. Pace et al. [13]
Fig. 2Scatter diagram with regression line and Bland-Altman plot between PET/CT and PET/MR MTV measurements corrected to BW (a,c) and
LBM (b,d)
Table 3Two sequential PET/MR SUV and SUL measurements of tumor, liver and tumor to liver ratio
Tumor Liver Ratio
SUV max
PET/MR 1st 9.71 ± 5.35 2.28 ± 0.45 4.48 ± 2.74
PET/MR 2nd 10.33 ± 5.19 2.24 ± 0.44 4.78 ± 2.56
SUV mean
PET/MR 1st 5.39 ± 2.86 1.82 ± 0.38 3.11 ± 1.82
PET/MR 2nd 5.92 ± 2.89 1.79 ± 0.37 3.42 ± 1.71
SUV peak
PET/MR 1st 7.09 ± 3.93 2.03 ± 0.41 3.65 ± 2.21
PET/MR 2nd 7.42 ± 4.01 1.98 ± 0.39 3.86 ± 2.22
SUL max
PET/MR 1st 7.17 ± 3.96 1.65 ± 0.31 4.55 ± 2.79
PET/MR 2nd 7.62 ± 3.81 1.62 ± 0.31 4.96 ± 2.93
SUL mean
PET/MR 1st 3.98 ± 2.12 1.32 ± 0.27 3.16 ± 1.86
PET/MR 2nd 4.37 ± 2.13 1.28 ± 0.24 3.56 ± 1.89
SUL peak
PET/MR 1st 5.23 ± 2.89 1.48 ± 0.28 3.69 ± 2.24
have also shown that PET/MR SUVmax and SUVmean were higher in primary lesions, lymph nodes and distant metastases in the range of 34 and 21%, respectively. On the contrary, Wiesmuller et al. [6] has shown a decrease of 22% and 10% in SUVmax and SUVmean, respectively. In all studies, patients underwent PET/CT followed by PET/MR on the same day. One major assumed factor that may have influenced these results is the time inter-val from the radiotracer injection to scanning that was longer for PET/MR in those studies. In order to reduce the effect of injection to scan time interval we randomized the order of studies. We found good correlation of PET metrics between PET/CT and PET/MR but a wide range of limits was demonstrated on Bland-Altman plots which is considered to be clinically unaccepted.
Repeatability between two sequential PET/MR
We found strong positive correlation for all PET metrics with clinically acceptable agreement only for lesional SUV/Lpeak. This is in accordance with Rasmussen et al. [16] who found 95% limits of agreement ranging from -12.5 to 20.4 for the different lesional SUV between two PET/MR that lies within a clinically acceptable range. A
Fig. 3Scatter diagram with regression line and Bland-Altman plots between sequential PET/MR SUVpeak measurements corrected to body
weight (a,c) and lean body mass (b,d)
Table 4Lower and upper 95% limits of agreement and mean difference expressed as percentages for lesional SUV max, peak and mean corrected to BW and LBM
Mean difference (%)
Limits of agreement (%)
Lower Upper
PET/CT vs PET/MR
Corrected to BW SUVmax 7 −43.7 57.7
SUVpeap 13.9 −27.3 55
SUVmean 8.3 −41.1 57.6
Corrected to LBM SUVmax 36.1 −17.2 89.3
SUVpeak 13.7 −27.3 54.7
SUVmean 8.4 −40.6 57.4
PET/MR vs PET/MR
Corrected to BW SUVmax −7.4 −36.8 22
SUVpeak −5.1 −27.7 17.5
SUVmean −10.5 −41.8 20.7
Corrected to LBM SUVmax −7.2 −36.7 22.4
SUVpeak −4.9 −27.6 17.9
Fig. 4Scatter diagram with regression line and Bland-Altman plot between sequential PET/MR MTV measurements corrected to BW (a,c) and LBM (b,d)
similar repeatability performance of PET/CT lesional FDG uptake was found in a meta-analysis performed by Langen et al. [17] for which 25% and 20% were found to be the limits for SUVmax and SUVmean, respectively.
Volumetric parametershave gained increasingly inter-est as prognostic factors for various cancers [18]. How-ever, to date, only few studies have focused on MTV repeatability. We found a strong linear correlation of lesional MTV corrected to BW and LBM between PET/ CT and PET/MR and between two sequential PET/MR. However, the range of 95% limits of agreement was far beyond the clinically acceptable range. Our findings are in accordance with several studies. For example, Fring et al. [19] demonstrated a repeatability range for metabolic tumor volume between two PET/CT up to 37% in non-small cell tumors greater than 4.2 ml and a range of 36% for gastrointestinal tumors [20]. Rasmussen et al. [16] found similar range between two PET/CT for head and neck squamous cell carcinoma. Interestingly, they found that the range between two PET/MR was lower than 30%. We have found similar results after exclusion of tumors with volume less than 10ml (Fig. 5).
We believe that there are two strength points in our study. First, randomization of the order of studies re-duces the effect of the time interval from the radiotracer injection to scanning which has an effect on FDG uptake in lesions. Second, performing sequential PET/MR studies on the same day evaluates scanner performance with minimal effect of factors that are seen in longer interval that may influence reliability such as changes in body habitus, changes in tissues and lesional texture as a result of therapy.
Our study has several limitations. First, the number of patients is relatively small. Second, lesions determination relied on imaging findings and not on histopathology or follow up studies. Third, image analyses were performed by a single reader although with extensive experience and meticulous assessment of studies. Fourth, PET ac-quisition time was different between PET/CT and PET/ MR which may affect SUV measurements. This, how-ever, resembles reality where PET acquisition time in PET/MR is determined by the length of MR sequences and is longer than PET/CT.
Conclusions
PET/MR SUV/L peak has a clinically acceptable re-peatability performance and can be used to evaluate the response to treatment. PET/MR MTV measure-ments have a larger limit range that is inversely related to the volume of the lesion. Further studies are warranted to evaluate the reproducibility and repeat-ability of other imaging systems and to consolidate our findings.
Abbreviations
BW:Body weight; CTAC: PET/CT attenuation correction; FDG: Fluorine 18 fluorodeoxyglucose; FS: Fat suppression; HASTE: Half-fourier acquisition single shot turbo spin echo; IR: Inversion recovery; LBM: Lean body mass; MRAC: PET/ MR attenuation correction; MTV: Metabolic tumor volume; OSEM: Ordered subset expectation maximization; SUL: SUV for lean body mass; SUV: SUV for body weight; T/L: Tumor to liver ratio; VIBE: Volumetric interpolated breath-hold examination; VOI: Volume of interest
Acknowledgements
NA.
Funding
NA.
Availability of data and materials
The datasets used and/or analyzed during the current study available from the corresponding author on reasonable request.
Authors’contributions
DG—Study conception and design, Analysis and interpretation of data, Drafting of manuscript, Critical revision. HB—Study conception and design, Acquisition of data, Analysis and interpretation of data. NG—Acquisition of data, Drafting of manuscript. MN and DS—Study conception and design, Analysis and interpretation of data. IAK—Study conception and design, Drafting of manuscript. LD—Study conception and design, Acquisition of data, Analysis and interpretation of data, Drafting of manuscript, Critical revision. All authors read and approved the final manuscript.
Competing interests
The authors declare that they have no competing interests.
Consent for publication
NA.
Ethics approval and consent to participate
This observational prospective study was approved by the institutional review board.
Assuta institutional review board, Reference #2015024.
Publisher’s Note
Springer Nature remains neutral with regard to jurisdictional claims in published maps and institutional affiliations.
Author details
1Department of Nuclear Medicine, Assuta Medical Center, 20 habarzel st.,
6971028 Tel-Aviv, Israel.2Sackler Faculty of Medicine, Tel Aviv University,
Tel-Aviv, Israel.
Received: 5 December 2016 Accepted: 8 March 2017
References
1. Quick HH, von Gall C, Zeilinger M, et al. Integrated whole-body PET/MR hybrid imaging: clinical experience. Invest Radiol. 2013;48:280–9. 2. Cheson BD. Staging and response assessment in lymphomas: the new
Lugano classification. Chin Clin Oncol. 2015;4:5.
3. Li X, Heber D, Rausch I, et al. Quantitative assessment of atherosclerotic plaques on (18)F-FDG PET/MRI: comparison with a PET/CT hybrid system. Eur J Nucl Med Mol Imaging. 2016;43(8):1503–12.
4. Teuho J, Johansson J, Liden J, et al. Effect of attenuation correction on regional quantification between PET/MR and PET/CT: a multicentr study using a 3-dimensional brain phantom. J Nucl Med. 2016;57:818–24. 5. Schwenzer NF, Schraml C, Müller M, Brendle C, Sauter A, Spengler W,
Pfannenberg AC, Claussen CD, Schmidt H. Pulmonary lesion assessment: comparison of whole-body hybrid MR/PET and PET/CT imaging–pilot study. Radiology. 2012;264:551–8.
simultaneously acquiring whole-body PET/MR hybrid scanner and PET from PET/CT. Eur J Nucl Med Mol Imaging. 2013;40:12–21.
7. Tian J, Fu L, Yin D, Zhang J, Chen Y, An N, Xu B. Does the novel integrated PET/MRI offer the same diagnostic performance as PET/CT for oncological indications? PLoS One. 2014;9:e90844.
8. Al-Nabhani KZ, Syed R, Michopoulou S, Alkalbani J, Afaq A, Panagiotidis E, O’Meara C, Groves A, Ell P, Bomanji J. Qualitative and quantitative comparison of PET/CT and PET/MR imaging in clinical practice. J Nucl Med. 2014;55:88–94.
9. Varoquaux A, Rager O, Poncet A, Delattre BMA, Ratib O, Becker CD, Dulguerov P, Dulguerov N, Zaidi H, Becker M. Detection and quantification of focal uptake in head and neck tumours: (18)F-FDG PET/MR versus PET/CT. Eur J Nucl Med Mol Imaging. 2014;41:462–75.
10. Ripa RS, Knudsen A, Hag AMF, Lebech A-M, Loft A, Keller SH, Hansen AE, von Benzon E, Højgaard L, Kjær A. Feasibility of simultaneous PET/MR of the carotid artery: first clinical experience and comparison to PET/CT. Am J Nucl Med Mol Imaging. 2013;3:361–71.
11. Eiber M, Takei T, Souvatzoglou M, et al. Performance of whole-body integrated 18F-FDG PET/MR in comparison to PET/CT for evaluation of malignant bone lesions. J Nucl Med. 2014;55:191–7.
12. Drzezga A, Souvatzoglou M, Eiber M, et al. First clinical experience with integrated whole-body PET/MR: comparison to PET/CT in patients with oncologic diagnoses. J Nucl Med. 2012;53:845–55.
13. Pace L, Nicolai E, Luongo A, Aiello M, Catalano OA, Soricelli A, Salvatore M. Comparison of whole-body PET/CT and PET/MRI in breast cancer patients: lesion detection and quantitation of 18F-deoxyglucose uptake in lesions and in normal organ tissues. Eur J Radiol. 2014;83:289–96.
14. Karlberg AM, Sæther O, Eikenes L, Goa PE. Quantitative comparison of PET performance-Siemens Biograph mCT and mMR. EJNMMI Phys. 2016;3:5. 15. Wahl RL, Jacene H, Kasamon Y, Lodge MA. From RECIST to PERCIST:
Evolving Considerations for PET response criteria in solid tumors. J Nucl Med. 2009;50 Suppl 1:122S–50S.
16. Rasmussen JH, Fischer BM, Aznar MC, et al. Reproducibility of (18)F-FDG PET uptake measurements in head and neck squamous cell carcinoma on both PET/CT and PET/MR. Br J Radiol. 2015;88:20140655.
17. de Langen AJ, Vincent A, Velasquez LM, et al. Repeatability of 18F-FDG uptake measurements in tumors: a metaanalysis. J Nucl Med. 2012;53:701–8. 18. Domachevsky L, Groshar D, Galili R, Saute M, Bernstine H. Survival
Prognostic Value of Morphological and Metabolic variables in Patients with Stage I and II Non-Small Cell Lung Cancer. Eur Radiol. 2015;25:3361–7. 19. Frings V, de Langen AJ, Smit EF, van Velden FHP, Hoekstra OS, van Tinteren H,
Boellaard R. Repeatability of metabolically active volume measurements with 18F-FDG and 18F-FLT PET in non-small cell lung cancer. J Nucl Med. 2010;51: 1870–7.
20. Frings V, van Velden FHP, Velasquez LM, Hayes W, van de Ven PM, Hoekstra OS, Boellaard R. Repeatability of metabolically active tumor volume measurements with FDG PET/CT in advanced gastrointestinal malignancies: a multicenter study. Radiology. 2014;273:539–48.
• We accept pre-submission inquiries
• Our selector tool helps you to find the most relevant journal
• We provide round the clock customer support
• Convenient online submission
• Thorough peer review
• Inclusion in PubMed and all major indexing services
• Maximum visibility for your research
Submit your manuscript at www.biomedcentral.com/submit