2020 MISO Energy and Peak Demand Forecasting
for System Planning
Prepared by:
Liwei Lu
Fang Wu
Douglas J. Gotham
David G. Nderitu
Timothy A. Phillips
Paul V. Preckel
Marco A. Velástegui
State Utility Forecasting Group
Discovery Park
Purdue University
West Lafayette, Indiana
November 2020
Prepared for:
CONTENTS
Contents
Executive Summary ________________________________________________________________ 1 Introduction ______________________________________________________________________ 3 OVERVIEW _______________________________________________________________________________ 3 REPORT STRUCTURE _______________________________________________________________________ 4 Forecasting Methodology ___________________________________________________________ 5 OVERVIEW _______________________________________________________________________________ 5 STATEWIDE ANNUAL ELECTRIC ENERGY FORECASTS ____________________________________________ 5 CONVERSION OF RETAIL SALES TO METERED LOAD AND BENCHMARKING TO 2019 LEVELS ____________ 5 LRZ ENERGY FORECASTS ___________________________________________________________________ 6 LRZ NON-COINCIDENT MONTHLY PEAK DEMAND FORECASTS _____________________________________ 6 MISO-LEVEL FORECASTS ___________________________________________________________________ 7 DATA SOURCES ___________________________________________________________________________ 7 COVID-19 ________________________________________________________________________________ 8 State-by-State Results ______________________________________________________________ 9 ARKANSAS _______________________________________________________________________________ 9 ILLINOIS ________________________________________________________________________________ 10 INDIANA ________________________________________________________________________________ 11 IOWA ________________________________________________________________________________ 12 KENTUCKY ______________________________________________________________________________ 13 LOUISIANA ______________________________________________________________________________ 15 MICHIGAN ______________________________________________________________________________ 16 MINNESOTA _____________________________________________________________________________ 17 MISSISSIPPI _____________________________________________________________________________ 18 MISSOURI _______________________________________________________________________________ 19 MONTANA ______________________________________________________________________________ 20 NORTH DAKOTA __________________________________________________________________________ 21 SOUTH DAKOTA __________________________________________________________________________ 22 TEXAS ________________________________________________________________________________ 23 WISCONSIN _____________________________________________________________________________ 24 LRZ Forecasts ____________________________________________________________________ 25ANNUAL LRZ ENERGY FORECASTS __________________________________________________________ 25 LRZ NON-COINCIDENT PEAK DEMANDS ______________________________________________________ 27 LRZ FORECASTS _________________________________________________________________________ 29
CONTENTS
LRZ 1 ________________________________________________________________________________ 29 LRZ 2 ________________________________________________________________________________ 30 LRZ 3 ________________________________________________________________________________ 31 LRZ 4 ________________________________________________________________________________ 32 LRZ 5 ________________________________________________________________________________ 33 LRZ 6 ________________________________________________________________________________ 34 LRZ 7 ________________________________________________________________________________ 36 LRZ 8 ________________________________________________________________________________ 37 LRZ 9 ________________________________________________________________________________ 38 LRZ 10 _______________________________________________________________________________ 39 MISO Forecasts __________________________________________________________________ 41MISO ANNUAL ENERGY FORECAST __________________________________________________________ 41 MISO SYSTEM COINCIDENT PEAK DEMAND FORECAST __________________________________________ 42 MISO SYSTEM HIGH AND LOW FORECASTS ___________________________________________________ 44
APPENDIX A State Electric Energy Forecasting Models _________________________________ 45
APPENDIX B Allocation Factors _____________________________________________________ 57
APPENDIX C Peak Demand Models and Forecast Results _______________________________ 61
TABLES
Tables
Table ES-1: State Retail Sales CAGR (2021-2040) (%) ... 1
Table ES-2: LRZ Metered Load CAGR (2021-2040) (%) ... 2
Table ES-3: MISO Annual Energy and July Coincident Peak Demand CAGR (2021-2040) (%) ... 2
Table 1: Data Sources ... 7
Table 2: Arkansas Explanatory Variable CAGR for the Period of 2021-2040 (%) ... 9
Table 3: Arkansas Allocation Factors ... 9
Table 4: Arkansas LRZ Forecast CAGR for the Period of 2021-2040 (%) ... 9
Table 5: Illinois Explanatory Variable CAGR for the Period of 2021-2040 (%) ... 10
Table 6: Illinois Allocation Factors ... 10
Table 7: Illinois LRZ Forecast CAGR for the Period of 2021-2040 (%) ... 10
Table 8: Indiana Explanatory Variable CAGR for the Period of 2021-2040 (%) ... 11
Table 9: Indiana and Kentucky Allocation Factors ... 11
Table 10: Indiana and Kentucky LRZ Forecast CAGR for the Period of 2021-2040 (%) ... 11
Table 11: Iowa Explanatory Variable CAGR for the Period of 2021-2040 (%) ... 12
Table 12: Iowa Allocation Factors ... 12
Table 13: Iowa LRZ Forecast CAGR for the Period of 2021-2040 (%) ... 12
Table 14: Kentucky Explanatory Variable CAGR for the Period of 2021-2040 (%) ... 13
Table 15: Indiana and Kentucky Allocation Factors ... 13
Table 16: Indiana and Kentucky LRZ Forecast CAGR for the Period of 2021-2040 (%) ... 14
Table 17: Louisiana Explanatory Variable CAGR for the Period of 2021-2040 (%) ... 15
Table 18: Louisiana Allocation Factors ... 15
Table 19: Louisiana LRZ Forecast CAGR for the Period of 2021-2040 (%) ... 15
Table 20: Michigan Explanatory Variable CAGR for the Period of 2021-2040 (%) ... 16
Table 21: Michigan Allocation Factors ... 16
Table 22: Michigan LRZ Forecast CAGR for the Period of 2021-2040 (%) ... 16
Table 23: Minnesota Explanatory Variable CAGR for the Period of 2021-2040 (%) ... 17
Table 24: Minnesota Allocation Factors ... 17
Table 25: Minnesota LRZ Forecast CAGR for the Period of 2021-2040 (%) ... 17
Table 26: Mississippi Explanatory Variable CAGR for the Period of 2021-2040 (%) ... 18
Table 27: Mississippi Allocation Factors ... 18
Table 28: Mississippi LRZ Forecast CAGR for the Period of 2021-2040 (%) ... 18
Table 29: Missouri Explanatory Variable CAGR for the Period of 2021-2040 (%) ... 19
Table 30: Missouri Allocation Factors ... 19
TABLES
Table 32: Montana Explanatory Variable CAGR for the Period of 2021-2040 (%) ... 20
Table 33: Montana and North Dakota Allocation Factors ... 20
Table 34: Montana and North Dakota LRZ Forecast CAGR for the Period of 2021-2040 (%) ... 20
Table 35: North Dakota Explanatory Variable CAGR for the Period of 2021-2040 (%) ... 21
Table 36: Montana and North Dakota Allocation Factors ... 21
Table 37: Montana and North Dakota LRZ Forecast CAGR for the Period of 2021-2040 (%) ... 21
Table 38: South Dakota Explanatory Variable CAGR for the Period of 2021-2040 (%) ... 22
Table 39: South Dakota Allocation Factors ... 22
Table 40: South Dakota LRZ Forecast CAGR for the Period of 2021-2040 (%) ... 22
Table 41: Texas Explanatory Variable CAGR for the Period of 2021-2040 (%) ... 23
Table 42: Texas Allocation Factors (%) ... 23
Table 43: Texas LRZ Forecast CAGR for the Period of 2021-2040 (%) ... 23
Table 44: Wisconsin Explanatory Variable CAGR for the Period of 2021-2040 (%) ... 24
Table 45: Wisconsin Allocation Factors ... 24
Table 46: Wisconsin LRZ Forecast CAGR for the Period of 2021-2040 (%) ... 24
Table 47: Gross LRZ Energy Forecasts without EE Adjustments (Annual Metered Load in GWh) ... 25
Table 48: Net LRZ Energy Forecasts with EE Adjustments (Annual Metered Load in GWh) ... 26
Table 49: July Non-Coincident Peak Demand without EE Adjustments (Metered Load in MW) ... 27
Table 50: July Non-Coincident Peak Demand with EE Adjustments (Metered Load in MW) ... 28
Table 51: Gross and Net MISO System Energy (Annual Metered Load in GWh) ... 41
Table 52: MISO Monthly Coincidence Factors ... 42
Table 53: Gross and Net MISO System July Coincident Peak Demand (Metered Load in MW) ... 43
Table 54: Gross MISO System CAGRs for Alternate Forecasts (2021-2040) ... 44
Table 55: Dependent and Explanatory Variables ... 45
Table 56: Explanatory Variable CAGR for the Period of 2021-2040 (%) ... 46
Table 57: Gross State Energy Forecasts (Annual Retail Sales in GWh) ... 47
Table 58: MISO Local Balancing Authorities, 2018 ... 57
Table 59: MISO Load Fraction at State Level (MWh), 2009-2018 ... 58
Table 60: MISO Load Fraction (Average % of State-Level Electricity Sales from 2009 to 2018) ... 58
Table 61: State Level MISO Load Fraction by MISO LRZs ... 59
Table 62: Allocation Factors to Convert State Sales to LRZ Energy Sales ... 60
Table 63: Selected Weather Stations by LRZ, Midwest Regional Climate Center ... 61
Table 64: Normalized July Peak Load Factors and Weather Conditions (Fahrenheit) ... 62
Table 65: Gross January Non-Coincident Peak Demand (Metered Load in MW) ... 63
TABLES
Table 67: Gross March Non-Coincident Peak Demand (Metered Load in MW) ... 65
Table 68: Gross April Non-Coincident Peak Demand (Metered Load in MW) ... 66
Table 69: Gross May Non-Coincident Peak Demand (Metered Load in MW) ... 67
Table 70: Gross June Non-Coincident Peak Demand (Metered Load in MW) ... 68
Table 71: Gross July Non-Coincident Peak Demand (Metered Load in MW) ... 69
Table 72: Gross August Non-Coincident Peak Demand (Metered Load in MW) ... 70
Table 73: Gross September Non-Coincident Peak Demand (Metered Load in MW) ... 71
Table 74: Gross October Non-Coincident Peak Demand (Metered Load in MW) ... 72
Table 75: Gross November Non-Coincident Peak Demand (Metered Load in MW) ... 73
Table 76: Gross December Non-Coincident Peak Demand (Metered Load in MW) ... 74
FIGURES
Figures
Figure 1: MISO 2018 Planning Year LRZ Map ... 3
Figure 2: Process Flow Chart ... 5
Figure 3: Structure and Logic Diagram for Allocation Factors ... 6
Figure 4: Structure and Logic Diagram for Peak Conversion Factors ... 6
Figure 5: Arkansas Energy Forecast (Annual Retail Sales in GWh) ... 9
Figure 6: Illinois Energy Forecasts (Annual Retail Sales in GWh) ... 10
Figure 7: Indiana Energy Forecasts (Annual Retail Sales in GWh) ... 11
Figure 8: Iowa Energy Forecasts (Annual Retail Sales in GWh) ... 12
Figure 9: Kentucky Energy Forecasts (Annual Retail Sales in GWh) ... 13
Figure 10: Louisiana Energy Forecasts (Annual Retail Sales in GWh) ... 15
Figure 11: Michigan Energy Forecasts (Annual Retail Sales in GWh) ... 16
Figure 12: Minnesota Energy Forecasts (Annual Retail Sales in GWh) ... 17
Figure 13: Mississippi Energy Forecasts (Annual Retail Sales in GWh) ... 18
Figure 14: Missouri Energy Forecasts (Annual Retail Sales in GWh) ... 19
Figure 15: Montana Energy Forecasts (Annual Retail Sales in GWh) ... 20
Figure 16: North Dakota Energy Forecasts (Annual Retail Sales in GWh) ... 21
Figure 17: South Dakota Energy Forecasts (Annual Retail Sales in GWh) ... 22
Figure 18: Texas Energy Forecasts (Annual Retail Sales in GWh) ... 23
Figure 19: Wisconsin Energy Forecasts (Annual Retail Sales in GWh) ... 24
Figure 20: Gross and Net LRZ 1 Energy (GWh) ... 29
Figure 21: Gross and Net LRZ 1 July Non-Coincident Peak Demand (MW) ... 30
Figure 22: Gross and Net LRZ 2 Energy (GWh) ... 31
Figure 23: Gross and Net LRZ 2 July Non-Coincident Peak Demand (MW) ... 31
Figure 24: Gross and Net LRZ 3 Energy (GWh) ... 32
Figure 25: Gross and Net LRZ 3 July Non-Coincident Peak Demand (MW) ... 32
Figure 26: Gross and Net LRZ 4 Energy (GWh) ... 33
Figure 27: Gross and Net LRZ 4 July Non-Coincident Peak Demand (MW) ... 33
Figure 28: Gross and Net LRZ 5 Energy (GWh) ... 34
Figure 29: Gross and Net LRZ 5 July Non-Coincident Peak Demand (MW) ... 34
Figure 30: Gross and Net LRZ 6 Energy (GWh) ... 35
Figure 31: Gross and Net LRZ 6 July Non-Coincident Peak Demand (MW) ... 35
FIGURES
Figure 34: Gross and Net LRZ 8 Energy (GWh) ... 37
Figure 35: Gross and Net LRZ 8 July Non-Coincident Peak Demand (MW) ... 38
Figure 36: Gross and Net LRZ 9 Energy (GWh) ... 39
Figure 37: Gross and Net LRZ 9 July Non-Coincident Peak Demand (MW) ... 39
Figure 38: Gross and Net LRZ 10 Energy (GWh) ... 40
Figure 39: Gross and Net LRZ 10 July Non-Coincident Peak Demand (MW) ... 40
Figure 40: Gross and Net MISO System Energy Forecast (Metered Load in GWh) ... 42
Figure 41: Gross and Net MISO System July Coincident Peak Demand (Metered Load in MW) ... 43
EXECUTIVE SUMMARY
EXECUTIVE SUMMARY
This report provides the seventh load forecast the State Utility Forecasting Group (SUFG) has prepared for the Midcontinent Independent System Operator Inc. (MISO). These forecasts project annual energy demand for the ten MISO local resource zones (LRZs) and the MISO system as a whole. Monthly peak loads1 are also forecast at the LRZ and MISO system-wide levels. This forecast does not attempt to replicate the forecasts that are produced by MISO’s load-serving entities (LSEs).
Forecast reports before 2019 included projections on both gross (prior to adjustments for utility energy efficiency and demand response programs) and net (after those adjustments) bases. The energy efficiency/demand response (EE) adjustments were provided by MISO and were developed in the process of developing the annual MISO Transmission Expansion Plan (MTEP). Due to the temporary suspension of the MTEP process last year, no EE adjustments were available. Thus, all projections in the 2019 report were on a gross basis. This year’s report includes both gross and net forecasts.
Econometric models were developed for each state to project annual retail sales of electricity. Forecasts of metered load at the LRZ level were developed by allocating the portion of each state’s sales to the appropriate LRZ and adjusting for distribution system losses, weather and existing EE programs. LRZ monthly peak demand projections were developed using normalized monthly peak conversion factors, which translated annual energy into monthly peak demand based on historical observations assuming normal peak weather conditions. The LRZ monthly peak demand forecasts are on a non-coincident basis.2 MISO system level monthly peak projections were developed from the LRZ monthly peak forecasts using monthly coincidence factors by LRZ.
The state econometric models were developed using publicly available economic data, namely annual electricity sales, prices for electricity and natural gas, personal income, population, employment, gross state product (GSP), and annual cooling and heating degree days. Economic and population projections acquired from IHS Markit (formerly IHS Global Insight) and price projections developed by SUFG were used to produce projections of future retail sales. Weather variables were held constant at their 30-year normal values. Table ES-1 provides the compound annual growth rate (CAGR) for each state energy forecast.
Table ES-1. State Retail Sales CAGR (2021-2040) (%)
STATE AR IL IN IA KY LA MI MN MS MO MT ND SD TX WI CAGR 1.36 0.59 1.30 1.52 1.84 0.74 0.77 0.78 1.44 0.80 1.72 0.92 2.21 1.98 1.02
LRZ level annual energy forecasts were developed by allocating the state energy forecasts to the individual LRZs on a proportional basis. Additionally, adjustments for distribution losses, normal weather and existing EE programs were made to produce a forecast at the metered load level. Table ES-2 provides the CAGR for each LRZ energy forecast.
1 Due to the voluminous nature of including twelve monthly 20-year forecasts for ten LRZs and the MISO system, only a representative month (July) is included in the main body of this report. The monthly forecasts are available in Appendix C.
2 Throughout this report, coincidence is stated in reference to the overall MISO system. Thus, the LRZ peak demand forecasts are for the highest level of demand for that particular LRZ, which would be coincident at the
EXECUTIVE SUMMARY
Table ES-2. LRZ Metered Load CAGR (2021-2040) (%)LRZ 1 2 3 4 5 6 7 8 9 10
Gross 0.93 1.00 1.48 0.59 0.26 1.54 0.77 1.36 1.03 1.44
Net 0.37 0.86 1.37 0.57 0.23 1.38 0.47 1.28 1.01 1.43
LRZ monthly non-coincident peak demand projections were developed using peak conversion factors that are determined from historical relationships between average hourly load for the year, monthly peak levels for the year, and weather conditions at the time of the peak demand. Since these conversion factors are held constant for the forecast period, the gross LRZ monthly peak demand projections have the same growth rates as the energy projections in Table ES-2.3
MISO system-wide energy and peak demand projections were developed from the LRZ-level projections. Since each LRZ does not experience its peak demand at the same time as the others (or as the entire MISO system), the MISO monthly coincident peak demand is less than the arithmetic sum of the individual LRZ monthly non-coincident peak demands. The MISO system monthly non-coincident peak demand is determined by applying monthly coincidence factors to the individual LRZ monthly non-coincident peak demands and summing across LRZs. These monthly coincidence factors represent the ratio of the LRZ’s load at the time of the overall MISO system monthly peak to the LRZ’s monthly non-coincident peak. Since coincidence is not an issue for annual energy, the MISO energy projections are found from the simple sum of the individual LRZs’ energy projections. Table ES-3 provides the compound annual growth rates for the MISO annual energy and July peak demand forecasts. Table ES-3. MISO Annual Energy and July Coincident Peak Demand CAGR (2021-2040) (%)
3 It should be noted that if customer sectors grow at different rates, the assumption that energy and peak demand will grow at the same rate is unlikely to hold true. However, there has been very little long-term change
MISO-System Gross (without EE Adjustments) Net (with EE Adjustments)
Energy 1.04 0.86
INTRODUCTION
INTRODUCTION
This report represents the seventh load forecast the State Utility Forecasting Group (SUFG) has prepared for the Midcontinent Independent System Operator Inc. (MISO). These forecasts project annual energy and monthly peak4 demand for the ten MISO local resource zones (LRZs) and the MISO system as a whole. This forecast does not attempt to replicate the forecasts that are produced by MISO’s load-serving entities (LSEs).
OVERVIEW
The MISO market footprint consists of a number of individual Local Balancing Authorities (LBAs). It covers all or parts of 15 states and is divided into 10 LRZs.5 Figure 1 displays the MISO market footprint at the LRZ level. Figure 1: MISO 2018 Planning Year LRZ Map
Source: MISO, 2018
4 This is the second forecast that includes monthly projections (previous forecasts were done on summer and winter seasonal bases). Due to the voluminous nature of including twelve monthly 20-year forecasts for ten LRZs and the MISO system, only a representative month (July) is included in the body of this report. The monthly forecasts are available in the Appendices.
5 A very small amount of load in Oklahoma and Tennessee is served by MISO LBAs in LRZ 8. Rather than developing individual state econometric models for those states, it is assumed that these loads grow at the rate
INTRODUCTION
Econometric models were developed for each state to project annual retail sales of electricity. Forecasts of metered load at the LRZ level were developed by allocating the portion of each state’s sales to the appropriate LRZ and adjusting for distribution system losses, weather, and existing energy efficiency (EE) programs based on the difference between the estimate of LRZ retail sales from state sales forecasts for the year 2019 and the weather-normalized LRZ metered load for the year 2019. LRZ monthly peak demand projections were developed using normalized monthly peak load conversion factors, which translated annual energy into monthly peak demand based on historical observations assuming normal peak weather conditions. The LRZ peak demand forecasts are on a non-coincident basis,6 which means each zone may reach its zonal peak at a different time. MISO system level projections were developed from the LRZ forecasts. For the MISO-wide peak demands, coincidence factors were used.
REPORT STRUCTURE
In this report, Chapter 2 explains the forecasting methodology and provides data sources. Chapter 3 summarizes state energy projection profiles including descriptions of the state econometric models and the resulting energy forecasts. Chapter 4 covers forecast results by LRZ. Chapter 5 provides MISO system level results. The report contains four appendices. Appendix A provides details of the state energy forecasting models and methodology. Appendix B explains the calculation of allocation factors and the process of allocating the state energy forecasts to LRZ-level forecasts. Appendix C provides the methodology for determining monthly peak demand forecasts and forecast results of monthly peak by LRZ and at the MISO level. Appendix D lists high and low forecasts of energy and peak demand at state, LRZ and MISO levels.
FORECASTING METHODOLOGY
FORECASTING METHODOLOGY
OVERVIEW
This study employed a multi-step approach to forecast annual energy and monthly peak demand at the MISO LRZ and system-wide levels. Econometric models were built for each state to forecast retail sales for a 20‐year period, namely 2021 to 2040. The statewide energy forecasts were then used to construct annual energy forecasts at the LRZ level based on allocation factors. The LRZ annual energy forecasts were used, in turn, to develop monthly non-coincident peak demand projections by LRZ. The LRZ monthly coincident peak projections were estimated from LRZ monthly non-coincident peak demand projections by applying the zonal monthly coincidence factors. MISO system-wide energy and peak forecasts were aggregated from LRZ energy forecast and LRZ coincident peak forecast, respectively. The overall process flow chart is illustrated in Figure 2 below. It shows the five major steps in the process and the key inputs at each step.
Figure 2: Process Flow Chart
STATEWIDE ANNUAL ELECTRIC ENERGY FORECASTS
Econometric models of retail electricity sales were developed for each state using statewide historical data to determine the appropriate drivers of electricity consumption and the statistical relationship between those drivers and energy consumption. SUFG developed numerous possible model specifications for each state and selected the model that had a good fit (significant t-statistics, high R-squared values, and a significant F-statistic), passed the statistical tests (for heteroskedasticity and serial correlation), and had a set of drivers that included at least one driver that was tied to the overall growth in the state (such as employment, population or gross state product). The model formulations by state are provided in Appendix A.
CONVERSION OF RETAIL SALES TO METERED LOAD AND BENCHMARKING TO 2019 LEVELS The state-level forecasts represent annual (calendar year) retail sales (electricity usage at the customer locations). This is driven by data availability, since statewide historical sales are available from the U.S. Department of Energy’s Energy Information Administration (EIA). Since 2019 state electricity sales data were not available at the time this report was prepared, the state sales numbers for that year represent a forecast value that is not adjusted for EE programs. The LRZ-level forecasts are at the metered level (in essence, loads at the
• Weather
• Population
• Employment
• Personal Income
• Gross State Product
• Electricity Price
• Natural Gas Price
State Forecasting Models • State Forecasting Models • Projections of Forecast Drivers Annual State Retail Sales
Forecast • Annual State Retail Sales Forecast • Allocation Factors • Benchmark to 2019 Weather-Normalized LRZ Metered Load LRZ Annual Energy Forecast • LRZ Annual Energy Forecast • LRZ Weather-Normalized Monthly Non-Coincident Peak Load Factors LRZ Monthly Non-Coincident Peak Forecast • LRZ Monthly Non-Coincident Peak Load Forecast
• LRZ Monthly Coincidence Factors
MISO Monthly Peak Forecast
FORECASTING METHODOLOGY
difference between the metered load and the retail sale is caused by losses between the substations and customers.7 Since the historical metered loads at the LRZ-level are known for 2019 (they were provided by MISO), SUFG benchmarked the LRZ-level forecasts to the weather-normalized metered load levels for that year. This benchmarking accomplishes two objectives: it converts the forecast from the retail sales level to the metered load level and it captures savings from EE programs for 2019.
LRZ ENERGY FORECASTS
The LRZ annual energy forecasts were produced after the individual state annual forecasts were developed. This was done by allocating the fraction of each state’s load to the appropriate LBA within that state (herein referred to as the load fraction) and summing across the various LBAs within each LRZ (see Figure 3). Since not all regions within a state experience load growth at the same rate, the load fraction of each state may change over time. The historical load fractions of each state were calculated and used to determine the future allocation factors. Additional adjustments have also been made to account for LBAs that operate in more than one state. In these cases, the market share of the LBA’s load in each state within its service territory has been calculated in
order to determine its load fraction for that state. In addition, distribution losses of each LRZ were incorporated (please refer to section 2.3). After LRZ annual energy forecasts were estimated, the MISO system-wide energy forecast was obtained by summing the LRZ energy forecasts. See Appendix B for additional details on the allocation process.
LRZ NON-COINCIDENT MONTHLY PEAK DEMAND FORECASTS The LRZ non-coincident monthly peak demand forecasts
were estimated based on load factors calculated using historical hourly load data of each LRZ provided by MISO. The structure and logic diagram in Figure 4 illustrate the resources employed in estimating the monthly peak conversion factors. Peak load conversion factors were used to translate annual metered load electricity forecasts at the LRZ level to monthly non-coincident peak demands. These conversion factors were determined from historical relationships between average hourly load for the year, monthly peak levels for the year, and weather conditions at the time of the peak demand. See Appendix C for additional information on the peak demand forecast methodology.
Figure 4: Structure and Logic Diagram for Peak Conversion Factors Allocation Factors EIA State Electricity Sales 861 Form MISO LBAs MISO LRZ Map
Figure 3: Structure and Logic Diagram for Allocation Factors Peak Load Conversion Factors MISO Hourly Load by LRZ Normalized Peak Temperature Peak Load Econometric Model by LRZ
FORECASTING METHODOLOGY
MISO-LEVEL FORECASTSThe LRZ monthly non-coincident peak demand projections were converted to MISO-level monthly coincident peak demands using historical average coincidence factors. The coincidence factor for each LRZ is determined at the time of the MISO system-wide peak demand using the ratio of the LRZ’s demand at the time of the MISO-wide (coincident) peak demand divided by the LRZ’s demand at the time of the LRZ’s individual (non-coincident) peak demand. The MISO system-wide monthly peak demand forecasts were obtained by summing the LRZ monthly coincident peak demands. Since coincidence is not an issue with annual energy, the MISO system-wide annual energy forecast is the arithmetic sum of the LRZ annual energy forecasts.
DATA SOURCES
Historical annual energy sales data and electricity and natural gas prices by state were obtained from EIA. Historical population data by state were obtained from the Census Bureau. Historical macroeconomic data, such as personal income, were obtained from the Bureau of Economic Analysis (BEA); gross state product (GSP) data were obtained from IHS Markit (formerly IHS Global Insight) to avoid inconsistency in BEA data due to a change in industry classification systems; and employment data were obtained from the Bureau of Labor Statistics (BLS). Projections of macroeconomic data and population were retrieved from IHS Markit. Electricity and natural gas price projections were developed by SUFG. Actual monthly heating and cooling degree days on a 65°Fahrenheit basis for all 15 states were obtained from the National Oceanic and Atmospheric Administration (NOAA), and were aggregated to annual data by state. Normal weather by state used in projections were obtained from NOAA. Zonal hourly temperature records were acquired from the Midwest Regional Climate Center (MRCC). Table 1 summarizes data sources used in this study.
Table 1: Data Sources
Data Content Historical Data Source Data Used in Projection Electricity sales GWhs, annual retail electricity sales by state, 1990-2018 EIA N/A
Electricity prices Cents/KWh, 2012$, 1990-2018 EIA* SUFG projection based on EIA data Natural gas prices Dollars/Mcf, 2012$, 1990-2018 EIA* SUFG projection based on EIA data
Real personal income Thousands, 2012$, 1990-2018 BEA* IHS Markit
Population Number of people, 1990-2018 Census Bureau IHS Markit
Manufacturing &
non-manufacturing employment Number of jobs, 1990-2018 BLS IHS Markit
Non-farm employment Number of jobs, 1990-2018 BLS IHS Markit
Gross state product Millions, 2012$, 1990-2018 IHS Markit IHS Markit Cooling degree days (CDDs) Summations of monthly cooling degree days, base 65°F, 1970-2018 NOAA NOAA 30-year normal Heating degree days (HDDs) Summations of monthly heating degree days, base 65°F, 1970-2018 NOAA NOAA 30-year normal Hourly Temperature Historical hourly temperature of selected weather stations,
1997-2019 MRCC
Normal peak temperatures * Original data were in nominal dollars. SUFG converted them to real 2012 dollars using CPI data obtained from BLS.
FORECASTING METHODOLOGY
COVID-19There is considerable uncertainty surrounding the impacts of the COVID-19 pandemic on the demand for electricity, especially in the short term. While this is a long-term forecast, SUFG believes that it is important that the forecast reflect both the near- and long-term impacts. Therefore, SUFG revisited the construction of some of the state econometric models to try to fit explanatory variables that better reflect the short-term impacts. Some variables, such as population and personal income, may be a reasonable driver of long-term usage but perform poorly in reflecting the impact of the pandemic and economic shutdowns. Other variables, such as various types of employment, tend to overstate the pandemic’s impact. Thus, GSP was the first economic variable that was considered during model construction. In some cases, it was not possible to use GSP due to statistical problems, such as serial correlation. In those cases, alternate drivers were used.
In order to best capture the expected long-term impacts, SUFG used the most recent set of economic projections from IHS Markit, while still being able to produce the forecast in a timely manner. The economic projections were collected in June. In general, they project the economy to return to pre-pandemic levels in 2022, with the long-term economic outlook slightly below previous projections, due to economic scarring associated with obsolete capital stock and labor force reductions.
It should be further noted that due to the lower starting point, many of the projections in this report may show higher compound annual growth rates than were reported in the 2019 forecast, despite the forecast levels being lower throughout the forecast period.
STATE BY STATE RESULTS
STATE-BY-STATE RESULTS
ARKANSAS
The Arkansas state econometric model uses real electricity and natural gas prices, real GSP, CDDs, and HDDs as explanatory variables. Appendix A provides data sources and the model specification. The growth rates for the drivers are provided in Table 2.
Table 2: Arkansas Explanatory Variable CAGR for the Period of 2021-2040 (%) Real Electricity Price Real Natural Gas Price Real GSP
0.28 1.15 1.99
Arkansas annual electricity sales are projected to grow at 1.36% in this forecast, which is higher than the 1.00% growth rate projected in the 2019 Forecast. Figure 5 shows Arkansas sales projection for the 2019 and 2020 forecasts.
Figure 5: Arkansas Energy Forecast (Annual Retail Sales in GWh)
Most of Arkansas’s loads are in LRZ 8. A portion of the Arkansas annual energy forecast was allocated to LRZ 8 based on the historical average of the load fractions of the period of 2014 to 2018, as shown in Table 3. See Appendix B for more information on the historical load fractions and the process of developing allocation factors.
Table 3: Arkansas Allocation Factors
LRZ8 Non-MISO
72.40% 27.60%
Annual energy for the LRZs is determined by summing the allocated portions of the appropriate state sales forecasts and benchmarking to the most recent weather normalized metered load energy (as described in Chapter 2). The resulting forecast growth rate for Arkansas’s LRZ is shown in Table 4. Chapter 4 contains more information on LRZ forecasts.
Table 4: Arkansas LRZ Forecast CAGR for the Period of 2021-2040 (%) LRZ Annual Energy8
LRZ8 1.36
STATE BY STATE RESULTS
ILLINOISThe Illinois state econometric model uses real electricity and natural gas prices, real GSP, CDDs and HDDs as explanatory variables. Appendix A provides data sources and the model specification. The growth rates for the drivers are provided in Table 5.
Table 5: Illinois Explanatory Variable CAGR for the Period of 2021-2040 (%)
Real Electricity Price Real Natural Gas Price Real GSP
-0.34 0.68 1.65
Illinois annual electricity sales are projected to grow at 0.59% in this forecast, which is slightly lower than the 0.62% growth rate projected in the 2019 Forecast. Figure 6 shows Illinois sales projection for the 2019 and 2020 forecasts.
Figure 6: Illinois Energy Forecasts (Annual Retail Sales in GWh)
Illinois has loads in LRZ 1, LRZ 3 and LRZ 4, with roughly 2/3 of the state’s loads located outside MISO. The Illinois annual energy forecast was allocated to the three LRZs based on historical average of load fractions for the period of 2014 to 2018, as show in Table 6. See Appendix B for more information on historical load fractions and the process of developing allocation factors.
Table 6: Illinois Allocation Factors
LRZ1 LRZ3 LRZ4 Non-MISO
0.0002% 1.41% 33.26% 65.33%
Annual energy for the LRZs is determined by summing the allocated portions of the appropriate state sales forecasts and benchmarking to the most recent weather normalized metered load energy (as described in Chapter 2). The resulting forecast growth rates for Illinois related LRZs are shown in Table 7. Chapter 4 contains more information on LRZ forecasts.
Table 7: Illinois LRZ Forecast CAGR for the Period of 2021-2040 (%) LRZ Annual Energy
LRZ1 0.93
LRZ3 1.48
STATE BY STATE RESULTS
INDIANAThe Indiana state econometric model uses real electricity price, real GSP, CDDs and HDDs as explanatory variables. Appendix A provides data sources and the model specification. The growth rates for the drivers are provided in Table 8.
Table 8: Indiana Explanatory Variable CAGR for the Period of 2021-2040 (%)
Real Electricity Price Real GSP
-0.34 1.89
Indiana annual electricity sales are projected to grow at 1.30% in this forecast, which is higher than the 1.09% growth rate projected in the 2019 Forecast. Figure 7 shows Indiana sales projections for the 2019 and 2020 forecasts. The 2020 forecast lies slightly below the 2019 forecast due to a lower forecast value for the year 2020 caused by the COVID-19 pandemic.
Figure 7: Indiana Energy Forecasts (Annual Retail Sales in GWh)
Most of Indiana’s loads are in LRZ 6. Per the request of MISO staff and due to concerns over providing utility-specific information in states that only have a single MISO utility, the load fraction of Indiana and Kentucky are combined (IN+KY). IN+KY forecasts are allocated to LRZ 6 based on the historical average of the load fractions for the period of 2014 to 2018, as shown in Table 9. See Appendix B for more information on historical load fractions and the process of developing allocation factors.
The shutdown of the Paducah Gaseous Diffusion Plant (PGDP) in Kentucky in 2013 caused a significant shift in the historical MISO share in IN+KY. Because the 2014 to 2018 values reflect the MISO shares in LRZ 6 after the complete shutdown of the plant, the future allocation factor is held constant at the average of those values. Table 9: Indiana and Kentucky Allocation Factors
LRZ6 Non-MISO
51.08% 48.92%
Annual energy for the LRZs is determined by summing the allocated portions of the appropriate state sales forecasts and benchmarking to the most recent weather normalized metered load energy (as described in Chapter 2). The resulting forecast growth rate of LRZ 6 is shown in Table 10. Chapter 4 contains more information on LRZ forecasts.
Table 10: Indiana and Kentucky LRZ Forecast CAGR for the Period of 2021-2040 (%) LRZ Annual Energy
STATE BY STATE RESULTS
IOWAThe Iowa state econometric model uses real electricity price, real GSP, and CDDs as explanatory variables. Appendix A provides data sources and the model specification. The growth rates for the drivers are provided in Table 11.
Table 11: Iowa Explanatory Variable CAGR for the Period of 2021-2040 (%)
Real Electricity Price Real GSP
-0.46 2.06
Iowa annual electricity sales are projected to grow at 1.52% in this forecast, which is lower than the 1.75% growth rate projected in the 2019 Forecast. Figure 8 shows sales projection for the 2019 and 2020 forecasts.
Figure 8: Iowa Energy Forecasts (Annual Retail Sales in GWh)
Iowa has loads in LRZ 1 and LRZ 3. The Iowa annual energy forecast was allocated to the two LRZs based on the historical average of the load fractions for the period of 2014 to 2018, as shown in Table 12. See Appendix B for more information on the historical load fractions and the process of developing allocation factors.
Table 12: Iowa Allocation Factors
LRZ1 LRZ3 Non-MISO
1.80% 91.04% 7.16%
Annual energy for the LRZs is determined by summing the allocated portions of the appropriate state sales forecasts and benchmarking to the most recent weather normalized metered load energy (as described in Chapter 2). The resulting forecast growth rates for Iowa’s LRZs are shown in Table 13. Chapter 4 contains more information on LRZ forecasts.
Table 13: Iowa LRZ Forecast CAGRfor the Period of 2021-2040 (%) LRZ Annual Energy
LRZ1 0.93 LRZ3 1.48
STATE BY STATE RESULTS
KENTUCKYThe Kentucky state econometric model uses real electricity and natural gas prices, real GSP, CDDs and HDDs as explanatory variables. Appendix A provides data sources and the model specification. The growth rates for the drivers are provided in Table 14.
Table 14: Kentucky Explanatory Variable CAGR for the Period of 2021-2040 (%) Real Electricity Price Real Natural Gas Price Real GSP
-0.36 0.77 1.91
For the state of Kentucky, SUFG observed a dramatic drop in electricity sales occurred starting in 2013. This was caused by the closure of the PGDP in mid-2013, which represented a 3 GW load on the Tennessee Valley Authority system and accounted for more than 10% of the state’s retail sales. With this large drop in load, SUFG could not fit an econometric model for the state. Therefore, the 2013 and subsequent years historical load were adjusted up to what it would have been if the PGDP had operated at its full capacity. SUFG then developed the econometric model with the adjusted electricity load and used the model to produce a load forecast for the state of Kentucky. The PGDP load was then subtracted from the forecast load derived from the econometric model to serve as the final state load forecast for Kentucky. Kentucky electricity sales are projected to grow at 1.84% in this forecast, which is higher than the 0.91% growth rate projected in the 2019 Forecast. Figure 9 shows Kentucky sales projection for the 2019 and 2020 forecasts.
Figure 9: Kentucky Energy Forecasts (Annual Retail Sales in GWh)
Only a small portion of Kentucky’s loads are in LRZ 6, with most of the loads occurring outside of MISO. Per the request of MISO staff and due to concerns over providing utility-specific information in states that only have a single MISO utility, the load fraction of Indiana and Kentucky are combined (IN+KY). IN+KY forecasts were allocated to LRZ 6 based on the historical average of the load fractions for the period of 2014 to 2018, as shown in Table 15. See Appendix B for more information on historical load fractions and the process of developing allocation factors.
The shutdown of the PGDP in Kentucky in 2013 caused a significant shift in the historical MISO share in IN+KY. Because the 2014 to 2018 values reflect the MISO shares in LRZ 6 after the complete shutdown of the plant, the future allocation factor is held constant at the average of those values.
Table 15: Indiana and Kentucky Allocation Factors
LRZ6 Non-MISO
STATE BY STATE RESULTS
Annual energy for the LRZs is determined by summing the allocated portions of the appropriate state sales forecasts and benchmarking to the most recent weather normalized metered load energy (as described in Chapter 2). The resulting forecast growth rate for Indiana and Kentucky’s LRZ is shown in Table 16. Chapter 4 contains more information on LRZ forecasts.
Table 16: Indiana and Kentucky LRZ Forecast CAGR for the Period of 2021-2040 (%) LRZ Annual Energy
STATE BY STATE RESULTS
LOUISIANAThe Louisiana state econometric model uses real electricity and natural gas prices, real GSP excluding the mining sector, CDDs and HDDs as explanatory variables. Appendix A provides data sources and the model specification. The growth rates for the drivers are provided in Table 17.
Table 17: Louisiana Explanatory Variable CAGR for the Period of 2021-2040 (%)
Real Electricity Price Real Natural Gas Price Real GSP Excluding Mining Sector
0.28 1.47 1.77
Louisiana annual electricity sales are projected to grow at 0.74% in this forecast, which is higher than the 0.59% growth rate projected in the 2019 Forecast. Figure 10 shows Louisiana sales projections for the 2019 and 2020 forecasts.
Figure 10: Louisiana Energy Forecasts (Annual Retail Sales in GWh)
Most of Louisiana’s loads are in LRZ 9. The Louisiana annual energy forecast was allocated to LRZ 9 based on the historical average of the load fractions for the period of 2014 to 2018, as shown in Table 18. See Appendix B for more information on historical load fractions and the process of developing allocation factors.
Table 18: Louisiana Allocation Factors
LRZ9 Non-MISO
92.74% 7.26%
Annual energy for the LRZs is determined by summing the allocated portions of the appropriate state sales forecasts and benchmarking to the most recent weather normalized metered load energy (as described in Chapter 2). The resulting forecast growth rate for Louisiana’s LRZ is shown in Table 19. Chapter 4 contains more information on LRZ forecasts.
Table 19: Louisiana LRZ Forecast CAGR for the Period of 2021-2040 (%) LRZ Annual Energy
STATE BY STATE RESULTS
MICHIGANThe Michigan state econometric model uses real electricity and natural gas prices, real GSP, and CDDs as explanatory variables. Appendix A provides data sources and the model specification. The growth rates for the drivers are provided in Table 20.
Table 20: Michigan Explanatory Variable CAGR for the Period of 2021-2040 (%) Real Electricity Price Real Natural Gas Price Real GSP
-0.34 0.67 1.64
Michigan annual electricity sales are projected to grow at 0.77% in this forecast, which is slightly lower than the 0.87% growth rate projected in the 2019 Forecast. Figure 11 shows sales projections for the 2019 and 2020 forecasts.
Figure 11: Michigan Energy Forecasts (Annual Retail Sales in GWh)
Michigan has loads in LRZ 1, LRZ 2 and LRZ 7. The Michigan forecast was allocated to the three LRZs based on the historical average of the load fractions for the period of 2014 to 2018, as shown in Table 21. See Appendix B for more information on historical load fractions and the process of developing allocation factors.
Table 21: Michigan Allocation Factors
LRZ1 LRZ2 LRZ7 Non-MISO
0.13% 4.55% 91.42% 3.89%
Annual energy for the LRZs is determined by summing the allocated portions of the appropriate state sales forecasts and benchmarking to the most recent weather normalized metered load energy (as described in Chapter 2). The resulting forecast growth rates for Michigan’s LRZs are shown in Table 22. Chapter 4 contains more information on LRZ forecasts.
Table 22: Michigan LRZ Forecast CAGR for the Period of 2021-2040 (%) LRZ Annual Energy
LRZ1 0.93
LRZ2 1.00
STATE BY STATE RESULTS
MINNESOTAThe Minnesota state econometric model uses real electricity price, population, CDDs and HDDs as explanatory variables. Appendix A provides data sources and the model specification. The growth rates for the drivers are provided in Table 23.
Table 23: Minnesota Explanatory Variable CAGR for the Period of 2021-2040 (%) Real Electricity Price Population
-0.48 0.39
Minnesota annual electricity sales are projected to grow at 0.78% in this forecast, which is slightly lower than the 0.82% growth rate projected in the 2019 Forecast. Figure 12 shows electricity sales projection for the 2019 and 2020 forecasts.
Figure 12: Minnesota Energy Forecasts (Annual Retail Sales in GWh)
Minnesota has loads in LRZ 1 and LRZ 3. The Minnesota forecast was allocated to the two LRZs based on the historical average of the load fractions of 2016 to 2018, as shown in Table 24. See Appendix B for more information on historical load fractions and the process of developing allocation factors.
Minnesota’s allocation factor in LRZ3 dropped dramatically from previous years in 2016 because the Interstate Power and Light Co stopped selling power to Minnesota beginning in 2016. Therefore, the future allocation factor is held constant at the average of the load fractions of 2016 to 2018 to reflect the recent situation.
Table 24: Minnesota Allocation Factors
LRZ1 LRZ3 Non-MISO
97.79% 0.92% 1.28%
Annual energy for the LRZs is determined by summing the allocated portions of the appropriate state sales forecasts and benchmarking to the most recent weather normalized metered load energy (as described in Chapter 2). The resulting forecast growth rates for Minnesota’s LRZs are shown in Table 25. Chapter 4 contains more information on LRZ forecasts.
Table 25: Minnesota LRZ Forecast CAGR for the Period of 2021-2040 (%) LRZ Annual Energy
LRZ1 0.93
STATE BY STATE RESULTS
MISSISSIPPIThe Mississippi state econometric model uses real electricity price, real personal income, real GSP, CDDs and HDDs as explanatory variables. Appendix A provides data sources and the model specification. The growth rates for the drivers are provided in Table 26.
Table 26: Mississippi Explanatory Variable CAGR for the Period of 2021-2040 (%) Real Electricity Price Real Personal Income Real GSP
-0.36 1.75 1.94
Mississippi annual electricity sales are projected to grow at 1.44% in this forecast, which is very close to the 1.41% growth rate projected in the 2019 Forecast. Figure 13 shows sales projections for the 2019 and 2020 forecasts. The 2020 Forecast lies slightly below the 2019 Forecast due to a lower starting point.
Figure 13: Mississippi Energy Forecasts (Annual Retail Sales in GWh)
Almost half of Mississippi’s load is in LRZ 10. The Mississippi forecast was allocated to LRZ 10 based on the historical average of the load fractions of the period of 2014 to 2018, as shown in Table 27. See Appendix B for more information on historical load fractions and the process of developing allocation factors.
Table 27: Mississippi Allocation Factors
LRZ10 Non-MISO
44.61% 55.39%
Annual energy for the LRZs is determined by summing the allocated portions of the appropriate state sales forecasts and benchmarking to the most recent weather normalized metered load energy (as described in Chapter 2). The resulting forecast growth rate for Mississippi’s LRZ is shown in Table 28. Chapter 4 contains more information on LRZ forecasts.
Table 28: Mississippi LRZ Forecast CAGR for the Period of 2021-2040 (%) LRZ Annual Energy
STATE BY STATE RESULTS
MISSOURIThe Missouri state econometric model uses real electricity price, population, and CDDs as explanatory variables. Appendix A provides data sources and the model specification. The growth rates for the drivers are provided in Table 29.
Table 29: Missouri Explanatory Variable CAGR for the Period of 2021-2040 (%)
Real Electricity Price Population
-0.48 0.25
Missouri annual electricity sales are projected to grow at 0.80% in this forecast, which is lower than the 0.95% growth rate projected in the 2019 Forecast. Figure 14 shows sales projections for the 2019 and 2020 forecasts. Figure 14: Missouri Energy Forecasts (Annual Retail Sales in GWh)
Missouri has loads in LRZ 5 and LRZ 8. The Missouri forecast was allocated to the two LRZs based on the trend of historical load fractions, as shown in Table 30. Based on the projections of the values from the model drivers for the state of Missouri and for the St. Louis metropolitan statistical area from IHS Markit, the non-MISO region is projected to grow faster than the MISO region. Therefore, the allocation factor for LRZ 5 is reduced from 45.97% in 2019 to 41.01% in 2040. See Appendix B for more information on historical load fractions and the process of developing allocation factors. Table 30: Missouri Allocation Factors
LRZ5 LRZ8 Non-MISO
Reduced from 45.97% in 2019 to 41.01% in 2040 0.02% Change accordingly
Annual energy for the LRZs is determined by summing the allocated portions of the appropriate state sales forecasts and benchmarking to the most recent weather normalized metered load energy (as described in Chapter 2). The resulting forecast growth rates for Missouri’s LRZs are shown in Table 31. Chapter 4 contains more information on LRZ forecasts.
Table 31: Missouri LRZ Forecast CAGR for the Period of 2021-2040 (%) LRZ Annual Energy
LRZ5 0.26
STATE BY STATE RESULTS
MONTANAThe Montana state econometric model uses real electricity and natural gas prices, real personal income per capita, manufacturing employment, CDDs and HDDs as explanatory variables. Appendix A provides data sources and the model specification. The growth rates for the drivers are provided in Table 32.
Table 32: Montana Explanatory Variable CAGR for the Period of 2021-2040 (%)
Real Electricity Price Real Natural Gas Price Real Income/Population Manufacturing Employment
0.004 1.17 1.80 0.31
Montana annual electricity sales are projected to grow at 1.72% in this forecast, which is slightly higher than the 1.68% growth rate projected in the 2019 Forecast. However, the 2020 Forecast is generally lower than the 2019 Forecast due to a lower forecast value for the year 2020. Figure 15 shows sales projections for the 2019 and 2020 forecasts.
Figure 15: Montana Energy Forecasts (Annual Retail Sales in GWh)
A small portion of Montana’s loads is located in LRZ 1, with the remainder outside MISO. Per the request of MISO staff and due to concerns over providing utility-specific information in states that only have a single MISO utility, the load fractions of Montana and North Dakota are combined (MT+ND). The MT+ND forecasts were allocated to LRZ 1 based on the load fraction of 2017 and 2018, as shown in Table 33. See Appendix B for more information on historical load fractions and the process of developing allocation factors.
Table 33: Montana and North Dakota Allocation Factors
LRZ1 Non-MISO
33.03% 66.97%
Annual energy for the LRZs is determined by summing the allocated portions of the appropriate state sales forecasts and benchmarking to the most recent weather normalized metered load energy (as described in Chapter 2). The resulting forecast growth rate for Montana’s LRZ is shown in Table 34. Chapter 4 contains more information on LRZ forecasts.
Table 34: Montana and North Dakota LRZ Forecast CAGR for the Period of 2021-2040 (%) LRZ Annual Energy
STATE BY STATE RESULTS
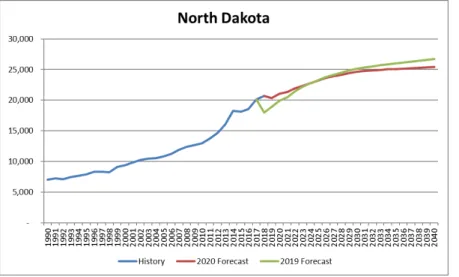
NORTH DAKOTAThe North Dakota state econometric model uses real electricity price, population, and HDDs as explanatory variables. Appendix A provides data sources and the model specification. The growth rates for the drivers are provided in Table 35.
Table 35: North Dakota Explanatory Variable CAGR for the Period of 2021-2040 (%) Real Electricity Price Population
-0.49 0.20
North Dakota annual electricity sales are projected to grow at 0.92% in this forecast, which is lower than the 1.54% growth rate projected in the 2019 Forecast. Figure 16 shows sales projection for the 2019 and 2020 forecasts.
Figure 16: North Dakota Energy Forecasts (Annual Retail Sales in GWh)
North Dakota has loads located in LRZ 1. Per the request of MISO staff and due to concerns over providing utility-specific information in states that only have a single MISO utility, the load fraction of Montana and North Dakota are combined (MT+ND). The MT+ND forecast was allocated to LRZ 1 based on the load fraction of 2017 and 2018, as shown in Table 36. See Appendix B for more information on historical load fractions and the process of developing allocation factors.
Table 36: Montana and North Dakota Allocation Factors
LRZ1 Non-MISO
33.03% 66.97%
Annual energy for the LRZs is determined by summing the allocated portions of the appropriate state sales forecasts and benchmarking to the most recent weather normalized metered load energy (as described in Chapter 2). The resulting forecast growth rate for North Dakota’s LRZ is shown in Table 37. Chapter 4 contains more information on LRZ forecasts.
Table 37: Montana and North Dakota LRZ Forecast CAGR for the Period of 2021-2040 (%) LRZ Annual Energy
STATE BY STATE RESULTS
SOUTH DAKOTAThe South Dakota state econometric model uses real electricity price, real GSP, CDDs and HDDs as explanatory variables. Appendix A provides data sources and the model specification. The growth rates for the drivers are provided in Table 38.
Table 38: South Dakota Explanatory Variable CAGR for the Period of 2021-2040 (%)
Real Electricity Price Real GSP
-0.48 2.07
South Dakota electricity sales are projected to grow at 2.21% in this forecast, which is higher than the 1.68% growth rate projected in the 2019 Forecast. Figure 17 shows the sales projections for the 2019 and 2020 forecasts.
Figure 17: South Dakota Energy Forecasts (Annual Retail Sales in GWh)
South Dakota has loads in LRZ 1 and LRZ 3. The South Dakota sales forecast was allocated to the two LRZs based on the historical average of the load fractions of the period of 2014-2018, as shown in Table 39. See Appendix B for more information on historical load fractions and the process of developing allocation factors.
Table 39: South Dakota Allocation Factors
LRZ1 LRZ3 Non-MISO
23.74% 1.82% 74.44%
Annual energy for the LRZs is determined by summing the allocated portions of the appropriate state sales forecasts and benchmarking to the most recent weather normalized metered load energy (as described in Chapter 2). The resulting forecast growth rates for South Dakota’s LRZs are shown in Table 40. Chapter 4 contains more information on LRZ forecasts.
Table 40: South Dakota LRZ Forecast CAGR for the Period of 2021-2040 (%) LRZ Annual Energy
LRZ1 0.93
STATE BY STATE RESULTS
TEXASThe Texas state econometric model uses real electricity price, real GSP, CDDs and HDDs as explanatory variables. Appendix A provides data sources and the model specification. The growth rates for the drivers are provided in Table 41.
Table 41: Texas Explanatory Variable CAGR for the Period of 2021-2040 (%)
Real Electricity Price Real GSP
0.27 3.10
Texas annual electricity sales are projected to grow at 1.98% in this forecast, which is higher than the 1.67% growth rate projected in the 2019 Forecast. Figure 18 shows sales projections for the 2019 and 2020 forecasts. Figure 18: Texas Energy Forecasts (Annual Retail Sales in GWh)
Texas has loads in LRZ 8 and LRZ 9. The Texas sales forecast was allocated to the two LRZs based on the historical average of the load fractions of the period of 2014-2018, as shown in Table 42. See Appendix B for more information on historical load fractions and the process of developing allocation factors.
Table 42: Texas Allocation Factors (%)
LRZ8 LRZ9 Non-MISO
0.0054% 5.51% 94.48%
Annual energy for the LRZs is determined by summing the allocated portions of the appropriate state sales forecasts and benchmarking to the most recent weather normalized metered load energy (as described in Chapter 2). The resulting forecast growth rates for Texas’s LRZs are shown in Table 43. Chapter 4 contains more information on LRZ forecasts.
Table 43: Texas LRZ Forecast CAGR for the Period of 2021-2040 (%) LRZ Annual Energy
LRZ8 1.36
STATE BY STATE RESULTS
WISCONSINThe Wisconsin state econometric model uses real electricity and natural gas prices, real GSP, CDDs and HDDs as explanatory variables. Appendix A provides data sources and the model specification. The growth rates for the drivers are provided in Table 44.
Table 44: Wisconsin Explanatory Variable CAGR for the Period of 2021-2040 (%) Real Electricity Price Real Natural Gas Price Real GSP
-0.35 0.70 1.77
Wisconsin annual electricity sales are projected to grow at 1.02% in this forecast, which is very close to the 1.01% growth rate projected in the 2019 Forecast. Figure 19 shows sales projections for the 2019 and 2020 forecasts. Despite having nearly identical growth rates, the 2020 Forecast is noticeably lower than the 2019 Forecast due to having a lower starting point because of COVID-19.
Figure 19: Wisconsin Energy Forecasts (Annual Retail Sales in GWh)
Wisconsin has loads in LRZ 1 and LRZ 2. Unlike other MISO states, Wisconsin has no non-MISO loads. The Wisconsin sales forecast was allocated to the two LRZs based on the historical average of the load fractions of the period of 2014-2018, as shown in the Table 45. See Appendix B for more information on historical load fractions and the process of developing allocation factors.
Table 45: Wisconsin Allocation Factors
LRZ1 LRZ2 Non-MISO
17.01% 82.99% 0.00%
Annual energy for the LRZs is determined by summing the allocated portions of the appropriate state sales forecasts and benchmarking to the most recent weather normalized metered load energy (as described in Chapter 2). The resulting forecast growth rates for Wisconsin’s LRZs are shown in Table 46. Chapter 4 contains more information on LRZ forecasts.
Table 46: Wisconsin LRZ Forecast CAGR for the Period of 2021-2040 (%) LRZ Annual Energy
LRZ1 0.93
LRZ FORECASTS
LRZ FORECASTS
ANNUAL LRZ ENERGY FORECASTS
Table 47 and Table 48 provide LRZ annual metered load forecasts on both gross and net bases. The EE adjustments were provided by MISO and were developed in the process of developing the annual MISO Transmission Expansion Plan (MTEP).
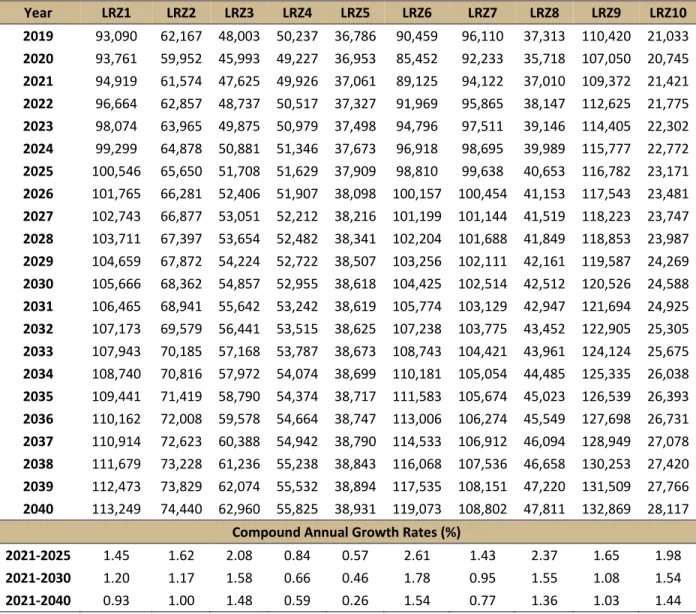
Table 47: Gross LRZ Energy Forecasts without EE Adjustments (Annual Metered Load in GWh)
Year LRZ1 LRZ2 LRZ3 LRZ4 LRZ5 LRZ6 LRZ7 LRZ8 LRZ9 LRZ10 2019 93,090 62,167 48,003 50,237 36,786 90,459 96,110 37,313 110,420 21,033 2020 93,761 59,952 45,993 49,227 36,953 85,452 92,233 35,718 107,050 20,745 2021 94,919 61,574 47,625 49,926 37,061 89,125 94,122 37,010 109,372 21,421 2022 96,664 62,857 48,737 50,517 37,327 91,969 95,865 38,147 112,625 21,775 2023 98,074 63,965 49,875 50,979 37,498 94,796 97,511 39,146 114,405 22,302 2024 99,299 64,878 50,881 51,346 37,673 96,918 98,695 39,989 115,777 22,772 2025 100,546 65,650 51,708 51,629 37,909 98,810 99,638 40,653 116,782 23,171 2026 101,765 66,281 52,406 51,907 38,098 100,157 100,454 41,153 117,543 23,481 2027 102,743 66,877 53,051 52,212 38,216 101,199 101,144 41,519 118,223 23,747 2028 103,711 67,397 53,654 52,482 38,341 102,204 101,688 41,849 118,853 23,987 2029 104,659 67,872 54,224 52,722 38,507 103,256 102,111 42,161 119,587 24,269 2030 105,666 68,362 54,857 52,955 38,618 104,425 102,514 42,512 120,526 24,588 2031 106,465 68,941 55,642 53,242 38,619 105,774 103,129 42,947 121,694 24,925 2032 107,173 69,579 56,441 53,515 38,625 107,238 103,775 43,452 122,905 25,305 2033 107,943 70,185 57,168 53,787 38,673 108,743 104,421 43,961 124,124 25,675 2034 108,740 70,816 57,972 54,074 38,699 110,181 105,054 44,485 125,335 26,038 2035 109,441 71,419 58,790 54,374 38,717 111,583 105,674 45,023 126,539 26,393 2036 110,162 72,008 59,578 54,664 38,747 113,006 106,274 45,549 127,698 26,731 2037 110,914 72,623 60,388 54,942 38,790 114,533 106,912 46,094 128,949 27,078 2038 111,679 73,228 61,236 55,238 38,843 116,068 107,536 46,658 130,253 27,420 2039 112,473 73,829 62,074 55,532 38,894 117,535 108,151 47,220 131,509 27,766 2040 113,249 74,440 62,960 55,825 38,931 119,073 108,802 47,811 132,869 28,117
Compound Annual Growth Rates (%)
2021-2025 1.45 1.62 2.08 0.84 0.57 2.61 1.43 2.37 1.65 1.98
2021-2030 1.20 1.17 1.58 0.66 0.46 1.78 0.95 1.55 1.08 1.54
LRZ FORECASTS
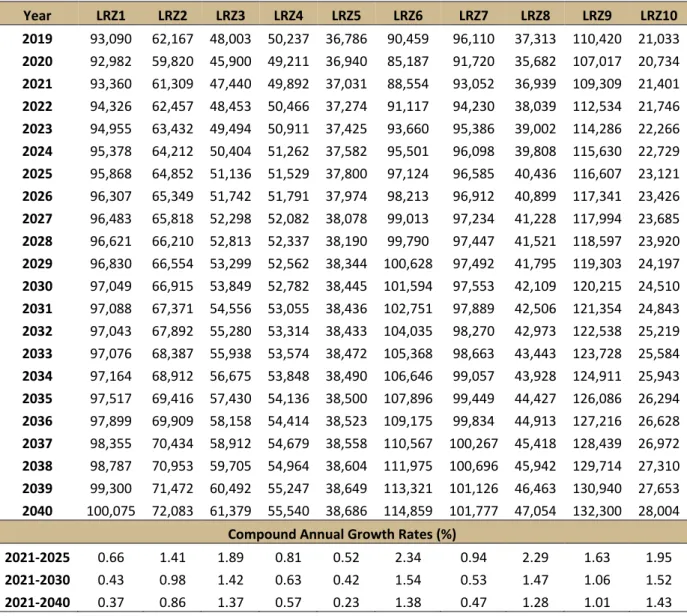
Table 48: Net LRZ Energy Forecasts with EE Adjustments (Annual Metered Load in GWh)
Year LRZ1 LRZ2 LRZ3 LRZ4 LRZ5 LRZ6 LRZ7 LRZ8 LRZ9 LRZ10 2019 93,090 62,167 48,003 50,237 36,786 90,459 96,110 37,313 110,420 21,033 2020 92,982 59,820 45,900 49,211 36,940 85,187 91,720 35,682 107,017 20,734 2021 93,360 61,309 47,440 49,892 37,031 88,554 93,052 36,939 109,309 21,401 2022 94,326 62,457 48,453 50,466 37,274 91,117 94,230 38,039 112,534 21,746 2023 94,955 63,432 49,494 50,911 37,425 93,660 95,386 39,002 114,286 22,266 2024 95,378 64,212 50,404 51,262 37,582 95,501 96,098 39,808 115,630 22,729 2025 95,868 64,852 51,136 51,529 37,800 97,124 96,585 40,436 116,607 23,121 2026 96,307 65,349 51,742 51,791 37,974 98,213 96,912 40,899 117,341 23,426 2027 96,483 65,818 52,298 52,082 38,078 99,013 97,234 41,228 117,994 23,685 2028 96,621 66,210 52,813 52,337 38,190 99,790 97,447 41,521 118,597 23,920 2029 96,830 66,554 53,299 52,562 38,344 100,628 97,492 41,795 119,303 24,197 2030 97,049 66,915 53,849 52,782 38,445 101,594 97,553 42,109 120,215 24,510 2031 97,088 67,371 54,556 53,055 38,436 102,751 97,889 42,506 121,354 24,843 2032 97,043 67,892 55,280 53,314 38,433 104,035 98,270 42,973 122,538 25,219 2033 97,076 68,387 55,938 53,574 38,472 105,368 98,663 43,443 123,728 25,584 2034 97,164 68,912 56,675 53,848 38,490 106,646 99,057 43,928 124,911 25,943 2035 97,517 69,416 57,430 54,136 38,500 107,896 99,449 44,427 126,086 26,294 2036 97,899 69,909 58,158 54,414 38,523 109,175 99,834 44,913 127,216 26,628 2037 98,355 70,434 58,912 54,679 38,558 110,567 100,267 45,418 128,439 26,972 2038 98,787 70,953 59,705 54,964 38,604 111,975 100,696 45,942 129,714 27,310 2039 99,300 71,472 60,492 55,247 38,649 113,321 101,126 46,463 130,940 27,653 2040 100,075 72,083 61,379 55,540 38,686 114,859 101,777 47,054 132,300 28,004
Compound Annual Growth Rates (%)
2021-2025 0.66 1.41 1.89 0.81 0.52 2.34 0.94 2.29 1.63 1.95
2021-2030 0.43 0.98 1.42 0.63 0.42 1.54 0.53 1.47 1.06 1.52
LRZ FORECASTS
LRZ NON-COINCIDENT PEAK DEMANDS
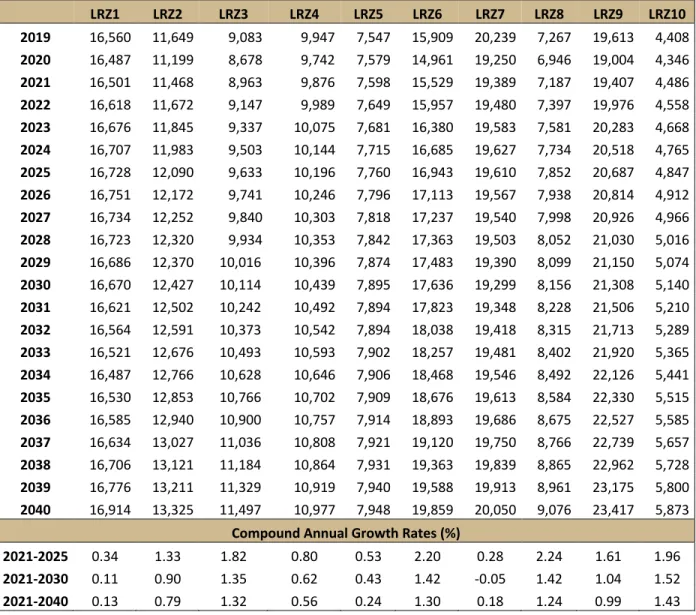
The LRZ-level monthly non-coincident9 peak demands were calculated by applying the monthly energy-to-peak conversion factors to the LRZ annual metered load projections. These values represent the projected monthly peak demands under normal weather conditions. Usually, the non-coincident peak of each LRZ does not occur at the same time when MISO reaches system-wide peak. Table 49 and Table 50 show July non-coincident peak demand projections by LRZ without and with EE adjustments. Monthly peak projections for each one of the twelve months are included in Appendix C.
Table 49: July Non-Coincident Peak Demand without EE Adjustments (Metered Load in MW)
LRZ1 LRZ2 LRZ3 LRZ4 LRZ5 LRZ6 LRZ7 LRZ8 LRZ9 LRZ10 2019 16,560 11,649 9,083 9,947 7,547 15,909 20,239 7,267 19,613 4,408 2020 16,679 11,234 8,703 9,747 7,581 15,028 19,423 6,957 19,014 4,347 2021 16,885 11,538 9,011 9,885 7,603 15,674 19,821 7,208 19,427 4,489 2022 17,196 11,779 9,222 10,002 7,658 16,175 20,188 7,430 20,005 4,563 2023 17,447 11,986 9,437 10,094 7,693 16,672 20,534 7,624 20,321 4,674 2024 17,665 12,157 9,627 10,166 7,729 17,045 20,784 7,788 20,564 4,772 2025 17,886 12,302 9,784 10,222 7,777 17,378 20,982 7,918 20,743 4,856 2026 18,103 12,420 9,916 10,277 7,816 17,615 21,154 8,015 20,878 4,921 2027 18,277 12,532 10,038 10,338 7,840 17,798 21,299 8,086 20,999 4,976 2028 18,449 12,629 10,152 10,391 7,866 17,975 21,414 8,151 21,111 5,027 2029 18,618 12,718 10,260 10,439 7,900 18,160 21,503 8,211 21,241 5,086 2030 18,797 12,810 10,380 10,485 7,923 18,365 21,588 8,280 21,408 5,153 2031 18,939 12,919 10,528 10,542 7,923 18,603 21,717 8,365 21,615 5,223 2032 19,065 13,038 10,679 10,596 7,924 18,860 21,853 8,463 21,831 5,303 2033 19,202 13,152 10,817 10,650 7,934 19,125 21,989 8,562 22,047 5,381 2034 19,344 13,270 10,969 10,706 7,939 19,377 22,123 8,664 22,262 5,457 2035 19,469 13,383 11,124 10,766 7,943 19,624 22,253 8,769 22,476 5,531 2036 19,597 13,493 11,273 10,823 7,949 19,874 22,380 8,871 22,682 5,602 2037 19,731 13,609 11,426 10,878 7,958 20,143 22,514 8,978 22,904 5,675 2038 19,867 13,722 11,587 10,937 7,969 20,413 22,645 9,087 23,136 5,746 2039 20,008 13,834 11,745 10,995 7,979 20,671 22,775 9,197 23,359 5,819 2040 20,146 13,949 11,913 11,053 7,987 20,941 22,912 9,312 23,600 5,892
Compound Annual Growth Rates (%)
2021-2025 1.45 1.62 2.08 0.84 0.57 2.61 1.43 2.37 1.65 1.98
2021-2030 1.20 1.17 1.58 0.66 0.46 1.78 0.95 1.55 1.08 1.54
2021-2040 0.93 1.00 1.48 0.59 0.26 1.54 0.77 1.36 1.03 1.44