COMMONWEALTH COMPETITIVE NEUTRALITY COMPLAINTS OFFICE
Rate of Return Issues
CCNCO Research Paper
ii
Commonwealth of Australia 1998 ISBN 0 646 33581 2
This work is subject to copyright. Apart from any use as permitted under the Copyright Act 1968, the work may be reproduced in whole or in part for study or training purposes, subject to the inclusion of an acknowledgment of the source. Reproduction for commercial use or sale requires prior written permission from AusInfo. Requests and inquiries concerning reproduction and rights should be addressed to the Manager, Legislative Services, AusInfo, GPO Box 1920, Canberra, ACT, 2601.
Enquiries: Stuart Wilson
Commonwealth Competitive Neutrality Complaints Office Locked Bag 3353
Belconnen ACT 2617
Phone: (02) 6240 3317
Fax: (02) 6253 0049
http://www.ccnco.gov.au
An appropriate citation for this paper is:
Commonwealth Competitive Neutrality Complaints Office (CCNCO) 1998, Rate of Return Issues, CCNCO Research Paper, Productivity Commission, Canberra, December.
The Commonwealth Competitive Neutrality Complaints Office
The Commonwealth Competitive Neutrality Complaints Office is an autonomous unit within the Productivity Commission. It was established under the Productivity Commission Act 1998 to receive complaints, undertake complaints investigations and advise the Treasurer on the application of competitive neutrality to Commonwealth Government activities.
PREFACE
The Productivity Commission has been researching a number of competitive neutrality issues as part of its role as the Commonwealth Government’s Competitive Neutrality Complaints Office (CCNCO). This is the second paper to be released as part of this project. The first dealt with cost allocation and pricing under competitive neutrality and was released in October 1998
This CCNCO research paper was prepared by Stuart Wilson. It examines rate of return issues, particularly as they relate to smaller government business activities. It is intended to aid Commonwealth Government agencies to implement competitive neutrality, and to suggest in broad terms the factors that the CCNCO will take into account when rate of return issues arise in complaints.
The CCNCO would like to thank competitive neutrality policy advisers in the States and Territories who provided helpful comments on drafts of this paper. Nonetheless, the views in the paper are those of the CCNCO and do not necessarily reflect the views of the States and Territories. Comments on the paper are welcome.
Mike Woods Commissioner December 1998
TABLE OF CONTENTS
Preface iii
Overview vii
1 Introduction 1
2 Setting rate of return targets 5
2.1 Uniform rate of return 5
2.2 Benchmarking 5
2.3 Weighted Average Cost of Capital 6
2.4 Choosing between methods 8
3 Measuring rates of return 13
3.1 Accounting rate of return 13
3.2 Economic rate of return 14
3.3 Discounted cash flow analysis 16
3.4 Impact of asset valuation 18
3.5 Which measurement method is best? 20
4 Conclusions 23
References 25
RATE OF RETURN ISSUES
vi
Table 1 Typical rate of return targets for low, medium and high risk
businesses viii
Table 2.1 Variations in the Cost of Capital (WACC) with changes in market
risk (beta) 9
Table 2.2 Level of market risk (beta) of selected Australian industries 10 Table 2.3 Typical rate of return targets for low, medium and high risk
businesses 11
Boxes
Box 2.1 Weighted average cost of capital and the capital asset pricing
model 6
Box 3.1 Accounting rate of return 13
Box 3.2 Economic Rate of Return 15
Box 3.3 Discounted Cash Flow analysis and Internal Rate of Return 17
OVERVIEW
The main role of competitive neutrality complaints units is to investigate allegations that government businesses enjoy net competitive advantages over their competitors by virtue of their public sector ownership.
If government ownership gives a business a significant advantage it is often able to undercharge for its goods and services. A business will be undercharging if, over a reasonable period of time, its revenue does not cover all its costs. One cost a business faces is the cost of capital — it must earn a commercial rate of return on its assets. Thus, among other things, government businesses need to be able to set appropriate rate of return targets, and demonstrate that their performance meets these targets to comply with competitive neutrality.
It is general commercial practice to set a business’s rate of return target by reference to its costs of debt and equity — its weighted average cost of capital (WACC). However, it is difficult to calculate a WACC with precision, even for listed companies, let alone for small government business units. For this reason, the Commonwealth Competitive Neutrality Guidelines for Managers (Commonwealth 1998) suggest that smaller (often non-corporatised) government businesses adopt a uniform target equal to the long term bond rate plus 3.5 percentage points. This target is based upon typical WACC calculations for agencies with average market risk. Earning such a return on assets would largely remove any advantage a government business enjoys over competitors by not having to raise equity capital from private sources.
The Guidelines require larger businesses to estimate their WACC. From a competitive neutrality point of view, these estimates can be made with relatively few resources without sacrificing a critical degree of accuracy. Indeed, little would be lost in accuracy if the business identified whether it had a low, medium or high level of market risk, and adopted a typical rate of return based on that level. Table 1 sets out targets derived using such an approach.
There are also a number of ways of measuring the returns of a business. Conceptually, measures of economic income are superior to accounting measures. However, many businesses are unable to meaningfully estimate changes in asset values, which are a critical component of economic income. Different approaches to asset valuation will also significantly affect the value of assets. In turn, this will affect a business’s rate of return on assets, as the measure is defined as income as a percentage of assets.
RATE OF RETURN ISSUES
viii
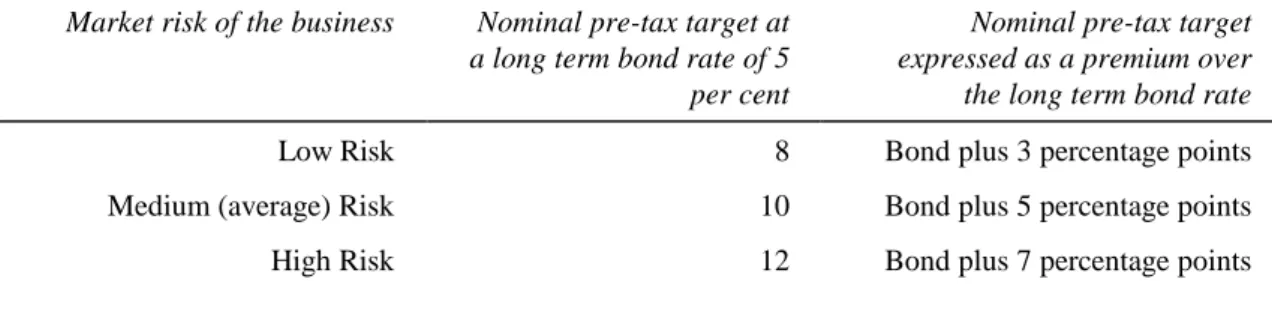
Table 1 Typical rate of return targets for low, medium and high risk businesses
Market risk of the business Nominal pre-tax target at a long term bond rate of 5 per cent
Nominal pre-tax target expressed as a premium over the long term bond rate
Low Risk 8 Bond plus 3 percentage points
Medium (average) Risk 10 Bond plus 5 percentage points
High Risk 12 Bond plus 7 percentage points
The imprecision and potential sources of error in setting and measuring returns suggests that the CCNCO should exercise a degree of judgement when comparing the financial performance of a business against its rate of return target. This paper suggests that the following factors are likely to be important in any comparison:
• trends in the business’s performance over the past five years; • performance of the business relative to other firms in the industry;
• asset valuation methods (particularly whether assets are valued at historical cost or current market value) and likely changes over time in asset values for relatively capital intensive activities;
• the method used to allocate costs to a business unit (in cases where a business shares the assets or resources of a non-commercial agency); and
• management commentary on business performance and whether
performance is in line with corporate plan projections.
In some instances, simple Discounted Cash Flow models can be a useful way for agencies and complaints units to estimate the revenue necessary to meet a return target over time.
1
INTRODUCTION
Competitive neutrality requires that government businesses do not have net competitive advantages over their private sector competitors simply as a result of their public ownership. It thereby aims to achieve a more efficient allocation of resources between the private and public sectors.
Under the Competition Principles Agreement each jurisdiction is required to have a complaints unit to investigate allegations that government businesses are not complying with competitive neutrality. The Commonwealth Competitive Neutrality Complaints Office (CCNCO) is located within the Productivity Commission.
To comply with competitive neutrality government businesses, like private businesses, should earn sufficient revenue to cover their costs. These costs include the costs of capital, which are met if the business earns a commercial rate of return on the business’s assets. Unless government businesses are required to earn a commercial rate of return, they could continue to operate with lower profit levels than rival firms. In turn, this could allow them to undercut their competitors through lower prices, even though they were no more efficient.
A government business’s rate of return will often be important in assessing competitive neutrality complaints. Indeed, assuming it pays relevant input taxes, a Government Trading Enterprise (GTE) operating in a competitive market will usually comply with competitive neutrality if it achieves a commercial rate of return. Similarly, for business units that operate within larger non-commercial agencies, a rate of return is an important part of their cost base — although what costs are allocated to the business unit by the parent agency will also be important for assessing whether they comply with competitive neutrality (see CCNCO 1998).
While a commercial rate of return is an intuitively simple concept, in practice setting rate of return targets and measuring rates of return can be a complex process. Government ownership often makes it more difficult to set an appropriate return target than for private firms. Complexity also arises because there are numerous ways to measure the income generated by an enterprise and to value its assets.
The Commonwealth Competitive Neutrality Guidelines for Managers (Commonwealth 1998) provides brief advice to Commonwealth managers on rate of return issues. For more detailed information the Guidelines refer
RATE OF RETURN ISSUES
2
managers to the Steering Committee on National Performance Monitoring for Government Trading Enterprises (1996), An economic framework for assessing the financial performance of government trading enterprises (henceforth referred to as the Economic Framework).
The approach contained in the Economic Framework is the culmination of the experience of different jurisdictions with financial performance monitoring of GTEs over the previous five years. It recommends using the GTE’s weighted average cost of capital (WACC) as a rate of return target, and comparing the target against the business’s economic rate of return (ERR). The framework is also consistent with recent private sector developments in performance monitoring such as shareholder value-added (SVA). SVA has been adopted in some States and the Commonwealth.
While rate of return issues for competitive neutrality and performance monitoring are conceptually the same, procedurally they involve quite different objectives. The aim of performance monitoring is to establish procedures to assess the performance of government businesses against their stated objectives. In essence, it is intended to help ensure efficient resource use within the business. It is an ongoing process in which considerable resources can be invested. By contrast, a key role of complaints units is to determine whether a government business sets prices on a competitively neutral basis to help ensure that there is efficient allocation of resources between the public and private sectors. In addition, the Economic Framework is aimed specifically at corporatised GTEs, whereas competitive neutrality also applies to many smaller business units.
For these reasons the CCNCO may not always apply the full framework outlined in the Economic Framework, or insist upon agencies doing so:
• many larger government businesses do not yet calculate economic rates of return (ERR), or adopt accounting procedures that make such measurement straightforward; and
• smaller agencies will also find it difficult to calculate ERR and to estimate business-specific costs of capital; and
• complaints units may be satisfied on this issue with a less detailed analysis.
This paper discusses a range of rate of return issues from the perspective of competitive neutrality. The paper does not attempt to duplicate the detailed material contained in in-depth studies such as the Economic Framework. Rather, drawing on that material, it summarises how rate of return targets can be set and how returns can be measured for the purpose of ensuring competitive neutrality. In doing so it discusses the strengths and weaknesses of commonly
INTRODUCTION
used approaches, and suggests where tradeoffs can be made between simplicity and accuracy without undermining the requirement to earn a commercial rate of return.
The paper is intended to aid government agencies — particularly smaller agencies — to implement competitive neutrality. It also suggests, in broad terms, the factors that the CCNCO will take into account when rate of return issues arise in complaints.
2
SETTING RATE OF RETURN TARGETS
Jurisdictions have adopted three methods of establishing target rates of return for government businesses. In increasing order of complexity these are:
• specifying a uniform rate of return for all businesses;
• setting a unique return for each business by benchmarking returns against similar private businesses or industry sectors; and
• setting a unique return based on the business’s weighted average cost of capital.
2.1 Uniform rate of return
The simplest way of setting a return target is for the government to specify a single return across a range of agencies. For instance, the Victorian Government’s competitive neutrality guidelines specify that smaller government businesses (model 2) should earn a rate of return on assets of 11 per cent. Similarly, the Commonwealth Government’s guidelines for managers suggests that smaller agencies earn the long term bond rate plus a margin of 3.5 per cent — currently a total of around 9 per cent for 1998. Such approaches ensure that all agencies aim to earn a significant positive rate of return.
The potential weakness of this approach is that it does not recognise that businesses have different levels of market (or undiversifiable) risk. Market risk is the variation of the business’s returns compared to the market as a whole (see box 2.1). Private investors demand a higher return from higher risk businesses than from lower risk businesses. As a general principle, government-owned businesses should also earn returns commensurate with their market risk.
2.2 Benchmarking
One way of setting a risk adjusted rate of return target is by reference to the returns of similar listed companies, or industry averages. This information is available from a range of publicly available sources. In using this method to select a target, returns would need to be averaged over a period of three to five years to offset the effects of changing economic conditions.
However, benchmarking is seldom easy. For instance, it can be difficult to isolate specific factors affecting an individual firm’s return from underlying market performance. In addition, it is sometimes difficult to find comparable
RATE OF RETURN ISSUES
6
firms or industry averages for some government activities, such as specialised government R&D ventures. Finally, targets established in this way would usually be based on accounting data and could differ from economic measures of performance (see section 3.2).
While benchmarking may lack the appearance of precision, it nevertheless incorporates the activity’s level of market risk into the target setting process and provides a useful basis for setting or comparing returns. At the very least, the performance of other firms in an industry cannot be ignored when judging the performance of a government business.
2.3 Weighted Average Cost of Capital
The third way to calculate a rate of return target is to estimate the business’s weighted average cost of capital (WACC). There are broadly two sources of funding, or capital, for any business — debt and equity. There is a cost attached to each source. Interest must be paid on debt, and those providing equity expect a return on their investment commensurate with the risk of the enterprise. The return on assets expected from a business can be thought of as the respective costs of its debt and equity — WACC (see box 2.1).
Closely associated with the WACC is the Capital Asset Pricing Model (CAPM). It provides a way of determining the risk premium that should attach to equity investments in different companies.
The WACC is widely used by private companies to determine hurdle rates for new investments or to set target rates of return for the business. It has strong foundations in theory and provides a return target tailored specifically to the market risk of the business and its borrowing costs.
Box 2.1 Weighted average cost of capital and the capital asset pricing model
The cost of capital comprises the cost of the firm’s debt and the cost of its equity. Expressed in a pre-tax nominal form, and allowing for the effects of dividend imputation, it is represented as:
INTRODUCTION
Rassets = Rd ∗ d + Re ∗ e
d+e 1-t(1-γ) d+e Where:
Rassets = return on assets
Rd and e= return on debt and equity
d = debt e = equity
t = the effective corporate tax rate
γ = the proportion of franking credits that can be used by investors The return on equity is derived from the capital asset pricing model. It is expressed as a margin above the return investors can achieve without incurring risk. It is defined as:
Re = rf + β∗(rm - rf)
Where:
rf = risk free rate of return — usually the Commonwealth 10 year bond rate
β = beta — measure of market risk
(rm - rf) = the equity premium — the market rate of return less the risk free rate of
return, often 6 or 7 per cent.
Beta (β) is an estimate of the level of market risk associated with the business. Market risk is the variability in returns that arise from changing economic conditions. Therefore, beta measures how sensitive an individual investment’s return is to general movements in the market. For instance, if a 1 per cent rise in the market produced a 0.7 per cent rise in the firm’s returns, the firm would have a beta of 0.7. Investors need to be compensated for accepting such risk as movements in the market will affect every element of their portfolio. In contrast, unique risk is that which is specific to the firm. Under CAPM, unique risk is not taken into account when setting a ROR target because it is assumed investors can hold a diverse portfolio — losses in one area can be compensated from gains in others. The equity betas for all listed companies are published by the Centre for Research in Finance at the Australian Graduate School of Management, and international betas are also available from various sources.
However, it is not without disadvantages. Calculating a WACC requires more data and understanding of theory than other methods. And to a large extent the precision of the WACC is more illusory than real. As the Commonwealth Treasury (1990, p.17) concluded:
The apparent precision of this CAPM [which forms the basis of the WACC] approach in setting a loading above the government bond rate to match market risk is illusory. That is mainly because of difficulties in estimating betas and the risk premium of the complete market portfolio. Considerable judgement is therefore
RATE OF RETURN ISSUES
8
needed in applying the CAPM approach. Nevertheless, it can be a useful tool in assisting with judgements concerning risk loadings for public enterprises.
2.4 Choosing between methods
Each of the three methods for setting target rates of return on assets has a legitimate role to play. While some methods may lack precision, setting and measuring rates of return for government businesses is not a precise science: treating it as such is likely to lead to a false sense of precision and obscure more important sources of variability. For instance, the way in which assets are valued and costs are allocated within an activity can often have a more significant effect on the cost base than differences of a percentage point or two in the rate of return target.
In the past, many government businesses were not subject to any requirement to earn a profit. Any method that sets a target rate of return for government businesses which exceeds that which could be earned without incurring risk, is likely to largely eliminate any advantage the business may have in not being subject to debt and equity markets for funding.
Thus, a generally applicable uniform rate of return target is likely to be a simple and cost effective approach for smaller (and some larger) agencies — particularly when this figure is based upon typical WACC calculations for commercial activities of average risk.
For larger agencies, or those with relatively intensive use of capital, there may, be value in seeking to set a unique target based on the risk of the business. Indeed, many GTEs subject to performance monitoring will have already estimated their WACC.
Even where a government business has not estimated its WACC, for competitive neutrality purposes such calculations can generally be performed with relatively few resources without sacrificing a critical degree of accuracy. This is the case because the measured WACC of a business is not overly sensitive to either the capital structure (level of debt and equity) or small variations in the beta value (which signifies the level of market risk).
With respect to capital structure, it is often argued that the way a project is financed in terms of its debt to equity ratio does not affect the rate of return target. Attributed to Modigliani and Millar (1958), this theorem is subject to a number of assumptions, such as perfectly functioning capital markets (see Treasury 1990 p.19). While these assumptions are not always realistic, it remains true that as the proportion of debt in a corporation rises, financiers are
INTRODUCTION
likely to require a greater margin on loans — that is, the cost of debt rises. The increasing cost of debt offsets to some extent the fact that debt, having less risk, is generally cheaper than equity. This means that the WACC is not as sensitive to changes in capital structure as simple manipulation of the WACC formula (without adjusting debt costs for gearing levels) would appear to indicate.
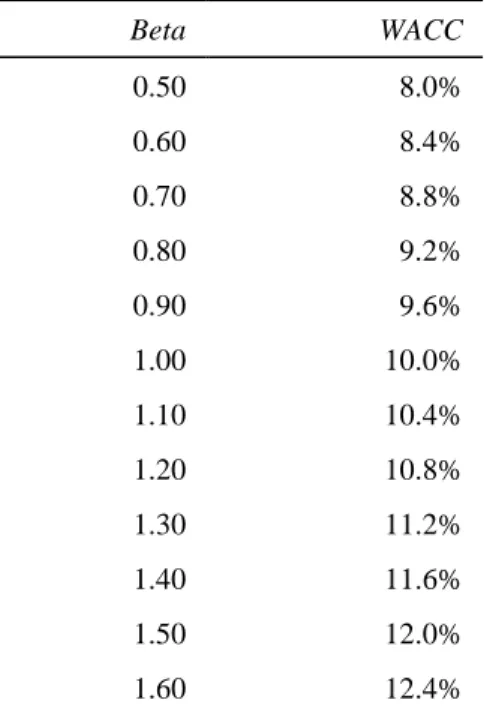
Table 2.1 Variations in the Cost of Capital (WACC) with changes in market risk (beta)
Beta WACC 0.50 8.0% 0.60 8.4% 0.70 8.8% 0.80 9.2% 0.90 9.6% 1.00 10.0% 1.10 10.4% 1.20 10.8% 1.30 11.2% 1.40 11.6% 1.50 12.0% 1.60 12.4%
The WACCs are expressed on a nominal pre-tax basis, and are based on a 6.5 per cent equity premium over a long term bond rate of 5 percent, a debt equity ratio of 1:1, debt costs of 1.00 per cent above the long term bond rate, and a 50 per cent usage of franking credits.
Source CCNCO calculations using the WACC formula in box 2.1
In the case of market risk, a change in the beta leads to a less than proportional change in the WACC. Thus, small or moderate differences in the beta value do not generally have a significant impact on the WACC. This is illustrated in table 2.1. At a long term bond rate around 5 per cent (in late 1998), and assuming a capital structure of 50 per cent debt and 50 per cent equity, WACCs range from around 8 per cent nominal for industries with low risk to 13 per cent for those with much higher risk.
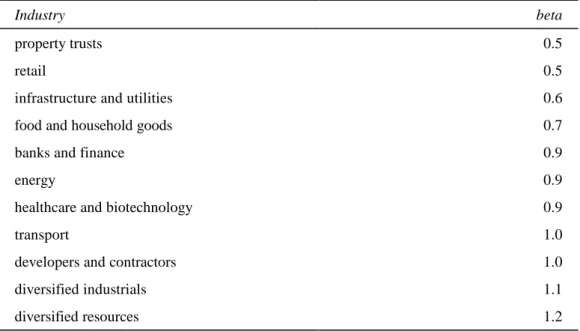
Table 2.2 shows betas at the industry level for a selected range of Australian industries. As would intuitively be expected, the returns in an industry such as property trusts are less sensitive to changes in general market conditions than
RATE OF RETURN ISSUES
10
say, firms in the resource sector. The betas for government businesses can be expected to show similar levels of variation in market risk. Many utilities (eg those facing limited competition such as water utilities) would exhibit relatively low risk. On the other hand, governments are also involved in R&D ventures and similar activities which have a high level of market risk (as well as high unique risk).
Table 2.2 Level of market risk (beta) of selected Australian industries
Industry beta
property trusts 0.5
retail 0.5
infrastructure and utilities 0.6
food and household goods 0.7
banks and finance 0.9
energy 0.9
healthcare and biotechnology 0.9
transport 1.0
developers and contractors 1.0
diversified industrials 1.1
diversified resources 1.2
Source Centre for Research in Finance, Risk Management Service, AGSM, March 1988
For some government businesses it may be difficult to identify a similar listed company or industry, and thus be difficult to precisely determine the level of market risk. But since the WACC is not overly sensitive to the beta value, a reasoned assumption based on the business’s market characteristics is likely to produce an acceptably accurate outcome.
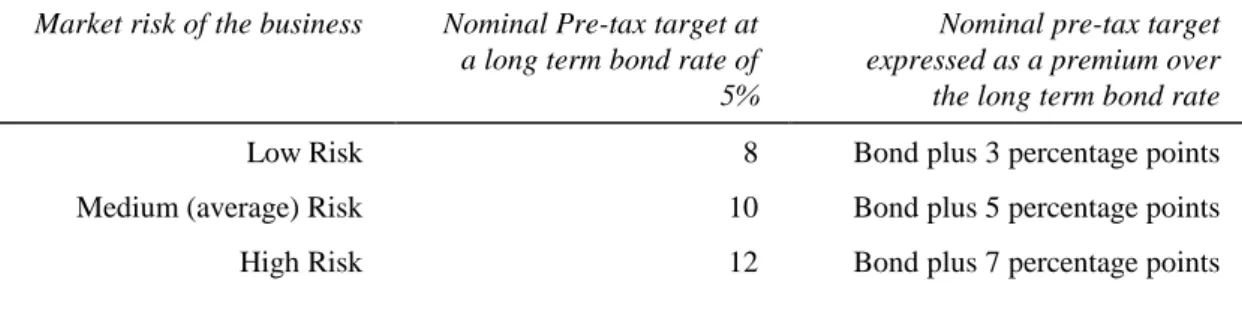
Indeed, for many businesses it may not be necessary to calculate a unique WACC to include an appropriate margin for risk in the return target. For instance, little analysis is required to determine whether a business has a low, medium, or high level of market risk. Yet these categories can be used to establish return targets that would be applicable to the majority of government owned businesses. Based on how beta affects the WACC as shown in table 2.1, a reasonable rate of return for each of these categories would be as presented in table 2.3.
INTRODUCTION
Table 2.3 Typical rate of return targets for low, medium and high risk businesses
Market risk of the business Nominal Pre-tax target at a long term bond rate of 5%
Nominal pre-tax target expressed as a premium over the long term bond rate
Low Risk 8 Bond plus 3 percentage points
Medium (average) Risk 10 Bond plus 5 percentage points
High Risk 12 Bond plus 7 percentage points
Such a broad-banding approach recognises that the precision of the WACC method is more apparent than real, but that the underlying concept of a premium for risk on top of the risk-free rate of return is sound. It is consistent with the view of the Commonwealth Treasury that:
any target rates of return derived from the CAPM are subject to a wide margin of uncertainty and should not be taken as precise quantitative estimates (Treasury 1990, p. 113).
In fact, Bruner et al (1996) suggest that best practice companies — which would generally be able to observe their betas directly from listed data — can expect to estimate their cost of capital with an accuracy of no more than plus or minus 100 to 150 basis points. The margin for error for government business — that cannot observe betas directly — would be significantly greater, lending further support to a simple broadbanding approach.
3 MEASURING RATES OF RETURN
Just as there are different approaches to setting a target, there are different ways of measuring financial performance against that target. Three commonly used ways to measure rates of return are: accounting income measures; economic income measures; and with the assistance of a discounted cash flow model.
3.1 Accounting Rate of Return
Measuring rates of return using accounting income is the simplest method. This approach relies on information contained in agencies’ audited accounts. There are many ways of expressing an accounting rate of return (ARR), although one of the most common is earnings before interest and tax (EBIT) as a percentage of total assets (see box 3.1).
Box 3.1 Accounting Rate of Return
In essence, the accounting rate of return is a measure of earnings from the business’s audited financial statements as a percentage of a measure of assets. However, both earnings and assets can be expressed in a number of different ways.
While earnings are usually expressed before interest and tax (EBIT), there is an issue as to whether abnormal and extraordinary items are included. Another common practice is to calculate EBIT before finance lease payments. The rationale for this is that these payments are really a way of financing a purchase like debt repayments, rather than a cost of operating the business.
The asset value used as the denominator can be the book value of the assets at the end of the year, the beginning value, or some average. Although it is common to use the value at balance date, this will tend to understate the rate of return because it includes assets purchased during the year, upon which the business has not had a full year to earn a return. The Economic Framework suggests, therefore, the following definition be used for the accounting rate of return:
ARR = EBIT after abnormals and extraordinary items ½ (Bvb + Bve)
Where Bv(b and e) = Book value of assets at the beginning of the period (b) and the end of
RATE OF RETURN ISSUES
14
There are two main advantages of accounting rates of return: they are easy to calculate and widely used. This makes it easy to compare performance between public and private enterprises.
However, there are a number of conceptual problems with the measure.
Firstly, as discussed further in section 3.4, ARR relies on an accounting valuation of assets and accounting rates of depreciation. Managers may choose to adopt economic or market values, but under accounting standards there is scope to adopt other valuation methods. For instance, for accounting purposes assets are still often valued at historic cost which is often a poor reflection of their market value.
Secondly, ARR may not fully capture changes in economic/market values (capital income) through either accounting depreciation or the treatment of unrealised gains and losses (see the Economic Framework p. 13), and is thus only a partial indicator of total returns. For example, a firm may report a commercial level of income but at the expense of a declining asset base. Alternatively a firm may report low earnings, but when appreciating asset values are taken into account, total returns may be satisfactory.
Thirdly, ARR measures returns in a single period. This can lead to problems where earnings are volatile, are subject to economic cycles, or where a significant proportion of the asset base comprises assets which take a considerable number of years to reach full profitability.
These weaknesses partly underpin the Economic Framework’s conclusion that an economic, rather than an accounting, rate of return should be used for performance monitoring.
3.2 Economic Rate of Return
The economic rate of return (ERR) is a measure of the total return generated by the agency within a defined period — usually a year. It includes net cash receipts and the change in capital values of assets. ERR is thus defined as:
ERR = net cash receipts + change in capital value opening market value of assets
In its purest form, ERR is difficult to calculate because it requires annual revaluations of all assets. However, the Economic Framework outlines a methodology which provides a proxy for ERR using data contained in normal accrual accounts (see box 3.2).
MEASURING RATES OF RETURN
Box 3.2 Economic Rate of Return
There are various proxies for the economic rate of return that use accounting data. The most comprehensive is provided in the Economic Framework. The formula is:
ERR = (EBIT + Da + NIBL + FL +CSO) +(Ae - Ab - Net investment)
Ab + (Net investment/2)
Where EBIT = earnings before interest and tax (but after abnormals and extraordinaries);
Da = accounting depreciation and amortisation;
NIBL = an adjustment for the implicit interest cost of non-interest bearing liabilities;
FL = an adjustment for interest costs of assets under financial leases; CSO = an adjustment for the net economic cost of any Community
Service obligations (CSOs) (if applicable); Ae = the end of period value of total assets; and
Ab = the beginning value of total assets.
In turn, net investment is defined as
= Ae - Ab - (AsRRe - AsRRb) + Da
Where AsRR (e,b) = the asset revaluation reserve at the end of the period and at the beginning of the period
Other terms as above.
As can be seen from the above equations, there are a number of common terms between net investment and other aspects of economic income (Ae , Ab and Da). The formula for
economic income (the top line of the equation) can be simplified by cancelling these terms. It then becomes:
Economic income = EBIT + plus adjustments + change in asset revaluation reserve The cash component of economic income is given by EBIT and adjustments, (such as for CSOs or finance leases). The capital component is given by the change in the asset revaluation reserve. This highlights the importance of the reserve in this formulation of ERR. If the asset revaluation reserve does not give a reasonably good indication of the change in economic values for a particular business, the measured ERR will not be meaningful.
RATE OF RETURN ISSUES
16
Given that it includes capital income as well as cash income, ERR is consistent with a rate of return target set by the activity’s WACC.
Reliance on accounting data is both a strength and a weakness of the Economic Framework’s approach to ERR. It is a strength because all the information necessary to measure returns is publicly available, allowing interested parties outside the agency to measure and compare returns on a consistent basis. It is also a weakness because accounting data does not necessarily fully capture changes in economic value, and can thereby distort results. For example, the calculation of capital income relies heavily on the asset revaluation reserve in the balance sheet. However, directors have wide discretion both as to the timing and method used to revalue assets — the Economic Framework notes that a number of GTEs do not actively use the reserve. This raises questions about the accuracy of measured changes in capital income. For instance, if a fall in the value of some assets was not recognised in a government business’s accounts, the measured ERR would overstate its level of performance.
Finally, as with ARR, ERR also suffers the limitation of being a one period measure.
3.3 Discounted cash flow analysis
Under the discounted cash flow (DCF) approach, all revenue and expenditure is forecast for an appropriate period into the future. The initial value of assets (the firm’s investment) and net cash flow for each year form the basis for measuring returns. The internal rate of return (IRR) is a percentage that can be compared with the business’s rate of return target (see box 3.3).
Conceptually, the DCF method, and the associated IRR, are the most analytically sound techniques for identifying the level of income that is consistent with the ROR target. Not only is ERR consistent with the DCF approach, but ERR in fact originates from DCF analysis. As the Economic Framework states:
An Economic Rate of Return (ERR) is similar to the concept of a single period IRR. That is, it is the growth rate required on an investment over a single period which equates the initial value of the asset to the sum of the net cash receipts and the market value at the end of the period. (p.10)
MEASURING RATES OF RETURN
Box 3.3 Discounted cash flow analysis and internal rate of return Discounted cash flow analysis involves forecasting all revenue and cash costs (including capital expenditure) for a business into the future. The stream of free cash flow or net operating cash flow is discounted to estimate the value the business.
Usually the business’s WACC is used as the discount rate. If the business has a net present value (NPV) greater than zero when discounted by its WACC, it will be generating enough revenue to earn a rate of return equal to, or exceeding, its WACC over the life of the project.
Alternatively, the internal rate of return (IRR) for the project can be directly calculated from the free cash flow. While the NPV is a dollar value of future income at a specified discount rate, the IRR is the discount rate that will produce an NPV of zero. The business will be meeting or exceeding its rate of return target if the IRR meets or exceeds its WACC.
Another strength of the DCF approach is that it overcomes the limitations of one period analysis: the rate of return depends on the expected cash flow over a reasonable period of time. This could be particularly useful where returns are variable, for instance where there are lumpy capital investments.
Finally, DCF analysis is cash based, and therefore less prone than other measurement techniques to distortions caused by the divergence of reported accounting values from economic values — with respect to depreciation for instance.
From a performance monitoring or complaints unit perspective, however, DCF analysis has a number of drawbacks. Sophisticated DCF modelling can be resource intensive and may require data only available to managers within a business. It is, therefore, difficult for those outside the firm to independently replicate results obtained by the business or compare returns across industries. And for businesses operating in volatile markets (eg export oriented firms), it may be difficult to make meaningful estimates of future revenue flows.
Nevertheless, even very simple models may be of use to agency managers. If the underlying assumptions can be shown to be reasonable, achieving returns in line with that required according to a simple DCF model could support an argument that an agency was complying with rate of return requirements under competitive neutrality.
The CCNCO could, in turn, run scenarios using such models to test claims made by agencies about future performance. For instance, if a business was presently earning low returns but claimed that its future performance would
RATE OF RETURN ISSUES
18
justify its investment, a complaints unit could test whether the cost and revenue assumptions needed to support this were reasonable.
Further information is available from the CCNCO on the use of a simple cash flow model.
3.4 Impact of asset valuation
Although it is not the role of this paper to examine asset valuation in any detail, as noted, the value of assets in a business can have as great an impact on the measured rate of return as does the level of income it generates. The method used to value assets is, therefore, important.
The Steering Committee on National Performance Monitoring for GTE’s Guidelines on Accounting Policy for Valuation of Assets of Government Trading Enterprises (1994), recommend that the deprival value method be used. Under the deprival value:
... assets are valued at an amount that represents the loss that might be expected to be incurred by an entity if that entity were deprived of the service potential or future economic benefits at the reporting date. p.3
In most cases deprival value equals the replacement cost less economic depreciation, and is equivalent to the service potential of the asset (see box 3.4). The guidelines also recommend that assets be revalued at least every five years, noting that a rolling program of revaluation may minimise the cost of this exercise and iron out problems of lumpiness in measured returns caused by revaluations.
The Guidelines support the deprival value method because it represents a market measure of current value — that is, it comes close to capturing the value of the economic services in the asset (see SCNPMGTE 1994 for a discussion). Use of this, or similar current cost methods, and relatively frequent asset revaluation are prerequisites for calculating a meaningful ERR.
While the deprival method is gaining greater acceptance across government, many GTEs, including a number at the Commonwealth level, do not at present use the method to value assets. Instead, consistent with the private sector they tend to follow normal accounting standards, which allow a number of different methods to be used.
Box 3.4 The deprival method of valuing assets Under the deprival value methodology:
MEASURING RATES OF RETURN
“a. where the service potential of future economic benefits embodied in the asset would be replaced if the GTE was deprived of the asset, the primary basis for valuation of assets are:
(i) current market (buying) price of a similar asset — where a similar asset can be purchased;
(ii) current replacement cost of the same service potential or future economic benefits of the existing asset where the above techniques are not applicable; or (iii) current reproduction cost of the same service potential or future economic benefits of the existing asset where the above techniques are not applicable. b. where the service potential or future economic benefits embodied in the asset would
not be replaced if the GTE was deprived of the asset, the basis for valuation of assets is the net present value of the cash flows expected from continued use and subsequent disposal of the asset.
c. surplus assets (that is, assets held for sale without replacement) are to be measured at their current net selling price.”
Source: SCNPMGTE 1994, p. 3
As a result, GTEs often present a mixture of historic cost (valuing assets at what they cost to purchase), current value (including replacement value) and directors’ opinions. For many smaller businesses, historic cost valuations are often all that is available.
The use of a range of valuation techniques introduces another source of possible distortion into measurement of rates of return. This will particularly affect ERR measurement because that method relies heavily on asset valuation (and revaluation) for an estimate of capital income. If changes in reported asset values reflect accounting policy and/or the timing of asset revaluations as much as the underlying change in the economic services embodied in those assets, it will be difficult to obtain an ERR that does not suffer the same conceptual problems as an ARR.
ARR and discounted cash flow techniques are also affected by the valuation method. If asset values are overstated, the measured ARR will appear to be lower than it actually is, and vice versa. Similarly, in the case of DCF analysis, the existing asset value is usually a key input for the first period in a cash flow model.
In practice, it is difficult to make judgements about the extent to which recorded asset values will diverge from their economic values. For some businesses it may be minimal, while in others it could be substantial. However, the key point
RATE OF RETURN ISSUES
20
is that the potential for measured returns to be distorted by the way assets are valued is another factor that must be taken into account when interpreting a business’s returns.
3.5 Which measurement method is best?
As is the case with setting rate of return targets, the choice of measurement method is a case by case decision.
Accounting returns are likely to be a satisfactory measure for many smaller government businesses, notwithstanding the conceptual drawbacks of the accounting approach. For smaller agencies that do not have large asset bases, accounting returns are a good proxy for economic returns. As Copeland et al (1994) note with respect to accounting income:
Like most things that stand the test of time, it works very well in certain situations. When earnings reflect cash flow (eg, businesses with little capital), the accounting approach provides a reasonably good proxy for discounted cash flow. It is when earnings and cash flow diverge that the accounting approach comes up short. (p. 73 )
Moreover, as Queensland Treasury (1997, p.36) notes, where accounting depreciation reflects economic depreciation (ie the change in the value of the asset over the relevant period), and where there are few financing leases, accounting returns will provide an approximation of the business’s economic rate of return. For many businesses, accounting depreciation is the only measure that is available, so that even if it is imperfect, it is better to use it than disregard depreciation altogether.
Where a business has significant assets, the case for a more explicit economic measure of returns is stronger. Capital income as well as cash income could be significant. While some form of ERR is useful in these situations, like all measures, an ERR is only as good as the data supporting it. If inadequate information is available on changes in asset values, undue reliance should not be placed on the measured ERR.
Nonetheless, changing asset values should not be ignored simply because robust data are not available. One approach to dealing with inadequate data is to start with accounting returns, and then make a qualitative assessment on how asset values are changing. For instance, a competitive neutrality complaints unit may inquire whether:
• the returns are achieved at the expense of a decline in the asset base; • accounting depreciation overstates or understates likely economic
MEASURING RATES OF RETURN
• increases in asset values temper an apparently poor level of operating income.
Discussions with management and examination of maintenance and service indicators may help to supplement information provided on changes in asset values.
Another approach is for a complaints unit to use a simple DCF model to determine if returns appear to be reasonable under a range of plausible asset values and revenue projections.
4
CONCLUSIONS
Section 2 demonstrated that setting targets is not a precise exercise. Similarly, section 3 stressed that measuring returns often encountered significant data limitations, which can be compounded by a multitude of approaches to asset valuation.
These conclusions suggests that the CCNCO should exercise a degree of judgment when assessing the financial performance of a business against its rate of return target. For instance, failure to meet a target in one year cannot, in isolation, be taken as evidence of non-compliance with competitive neutrality. Similarly, this paper concludes that it is not possible to specify strict parameters in assessing rate of return performance. For instance, it would not be appropriate to adopt a position that a business’s earnings must be within 20 per cent of the rate of return target to be considered satisfactory — there are many reasons why this may not be the case. Rather, assessing whether returns from a government business are satisfactory needs to take account of a range of factors.
Based on the analysis in this paper, a complaints unit could judge whether the business’s rate of return target is appropriate by reference to:
• government policy guidelines;
• rates of return for similar firms or industries; or
• estimation of the likely WACC for the business using readily available data — in some cases using benchmark returns based on broad categories of market risk such as those contained in table 2.2.
However, regardless of technique when comparing a business’s financial performance against the target the CCNCO will consider:
• trends in financial performance over the past five years;
• asset valuation methods, particularly whether assets are valued at historical cost or current market value;
• changes in asset values for relatively capital intensive activities;
• cost allocation methods (in cases where a business shares the assets or resources of a non-commercial agency);
• performance of the business relative to other firms in the industry; and
• management commentary on business performance and whether
RATE OF RETURN ISSUES
REFERENCES
Bruner, R. Eades, K. Harris, R. Higgins, R. 1996, “Best Practices” in Estimating the Cost of Capital: Survey and Synthesis, Darden School Working Paper, No 96-13, Graduate School of Business Administration, University of Virginia.
Centre for Research in Finance 1988, Risk Management Service, AGSM, March.
Copeland, T. Koller, T. Murrin J. 1994, Valuation: Measuring and Managing the Value of Companies, second edition, John Wiley and Sons Inc., New York.
Commonwealth Government (Commonwealth) 1998, Commonewealth Competitive Neutrality Guidelines for Managers, AGPS, Canberra.
Commonwealth Competitive Neutrality Complaints Office (CCNCO) 1998, Cost Allocation and Pricing, CCNCO Research Paper, Productivity Commission, Canberra, September.
Hey-Cunningham, D. 1998, Financial Statements Demystified, second edition, Allen & Unwin, Sydney.
Modigliani, F. Millar, M.H. (1958), The Cost of Capital, Corporation Finance and the Theory of Investment, American Economic Review, No 48, 261-297. Queensland Treasury 1997, Corporatisation — a users’ guide, June.
SCNPMGTE (Steering Committee on National Performance Monitoring of Government Trading Enterprises) 1994, Guidelines on Accounting Policy for Valuation of Assets of Government Trading Enterprises, October. The Economic Framework, (Steering Committee on National Performance
Monitoring of Government Trading Enterprises) 1996, An economic framework for assessing the performance of Government Trading Enterprises, July.
Treasury (Commonwealth Department of) 1990, Financial Monitoring of Government Business Enterprises: An Economic Framework, AGPS, Canberra.
Victoria (Department of Premier and Cabinet) 1996, National competition policy and local government: A statement of Victorian Government policy, Melbourne.