Extraction of Hg(II) from aqueous solutions by chelating resin Chelex-100 Section B-Research paper
LIQUID–SOLID EXTRACTION OF Hg(II) FROM AQUEOUS
SOLUTION BY CHELATING RESIN CHELEX-100
Afaf Amara-Rekkab
[a]and Mohamed Amine Didi
[a]*
Keywords: mercury(II); Chelex 100; adsorption; ion exchange; optimization.
The sorption of mercury(II) from aqueous medium on a chelating resin Chelex 100 has been studied in batch mode. Since the extraction kinetic was obtained, with a mixture of 0.1 g of resin and 5 mL of mercury(II) at 200.59 mg L-1 of initial concentration, extraction
equilibrium was reached within 180 min of mixing. The influence of some parameters such as initial mercury(II) ion concentration, initial pH of aqueous solution, ion strength and the amounts of resin have been studied at fixed temperature (20±1 °C). The optimum pH value level for quantitative sorption was 5.7. The best performance obtained was 98.0 % of extraction yield equivalent to 14.19 mg g-1 of resin.
The pseudo-first- order equation, pseudo-second-order equation, the intra-particle diffusion model and Boyd’s diffusivity model were used to describe the kinetics data and rate constants were evaluated. The Freundlich and Langmuir adsorption models were applied to describe the equilibrium isotherms.
*Corresponding Author Fax: +213 43216378 E-Mail: [email protected]
[a] Laboratory of Separation and Purification Technologies, Department of Chemistry — Faculty of Sciences, Box 119, Tlemcen University — 13000, Algeria
Introduction
Mercury is a carcinogenic heavy metal and poses a potential threat to human health even at very low concentrations (0.47 µg kg-1 of p.w. day-1. (p.w. = Physical
weight). It has been well documented that mercury may cause brain damage, dysfunction of liver, kidney, gastrointestinal tract and central nervous system, as well as induce cellular toxicity by binding to intracellular sulfhydryl groups. Inorganic mercury is the most prevalent form of mercury in aquatic ecosystems.1 The other hand, mercury
recovery is important from the economical point of view because it has a wide range of applications like dental amalgams, anti-fouling paints, electrodes for some types of electrolysis, batteries, fluorescent lamps, catalysts, etc.2
Several methods can be applied to remove mercury from aqueous solutions such as ion exchange,3 carbon
adsorption,4 sequential injection extractions,5 liquid– liquid
(LLE)2,6 and solid phase extraction (SPE).1,7-18
In this paper, the extraction of mercury(II) by liquid–solid extraction use resin Chelex 100 as extractant agent. Chelating resins have seen considerable application in speciation studies, particularly the commercially available Chelex-100 resin, which is a polystyrene divinylbenzene copolymer incorporating iminodiacetate chelating groups. The iminodiacetate groups coordinate metals by means of oxygen and nitrogen bonds and the resins have a particularly strong affinity for trace metals. It was proposed firstly to use Chelex-100 for the preconcentration of total trace metals from seawater. After, she is used to differentiate labile from non-labile fractions of trace metals. Chelex-100 retains free metal ions and loosely bound trace metals.19
Chelex 100 finds application in many fields, it was effective in binding several metal ions (Cr3+, Ni2+, Cu2+and
Zn2+, Tl3+, La3+ and Al3+).20-23
Therefore, the objectives of this study are to investigate the best performance of mercury(II) extraction by Chelex 100, by varying diverse parameters as the initial mercury(II) ion concentration, initial pH of aqueous solution, ion strength and the amounts of resin.
Materials and methods
Characteristics of Chelex 100
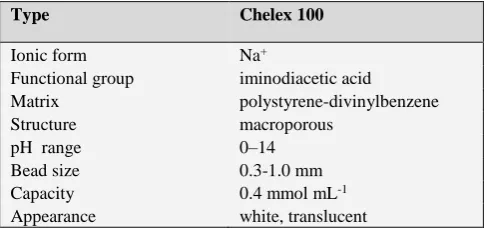
Chelex -100 (Bio-Rad Laboratories, CA, USA) is a chelating resin which uses ion exchange to bind transition metal ions. The resin is composed of polystyrene divinylbenzene copolymers containing paired iminodiacetate ions, which act as chelators for polyvalent metal ions (see Table 1).24 This group can interact via its
nitrogen and oxygen atoms with the mercury according a tridentate interaction.
Table 1. General description and some properties of resin
Type Chelex 100
Ionic form Na+
Functional group iminodiacetic acid
Matrix polystyrene-divinylbenzene
Structure macroporous
pH range 0–14
Bead size 0.3-1.0 mm
Capacity 0.4 mmol mL-1
Extraction of Hg(II) from aqueous solutions by chelating resin Chelex-100 Section B-Research paper Metal salt and other chemicals
Mercury(II) chloride is procured from Sigma (St. Louis, MO, USA). Buffer is obtained from Riedel-de-Haen (Seelze, Germany), while sodium chloride is from PANREAC (Phillipsburg, USA). Pyridylazonaphtol PAN used for mercury analysis were from Sigma (St. Louis, MO, USA). Hydrochloric acid and sodium hydroxide used for adjusting pH of mercury(II) solutions were from Stinnes chemicals (Deutscland), Sigma (St. Louis, MO, USA), respectively.
Batch studies
Effect of the agitation time
Kinetic experiments were carried out by agitating 5.0 mL of mercury(II) solution at initial concentration, 1 mmol L-1,
with 0.1 g of chelating resin Chelex 100 in a 10 mL Erlen at 20±1 °C at pH=5.7 and at a constant agitation speed of 1000 rounds per minute (rpm) for a time ranging from 2 to 180 min and the amount of mercury(II) remaining in solution was measured. All experiments were made at pH=5.7 without adjustment. The samples were collected from the shaker, filtered and the filtrates were analyzed for mercury(II) concentration with a SPECORD 210 plus spectrophotometer at 590 nm using pyridylazonaphtol PAN and buffer at pH=13.0 as reagents.
The percent Hg(II) extraction, (%) was determined as follows:
(1)
The adsorption amount was calculated as follows:
(2)
where
qt is the adsorption amount (mg g-1),
w the weight of the Chelex 100 (g),
M molar mass (g mol-1),
V the volume of solution (L), and
C0 and C are the concentrations (mol L-1) of mercury
ions before and after adsorption, respectively.
Effect of initial solution pH
The effect of solution pH on the equilibrium uptake of mercury(II) from aqueous solution by the Chelex 100 resin investigated between pH 1.6 and 10.0. The experiments were performed by adding a known weight of resin (0.1 g) into eight 10 mL Erlenmeyer containing 5 mL of mercury(II) solution. Dilute nitric acid or sodium hydroxide was used to adjust the pH of mercury solutions using a pH meter (model WTW, PH 3310 SET 2, Germany). The flasks were shaken at 1000 rpm at 20±1 °C for 180 min.
Effect of initial mercury(II) concentration
Kinetic experiments were carried out by agitating 5.0 mL of mercury(II) solution of concentration ranging from 0.01 to 1 mmol L-1 with 0.1 g of Chelex 100 resin in a 10 mL
Erlen at 20±1 °C at pH=5.7 and at a constant agitation speed of 1000 rpm for 180 min.
Effect of the amount of resin
The effect of the adsorbent amount was studied with a 5 mL solution of 1 mmol L-1 mercury(II) solution and varying
amounts of adsorbent from 0.05 to 0.2 mg.
Effect of ionic strength
The effect of ionic strength of aqueous media on the equilibrium uptake of mercury(II) from the aqueous solution by the Chelex 100 resin (0.1 g) was investigated by adding, in a 10 mL Erlen, a known weight of solid NaCl to 5 mL of 1 mmol L-1 mercury(II) solution at 20±1 °C at pH =5.7 and
at a constant agitation speed of 1000 rpm for 180 min. Flame Photometer Jenway Models PFP7 spectrometer was used for the measurements of free sodium before and after extractions of mercury(II) by Chelex 100 resin.
Adsorption kinetic model
In an attempt to express the mechanism of mercury adsorption onto the surface and pores of the resin, the following kinetic model equations are used to analyze the adsorption experimental data for determination of the related kinetic parameters.
Pseudo-first order model (PFO)
The PFO rate expression based on solid capacity is the most widely used rate equation for assigning the adsorption rate of an adsorbate from a liquid phase and is known as the Lagergren rate equation.25 It is represented as:
f( e t)
dq
k q q
dt (3)
where
qe (mg g-1) and qt (mg g-1) are the adsorption capacity
at equilibrium and time t respectively and
kf (min−1) is the rate constant of the PFO adsorption
reaction.
On integration and applying boundary conditions as qt = 0 at
t = 0 and qt = qe at t=te, Eq. (3) becomes:
(4) 0
0 Yield (%) 100C C
C
0 t
( )
V C C M q
w
e t e f
log( ) log
2.303
Extraction of Hg(II) from aqueous solutions by chelating resin Chelex-100 Section B-Research paper Pseudo- second order model (PSO)
The PSO kinetic expression was developed by Ho35 to
describe the adsorption of metal ions onto adsorbent. The rate expression is represented as:
(5)
where
qe and qt (mg g-1) are the adsorption capacities at
equilibrium and time t respectively and
ks (g mg-1 min-1) is the rate constant for the PSO
adsorption reaction.
The nonlinear form of PSO model (Eq. (5)) can be rearranged into four different linear forms, of which the most popular one is:26
(6)
The product k2qe2 (mg g-1 min-1) is the initial sorption rate
(h).
Applying Eq. (6) for the analysis of kinetic data is usually based on the plotting of t/qt versus t which should give a
linear relationship; whereas, 1/qe and 1/k2qe2 are the slope
and the intercept of obtained line, respectively.
Intra-particle diffusion model (IDM)
The intra-particle diffusion model is represented as follows:
(7)
where
De is the intra-particle diffusion coefficient and
r is the particle radius.
For short times (when qt/qe is less than 0.3), Eq. (7) can
reduce to the following expression:
(8)
where kID is the intra-particle diffusion constant. The
significant property of this equation is that, if the intra-particle diffusion is the only rate-limiting step, then the linear plot of qt versus t0.5 should pass through the origin. On
the other hand, if the intercept of plots do not equal zero, then it indicates that the intra-particle diffusion is not the sole rate determining step.26
Then Eq. (8)27 is modified to:
(9)
where S is a constant and reflects the boundary layer effect.
Investigation of various reports about the sorption rate shows that the intra-particle diffusion model is the most popular one for the diffusion rate-controlling step that has been used in conjunction with the surface reaction models to recognize the adsorption kinetics.
Boyd’s diffusivity model (BDM)
Boyd’s kinetic model27 for adsorption reaction is based on
diffusion through the boundary liquid film, considering adsorption kinetics as a chemical phenomenon. The simplified form of the rate equation can be expressed as:
(10)
where
F(t) = qt/qe is the fractional attainment of equilibrium
at time t,
De (m2 s−1) is the rate constant and
Ra (m) is the radius of the spherical adsorbent particle.
A linear plot of ln[1/(1−F2(t))] versus t will give the
value of De.
Results and discussion
Effect of contact time on mercury(II) adsorption
The influence of contact time on the percent Hg (II) extraction (%) (Eq. (1)) and the uptake (mg g-1) (Eq. (2))
from aqueous solution of Hg(II), 1 mmol L-1, is investigated
at 20±1 °C (Fig. 1).
Based on Fig. 1, we can divide the sorption process into three steps. During the first step (2 min < t ≤ 30 min) sorption is fast and percent Hg(II) extraction increase from 0 to 62.2 % for Hg(II). The reason is that the driving force for mercury(II) is higher, which permits to overcome all the external mass transfer resistances and the active sites with higher affinity are first occupied, thus Hg(II) ions might enter easily the accessible pore sites and bind with the chelating ligands.28
During the second step (t=30 min to t=120 min), it is slower and percent Hg(II) extraction increases from 62.2 to 91.2 % , which could be due to that some Hg(II) ions might be hampered to diffusion into the deeper pores and to the existence of different sorption mechanisms.28
2 tS e t
dq
k q q dt
2
t S e
1
e
t t
q k q q
2 2
t e
2 2 2
e 1
6 1
1 exp
n
q D n
t
q n r
t ID
q k t
t ID
q k tS
2 e
2 2
a 1
ln
1 ( )
t D F t R
Extraction of Hg(II) from aqueous solutions by chelating resin Chelex-100 Section B-Research paper
Figure 1. Effect of contact time on the ion exchange of Hg(II) using Chelex-100. Initial concentration of Hg(II) 1 mmol L-1,
amount of resin 0.1 g, volume of ion-exchange medium 5 mL, T=20±1 ◦C, stirring = 1000 rpm and initial pH 5.7
In the third phase (t ≥ 120 min), the sorption process
ceases, indicating the attainment of equilibrium and percent Hg(II) extraction became constant. The maximum percent Hg(II) extraction is 93.9 % obtained at 180 min which is used as a suitable contact time for mercury(II) adsorption. It is found that the concentration of Hg2+ in aqueous solutions
decrease more rapidly in the early stage of operation (0–30 min), and the exchange is virtually completed within 30–180 min. That is, the decrease of the concentration of Hg2+ in the
solution demonstrates that higher exchange rates (dCM/dt) of
Hg2+ with Na-form chelating resins is obtained at the onset;
and the plateau is reached gradually within 150 min. This time is half that obtained by Manouchehri in the extraction of cadmium, copper and lead, which was of 300 minutes and the maximum of extraction of copper and zinc at 240 and 300 minutes respectively by Chelex 100.21,29
Kinetics of adsorption
In this study, batch sorption kinetics of Hg (II) ions at initial concentration, 1 mmol L-1, with the chelating resin
Chelex 100 has been studied. The different values of constants from the slopes and intercepts of linear plots of Eq. (4) (shown in Fig. 2), Eq. (6) (shown in Fig. 3), are summarized in Table 2.
Figure 2. Lagergren plots for the adsorption of Hg(II) using Chelex-100. Amount of resin 0.1 g, volume of ion-exchange medium 5 mL, T= 20±1°C, stirring = 1000 rpm, initial pH 5.7 and
initial concentration of Hg(II) 1 mmol L-1.
Figure 3. Pseudo-second order kinetic models for the adsorption of Hg(II) onto Chelex 100. Amount of resin 0.1 g, volume of ion-exchange medium 5 mL, T = 20±1°C, stirring = 1000 rpm, initial pH 5.7 and initial concentration of Hg(II) 1 mmol L-1.
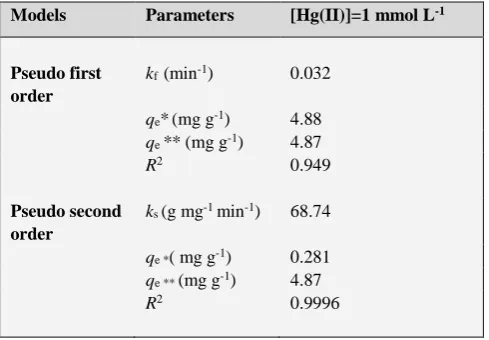
Table 2. Kinetic parameters for adsorption of mercury by Chelex 100
Models Parameters [Hg(II)]=1 mmol L-1
Pseudo first order
kf (min-1) 0.032
qe*(mg g-1) 4.88
qe ** (mg g-1) 4.87
R2 0.949
Pseudo second order
ks (g mg-1 min-1) 68.74 qe *( mg g-1) 0.281
qe ** (mg g-1) 4.87
R2 0.9996
*calculated, **experiment
As shown in Table 2, the obtained coefficients values of the pseudo-second-order model ( > 0.999) were better than those of the first-order model for the adsorption of Hg(II) at the considered concentration, suggesting that the pseudo-second-order model was more suitable to describe the adsorption kinetics of Chelex 100 for Hg (II).This suggests that the rate limiting step may be a chemical process involving valence forces through sharing or exchange of electrons.25 Similar results have been observed in the
adsorption of Hg (II) by an extracellular biopolymer poly (γ-glutamic acid)1 and on bamboo leaf powder.17
Diffusivity study
The mercury(II) ions transport from the solution phase to the surface of the Chelex 100 occurs in several steps. The overall adsorption process may be controlled either by one or more steps (e.g., film or external diffusion, pore diffusion, surface diffusion and adsorption on the pore surface). Besides adsorption at the outer surface of the resin, there is also a possibility of intra-particle diffusion of Hg (II) from the bulk of outer surface into the pores adsorbent. The possibility of intra-particle diffusion was studied using the Morris–Weber equation (Eq. (9)).
-20 0 20 40 60 80 100 120 140 160 180 200 0
20 40 60 80 100
E
x
tr
a
c
ti
o
n
y
ie
ld
,
%
Time (min)
-20 0 20 40 60 80 100 120 140 160 180 200 0
5 10 15 20 25 30 35 40
t/
qt
(m
in
.g
/m
g
)
Time (min)
0 20 40 60 80 100 120 140 160 -2,0
-1,5 -1,0 -0,5 0,0 0,5 1,0
L
o
g
(
qe -qt
)
Extraction of Hg(II) from aqueous solutions by chelating resin Chelex-100 Section B-Research paper
Figure 4. Intra-particle diffusion Kinetic models for the adsorption of Hg(II). Amount of resin 0.1 g, volume of ion-exchange medium 5 mL, T= 20±1°C, stirring = 1000 rpm, initial pH 5.7 and initial concentration of Hg(II) 1 mmol L-1.
The plot of the Morris–Weber relationship for the sorption of Hg (II), at initial concentration equal to 1 mmol L-1, by
the resin is shown in Fig. 4. Based on this figure, it may be seen that the intra-particle diffusion of Hg(II) within the resin occurred in 3 stages.
The first linear portion included the adsorption period from 0 to 60 min, representing the external mass transfer or film diffusion (boundary layer) and the rapid distribution of Hg(II) ions onto the outer surface of Chelex 100. The second linear portion corresponded to the adsorption period of 60–180 min, which represents the intra-particle diffusion and binding of Hg(II) ions into the internal active sites of the biomass. Finally, the third linear portion (from 150 min on) indicated a saturation of the adsorption process. The intra-particle diffusion constants and regression coefficients for these three stages (kID and R2) are given in Table 3.
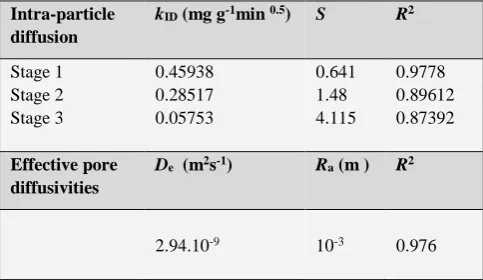
Table 3. Intra-particle diffusion model parameters and effective pore diffusivities for mercury adsorption onto Chelex 100
Intra-particle diffusion
kID (mg g-1min 0.5) S R2
Stage 1 0.45938 0.641 0.9778
Stage 2 0.28517 1.48 0.89612
Stage 3 0.05753 4.115 0.87392
Effective pore diffusivities
De (m2s-1) Ra (m ) R2
2.94.10-9 10-3 0.976
The plot of ln[1/1−F2(t)] versus t (Fig. 5) is a line whose
slope,(2/Ra2)De, thus diffusion coefficient, De can be
calculated. The value of diffusion coefficient as calculated from Eq. (10) is shown in Table 3. The values of De falls
well within the values reported in literature, especially for chemisorptions system (10−9 to 10−17 m2 s-1).30
Figure 5. Boyd’s diffusivity plot for adsorption of Hg(II) onto
Chelex 100. Amount of resin 0.1 g, volume of ion-exchange medium 5 mL, T = 20±1°C, stirring 1000 rpm, initial pH 5.7 and initial concentration of Hg (II) 1 mmol L-1.
Effect of mercury concentration
Sorption capacity
The percentage uptake is highly dependent upon the initial concentration of the Hg(II) ion and the resin. The initial Hg(II) concentrations tested were 0.01, 0.1, 0.2, 0.5, 0.8 and 1 mmol L-1 at an amount of adsorbent of 0.1 g (Fig. 6). The
data indicates that the initial metal concentration determines the equilibrium concentration, and also determines the uptake rate of metal ion and the kinetic character of the process.
In the case of low concentrations, the ratio of the initial number of moles of Hg(II) ion to the available surface area is larger and subsequently, the fractional ion exchange becomes independent of initial concentrations. The rapid metal extraction has significant practical importance, as this will facilitate with the small amount of resins to ensure efficiency and economy.
The amount of Hg(II) ions adsorbed per unit mass of the resin increased with the initial metal concentration as expected. This is due to the fact that sorption sites took up the available metal ions more quickly at low concentration, but metal needed to diffuse to the inner sites of the sorbent for high concentration. The extraction of mercury sorbed after equilibrium is 13.03 mg g-1, at an initial concentrations
between 0.5 and 1 mmol L-1. The initial rate of sorption was
greater for higher initial mercury concentration, because the resistance to the metal uptake decreased as the mass transfer driving force increased.
It is also noticed that an increase in the initial mercury concentration leads to a decrease in the metal removal.
This effect can be explained as follows: at low metal/sorbent ratios, there are a number of sorption sites in Chelex 100 structure. As the metal/sorbent ratio increases, sorption sites are saturated, resulting in decreases in the sorption efficiency.
0 20 40 60 80 100 120 140 160 -5
-4 -3 -2 -1 0
ln
[
1
/(
1
-F
(t
)
2 )]
Time (min)
0 2 4 6 8 10 12 14
0 1 2 3 4 5
qt
(
m
g
/g
)
t0.5(min0.5)
Steps Adsorption process I Film diffusion II Intraparticle diffusion III Adsorption on active group
III II
Extraction of Hg(II) from aqueous solutions by chelating resin Chelex-100 Section B-Research paper
Figure 6. Effect of initial concentration of Hg(II) on the ion exchange using Chelex-100. Amount of resin 0.1 g, volume of ion-exchange medium 5 mL, T= 20±1°C, stirring = 1000 rpm, initial
pH 5.7 and contact time 180 min.
Adsorption isotherm modeling
For the interpretation of the adsorption data, the Langmuir and Freundlich isotherm models were used (Eqs. (11) and (12)).27,31
(11)
(12)
where
Ce is the equilibrium concentration of mercury
(mmol L-1),
qe is the amount of mercury sorbed on the Chelex
100 (mg g-1),
kL is the Langmuir adsorption constant (L mg-1),
qmax is the maximum amount of mercury that can
be sorbed by the resin,
kF is the Freundlich adsorption constant and n is a
constant that indicates the capacity and intensity of the adsorption, respectively.
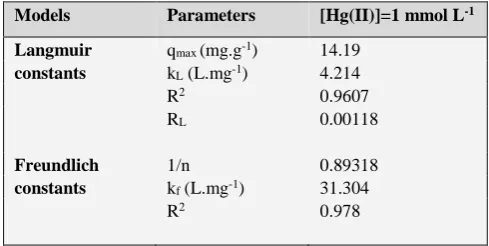
Table 4. Isotherm parameters for mercury adsorption on Chelex 100.
Models Parameters [Hg(II)]=1 mmol L-1
Langmuir qmax (mg.g-1) 14.19 constants kL (L.mg-1) 4.214
R2 0.9607
RL 0.00118
Freundlich 1/n 0.89318
constants kf (L.mg-1) 31.304
R2 0.978
Figure 7. Langmuir plot for the adsorption of mercury(II). Resin quantity 0.1 g, aqueous volume 5 mL, initial pH 5.7, time of contact 180 min.
Figure 8. Freundlich plot for the adsorption of mercury(II). Resin quantity 0.1 g, aqueous volume 5 mL, initial pH 5.7, time of contact 180 min.
For the two studied systems, the Langmuir (Ce/qe versus
Ce) plot was found to be linear in the concentration range of
0.008– 0.197 mg L-1 and the correlation coefficients were
extremely high (R2 > 0.96). In this concentration range, the
Freundlich isotherm correlated better than Langmuir (R2 >
0.98) isotherm with the experimental data from adsorption equilibrium of mercury ions by chelating resin, suggested a monolayer adsorption.
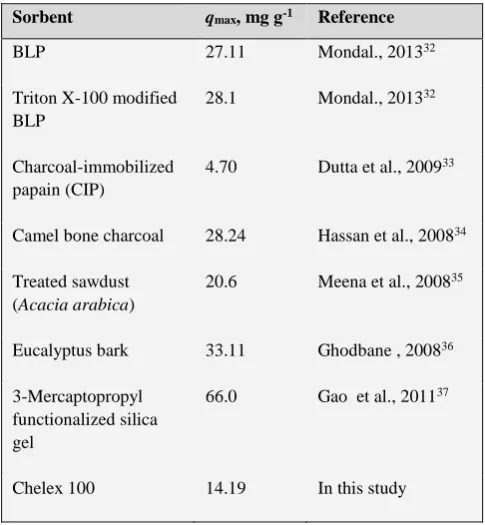
The maximum adsorption values were 14.19 (mg g-1)
which is acceptable accordance with experimentally obtained values (13.03 mg g-1).
Initial pH effect
The retention of mercury(II) on resin was studied in the pH range from 1.66 to 10.0 and the results obtained are shown in Fig. 10.
From Fig. 10, it was observed that the sorption was strongly pH-dependent. The maximum sorption capacity takes place at pH 5.7.
0,0 0,2 0,4 0,6 0,8 1,0 75
80 85 90 95 100
E
x
tr
a
c
ti
o
n
y
ie
ld
,%
[Hg]
0, mmol/L
e e
e max L max
e f e
1
1
log log log
C C
q q K q
q k C
n
0,00 0,02 0,04 0,06 0,08 0,10 0,12 0,14 0,16 0,018
0,020 0,022 0,024 0,026 0,028
Ce /qe
(
m
g
/L
)
Ce (mg/L)
-2,2 -2,0 -1,8 -1,6 -1,4 -1,2 -1,0 -0,8 -0,6 -0,4
-0,2 0,0 0,2 0,4 0,6 0,8
L
o
g
qe
Extraction of Hg(II) from aqueous solutions by chelating resin Chelex-100 Section B-Research paper Table 5. Comparison of maximum capacities of various sorbents
materials for Hg(II) ions sorption
Sorbent qmax, mg g-1 Reference
BLP 27.11 Mondal., 201332
Triton X-100 modified BLP
28.1 Mondal., 201332
Charcoal-immobilized papain (CIP)
4.70 Dutta et al., 200933
Camel bone charcoal 28.24 Hassan et al., 200834
Treated sawdust (Acacia arabica)
20.6 Meena et al., 200835
Eucalyptus bark 33.11 Ghodbane , 200836
3-Mercaptopropyl functionalized silica gel
66.0 Gao et al., 201137
Chelex 100 14.19 In this study
The equilibrium sorption capacity was minimum at pH 1.6 (1.48 mg g-1) and increased up to pH 2.6 (11.83 mg g-1),
reached maximum (13.03 mg g-1) at pH 5.7. This sorption
trend can likely be ascribed to the effect of competitive binding between Hg(II) and hydrogen ions for the binding sides on the surface of the resins. At low pH, an excess of hydrogen ions can compete effectively with Hg(II) for bonding sites, resulting in a lower level of Hg(II) uptake. This increase is rational for Chelex-100 because the exchanger being weakly acidic, is practically in the hydrogen form at pH 2 and is gradually converted into metal form as the pH was increasing.20 The percentage of ion
exchange decreases rapidly when the pH is increased above 6.0 due to the formation of of soluble hydroxilated compound (Hg(OH)2), at higher pH values.38 Several
authors have reported maximum biosorption of mercury by different biomasses at pH 5.7 or near values.38,39
Figure 9 give, the functional group of the resin is present in four forms depending on the pH. A pHi = 5.7 is the shape
(c) predominates. The complex formed between the resin and mercury(II) is shown in (Fig. 11).
Figure 9. Different forms of the resin Chelex 100 depending on the pH
Figure 10. Effect of initial pH for efficient extraction of mercury ion. Amount of resin 0.1 g, volume of ion-exchange medium 5 mL,
T= 20±1°C, stirring = 1000 rpm, initial concentration of Hg(II) 1
mmol L-1 and contact time 180 min.
Iminodiacetic acid is diprotic in nature and in the resin has two different exchange sites in its acetate groups with different selectivity for hydrogen. At initial pH=5.7, the form (c) (Fig.8) was predominant. For this, mercury(II) forms 1:1 complex with Chelex-100 and releases two hydrogens (see Fig.10).
CH2COO
-│ \
Ø–CH2NH
+,Cl
-Hg
2+│ /
CH2COO
-Figure 11. Complex structure " Chelex-Hg". Initial pH = 5.7.
Amount of resin
The effect of varying doses of the adsorbent Chelex 100 was investigated using 1 mmol L-1 of mercury(II)
concentration. Fig. 12 shows an increase in the percentage of extraction of mercury with the increase in dose of the adsorbents up to certain limit and then the rate of change in increase becomes negligible.
The increase in the adsorption with increasing doses of adsorbent is likely due to increase in adsorbent surface area and availability of more adsorption sites. The optimum adsorbent dose is found to be 0.125 g of resin, the optimal amount of resin will be choosen at 0.1 g for ameliorate the extraction by the another effects.
Effect of ionic strength
The effect of ionic strength on mercury(II) sorption was studied by stirring 0.1 g of Chelex 100 resin with increasing NaCl amount, in the aqueous solutions, from 0.001 to 0.073g. Results are summarized in Fig. 13 and shows that the influence of the ionic strength on sorption of mercury is important.
(a) (b) (c) (d)
CH2COOH CH2COOH CH2COO- CH2COO
│ │ │ │
Ø–CH2–NH+ Ø–CH2NH+ Ø–CH2–NH+ Ø–CH2–N
│ │ │ │
CH2COOH CH2COO- CH2COO- CH2COO
pH 2.21→ pH 3.99 → pH 7.41 → pH 12.30
0 2 4 6 8 10
0 20 40 60 80 100
E
xt
ra
ct
io
n
y
ie
ld
,%
Extraction of Hg(II) from aqueous solutions by chelating resin Chelex-100 Section B-Research paper
Figure 12. Effect of amount of resin on the ion exchange of Hg(II) using Chelex-100. Initial concentration of Hg(II) 1 mmol L-1,
volume of ion-exchange medium 5 mL, T= 20±1 °C, stirring = 1000 rpm, initial pH 5.7 and contact time 180 min.
The calibration graph was established using standard solutions of sodium. The graph is linear (not showed) in the range between 0.029 and 4.0 mg L-1. The calibration
equation of standard sodium is:
It is evident in Fig. 13, that there is a positive impact on increasing of extraction yield of Na+ at concentration from 0
to 0.03 g. Before this concentration, the quantity of Na+ after
extraction decreased in solution. It seems that the presence of Na+ at concentration lower than 0.03 g has a negative
effect on Hg2+ adsorption.
Figure 13. Effect of NaCl concentration on the extraction yield. Initial concentration of Hg(II) 1 mmol L-1, amount of resin 0.1 g,
volume of ion-exchange medium 5 ml, T= 20±1°C, stirring = 1000
rpm, initial pH 5.7 and contact time 180 min.
The form of sodium complex at a higher concentration of sodium chloride is agreement with the one given by the CHEAQS V.L20.1. In fact, the increase of NaCl concentration, shows that the free sodium passes from 99.95 % to 93.96 % (ratio = 0.94) and the free Hg2+ passes
from 91.67 % to 13.72 % (ratio = 0.15). The quantity of free sodium is higher than the quantity of free mercury (Na+/Hg2+ = 6.26), so the sodium is extracted.
Conclusions
A commercial resin the Chelex 100 was tested on mercury(II) extraction. The extraction efficiency was determined as a function of various parameters such as time, pH, mercury concentration, amount of resin and ionic strength effect. The experimental capacity obtained is 14.19 mg g-1.
The kinetics of mercury(II) adsorption on resin follows the pseudo-second order kinetic model. The equilibrium isotherm for sorption of the investigated metal ions has been modeled successfully using the Langmuir and Freundlich isotherm.
Kinetics of Hg(II) adsorption from the solution of HgCl2
on Chelex 100 resin is controlled by the film and particle-diffusion process. The effective diffusivity of Hg(II) removal for all the adsorbent was of the order of 10−9 m2 s-1
which suggested chemisorption of the process.
The maximum sorption of mercury(II) took place in the initial pH at 5.7 and the mercury(II) concentration range of 0.5 and 1mmol L-1, the presence of NaCl (above 0.05 mmol
L-1) increases the extraction efficiency.
The results of this study show that the Chelex 100 is an effective’s adsorbant for extraction of mercury(II) from aqueous solution.
References
1Inbaraj, S. B., Wang, J. S., Lu, J. F., Siao, F. Y., Chen, B. H., Bioresour. Technol.,2009, 100, 200–207.
2Fábrega, D. M. F., Mansur, B. M., Hydrometallurgy, 2007,87,
83–90.
3Chiarle, S., Ratto, M., Rovatti, M., Water Res, 2000, 34(11),
2971-2978.
4Starvin, A. M., Rao, P. T., J Hazard Mater, 2004, B113, 75–79. 5Staden, V. J. F., Taljaard, R. E., Talanta,2004, 64, 1203–1212. 6Meera, R., Francis, T., Reddy, M. L. P., Hydrometallurgy, 2001,
61, 97–103.
7Costa Luciana, C., Gomes Ailton, S., Coutinho Fernanda M. B.,
Teixeira,V. G., React. Funct. Polym., 2010, 70, 738–746.
8Takagai, Y., Shibata, A., Kiyokawa, S., Takase, T., J. Colloid Interfac. Sci., 2011, 353, 593–597.
9Xiong, C., Yao, C., Chem. Eng. J., 2009, 155, 844–850.
10Hakim, L., Sabarudin, A., Oshita, K., Talanta, 2008, 76, 1256–
1260.
11Neagu, V., Cornelia, L., Simina, S., Ştefan, M., I. Untea, I., React. Funct. Polym., 2007, 67, 1433–1439.
12Maa, N., Yang, Y., Chen, S., Zhang, Q., J. Hazard. Mater., 2009, 171, 288–293.
13Ji, C., Song, S, Wang, C.,Sun,C., Qu, R., Wang, C., Chen, H., Chem. Eng. J., 2010, 165, 573-580.
14Soliman M .E., Saleh, B. M., Ahmed, A. S., Anal. Chim. Acta, 2004, 523, 133- 140.
15Rajesh, N., Gurulakshmanan, G., Spectrochim. Acta A, 2008, 69,
391–395.
0,000 0,005 0,010 0,015 0,020 0,025 0,030 0,5
1,0 1,5 2,0 2,5 3,0 3,5
E
x
tr
a
c
ti
o
n
y
ie
ld
o
f
N
a
+ , (
m
g
/L
)
NaCl mass, g
0,04 0,06 0,08 0,10 0,12 0,14 0,16 0,18 0,20 0,22 65
70 75 80 85 90 95 100
E
x
tr
a
c
ti
o
n
y
ie
ld
,%
Amount of resin,g
17.25 Na 2.1705
Extraction of Hg(II) from aqueous solutions by chelating resin Chelex-100 Section B-Research paper 16Zhang, Y., Kogelnig, D., Morgenbesser, C., Stojanovic, A., Jirsa,
F., Lichtscheidl-Schultz, I., Krachler, R., Li, Y., Keppler, B. K., J. Hazard. Mater., 2011, 196,201-209.
17Mondal, D. K., Nandi, B. K., Purkait, M.K., J Environ Chem Eng,
2013, 1(4), 891-898.
18Sarwghadi, M., Nedaie, M., Taherian, A., Ghaznavia, A.,
Eftekhari, A., Bandegharaei, A. H., Hosseini, M. S., Jalalabadi, Y., Chem Eng J, 2011, 168, 1163–1173.
19Wen, L-S., Jiann, K-T., Santschi, P. H., Marine Chem., 2006, 101,
104–129.
20Gode, F., Pehlivan, E., J. Hazard. Mater., 2006,B136, 330–337. 21Lin, L-C., Juang, R-S., Chem Eng J, 2007, 132, 205–213. 22Wu. R. S. S., Lam, K. H., Lee, J. M. N., Lau, T. C., Chemosphere,
2007, 69, 289–294.
23Etou, A., Bai, S., Saito, T., Noma, H.,Okaue, Y., Yokoyama, T., J. Colloid Interfac. Sci., 2009, 337, 606–609.
24Kirsty, P., McCallum, N., Welch, L., Forensic Sci. Int., 2012, 6,
282–285.
25Ho, Y-S., Scientometrics, 2004, 59 (1), 171-177.
26Haerifar, M and Azizian, S., J. Phys. Chem. C, 2013, 117,
8310−8317.
27Barkakati, P., Begum, A., Das, M. L., Chem. Eng. J., 2010, 161,
34–45.
28Ferrah, N., Abderrahim, O., Didi, M.A., Villemin, D., Desalination, 2011, 269, 17–24.
29Manouchehri, N., Bermond, A., Anal. Chim. Acta, 2006, 557,
337–343.
30Biswajit, S., Sudip, K, D., Colloid Surface B, 2011, 84, 221–232. 31Kadous, A., Didi, M. A., Villemin, D., J. Radioanal. Nucl. Chem.,
2011, 288(2), 553 – 561.
32Mondal, B. C., Das, A. K., Anal. Chim. Acta, 2003, 477, 73-80. 33Dutta, S., Bhattacharyya, A., De, P., Ray, P., Basu, S., J. Hazard.
Mater., 2009, 172, 888–896.
34Hassan, S. S. M., Awwad, N. S., Aboterika, A. H. A., J. Hazard. Mater., 2008, 154, 992–997.
35Meena, A. K., Kadirvelu , K., Mishra, G. K., Rajagopal, C.,
Nagar, P. N., J. Hazard. Mater., 2008, 150, 604–611.
36Ghodbane, I., Hamdaoui, O., J. Hazard. Mater., 2008, 160, 301–
309.
37Gao,Y., Canck, E. D, Leermakers, M., Baeyens, W., Van Der
Voort, P., Talanta, 2011, 87, 262– 267.
38Sari, A., Tuzen, M., J. Hazard. Mater., 2009, 171, 500–507. 39Bayramoğlu, G., Tuzun, I., Celik G., Yilmaz, M., Yakup Arica,
M., Int. J. Miner. Process, 2006,81, 35–43.