Proceedings of the
12th International Workshop on Graph Transformation
and Visual Modeling Techniques
(GTVMT 2013)
A Case Study on Graphically Modelling and Detecting Knowledge
Mobility Risks
Mark Micallef, Christian Colombo
14 pages
Guest Editors: Matthias Tichy, Leila Ribeiro
Managing Editors: Tiziana Margaria, Julia Padberg, Gabriele Taentzer
A Case Study on Graphically Modelling and Detecting Knowledge
Mobility Risks
Mark Micallef1, Christian Colombo2
1[email protected] 2[email protected]
Department of Computer Science University of Malta, Malta
http://www.um.edu.mt/ict/cs/pest
Abstract:As the world continues to increasingly depend on a knowledge economy, companies are realising that their most valuable asset is knowledge held by their employees. This asset is hard to track, manage and retain especially in a situation where employees are free to job-hop for better pay after providing a few weeks’ no-tice to their employers. In previous work we have defined the concept of knowledge risk, and presented a graph-based approach for detecting it. In this paper, we present the results of a case study which employs knowledge graphs in the context of four software development teams.
Keywords:Knowledge Modelling, Knowledge Risk, Knowledge Maps
1
Introduction
Today’s global economy is very different to what it was a few decades ago. Technological advancements have lead to ever increasing interdependence between national economies as well as the emergence of so calleddisruptive innovations1. With global markets constantly looking out for the next big thing, there is an increased focus on innovation across the world of business and as a result there is a strong dependence on so called knowledge workers. These workers are valuable employees whose primary role is to create, transfer and apply knowledge in order to help their employers stay ahead of the competition. Such employees can be highly mobile and when they leave, companies not only lose human capital, but also accumulated knowledge [DH03]. As a result, companies are realising that their whole business is pretty much locked away in the minds of employees. The protection of this knowledge should therefore be a priority. Consider a software development organisation employing a single team of three people: Jane, Chris, andMary. The company has also identified seven knowledge assets as being of value to it: Java, Smalltalk, OOP, SQL, JDBC, Servlets, and Web Development. The team members are knowledgeable about different topics with some members being more knowledgeable than others on particular topics. No other information about the knowledge landscape is readily available to the management of the organisation. This scenario illustrates a typical scenario in a knowledge-based company whereby collective knowledge is utilised to achieve the company’s goals but the
1These are innovations in terms of products or services which are so revolutionary that they completely change the
visibility into who knows what and ‘how much’ they know can be sketchy at best. This leads to a situation whereby an imbalance of knowledge builds up such that a handful of employees have a monopoly on critical knowledge; putting the organisation at risk of loosing invaluable knowledge should certain employees leave the organisation.
Knowledge risk is defined as“operational risk that is caused by a dependency on, loss of, unsuccessful intended or unintended transfer of knowledge assets and results in a lack of, or non-exclusivity of these assets”[BM06]. Although companies are increasingly aware of the im-portance of knowledge as an asset, this knowledge is rarely shared, swapped, traced and fertilised to ensure that it remains, at least in part, with the firm when employees leave [DH03]. When an employee does hand in her notice, managers usually spring to action, doing their best to cap-ture her knowledge by means of knowledge transfer activities such as exit interviews [Bra98]. At this point however, such activities may be too late to have any meaningful effect at best and disruptive to other employees at worst. Maier [Mai07] identifies five causes of knowledge risk as dependency,limited quality,insufficient transfer,loss of knowledge, anddiffusion of knowledge. This is not to say that these issues are not addressable, but the key challenge is detecting knowl-edge risk with an organisation in the first place. The work presented here detects risk caused be dependency, insufficient transfer and loss of knowledge.
The field of knowledge management is concerned with the management of organisational knowledge and the various risks associated with it. Far from being an exact science, the field is split into a number of schools, each bringing their own approach to managing organisational knowledge. Earl [Ear01] classifies knowledge management strategies into three broad schools of thought: technocratic,behaviouralandeconomicwith each having a number of sub-schools associated with them. We base our work on thecartographicschool of thought, a technocratic school2. Cartographic schools address knowledge risk by focusing on connectivity and leading knowledge seekers to knowledge providers. This is usually achieved by a yellow-pages style directory, listing experts about various knowledge assets.
Our idea is that of extending this principle to include information about the level of familiarity of every person with every knowledge asset in the organisation and representing the information graphically using a graph structure. In [CM11] we presented the notion of a graph-based rep-resentation of an organisation’s knowledge landscape which we formalised in [MC11]. In this paper we present the results of a three month case study aimed at evaluating the utility of using our graphical representation of organisational knowledge to detect and mitigate knowledge mo-bility risk. The rest of the paper is organised as follows. Section2provides an overview of our visualisation technique and how it can be used. Section3presents the results of our case study whilst Section4discusses related work. Finally, Section5draws conclusions and outlines our plans for future work in the area.
2
Graphical Cartographic Knowledge Maps
Consider again the scenario ofJanefrom the previous section; whilst the scenario is simplistic in nature, it presents enough information for a concerned manager to start asking questions such as
2Technocratic schools of knowledge management utilised information or management technologies to support
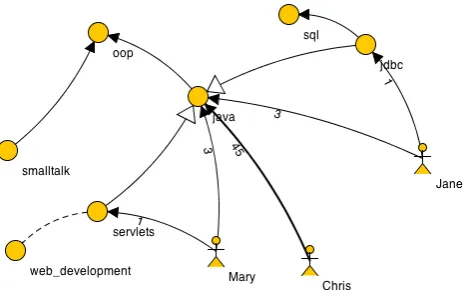
Figure 1: A visualisation of a typical knowledge scenario (described in the introduction).
“who knows what within the organisation?”,“what level of knowledge does each person have of critical knowledge assets?”,“if Jane leaves the organisation, what knowledge will we lose?’, and so on. This link may be useful for activities such as training design, knowledge gap analysis and hiring in of new employees. We propose that by using graph-based modelling, we can provide a means of visualising this information in the form of knowledge maps. Furthermore, once these knowledge maps are constructed, established techniques from graph theory can be used to highlight areas of risk in a company’s knowledge landscape. Figure1depicts a visualisation of the scenario described in the example.
As can be seen in Figure 1, our visualisation consists of a graph with two types of vertices: knowledge assetsrepresented as circles andpersonsrepresented as stick figures. We also rep-resent relationships, dependencies and inheritance between knowledge assets as dashed edges, edges with a solid arrowhead and edges with a hollow arrowhead respectively. Edges between person nodes and knowledge assets indicate that the person knows the knowledge asset to some extent. Magnitute attributes (shown as number on knowledge relationship edges) as well as the thickness of the edge provide relative indications of how well a person knows an asset. The reader is referred to [CM11] for further detail about the notation.
2.1 Maintaining the Knowledge Landscape
application of that knowledge over a prolonged period of time would result in the magnitude of the knowledge relationship being increased as the employee’s familiarity with it increases. Conversely, if an employee does not utilise a particular knowledge asset for a certain amount of time, then she could start to lose familiarity with that asset. We argue that the collective effect of routinely logging a variety of events over time should result in a knowledge map that closely represents the actual organisational knowledge landscape. Whilst our current approach involves a team having to manually log these events in a specifically-designed tool, one can envisage enhancements whereby events are logged automatically from various sources such as bug tracking databases, company intranet posts, training databases, source code repositories, etc.
2.2 Graphically Detecting Mobility Risk
As a knowledge map grows over time, it is likely to become complex and increasingly difficult to analyse visually. It would be useful for an analyst to be able to filter out all the noise in a knowl-edge map and be allowed to focus on areas of risk. To this end, we designed two metrics which analyse the social attributes of vertices in a knowledge map such that they are able to identify areas of the knowledge map which are susceptible to mobility risk [MC11]. We define these as knowledge asset mobility risk (KMR)andperson mobility risk (PMR). KMR refers to the level of risk associated with a company’s knowledge of a particular knowledge asset being compro-mised because its knowledge is not adequately spread amongst employees whilst PMR identifies individuals in the company whose knowledge is so influential that their departure would consti-tute a significant loss for the company’s knowledge landscape. Both metrics are adaptations of centrality metrics presented by Botafogo et al. [BRS92] which measure the social importance of vertices in a graph. However, Botafogo’s work calculated centrality based on the length of paths between pairs of vertices. This is not suitable in our context because (a) the maximum length of a knowledge path between a person and a vertex is 1 and (b) knowledge relationships exhibit a magnitudeproperty which must be taken into account.
Definition 1 Given a graph g with k1, ...,kn knowledge asset vertices and p1, ...,pm person
person vertices, then theknowledge distance matrix Mfor the graph is defined as an×mmatrix:
Mn0,m0 = (
K ifknows(g,pm0,kn0) =0 maxKM
knows(g,pm0,kn0) otherwise
whereK is a constant which represents infinity in the graph. Throughout this paper,K will be maxKM+1. maxKMis the highest knowledge magnitude assigned to knowledge relationships in the graph. This is used as a normalising value whereby a simulated path distance of 1 is assumed for knowledge relationships ofmaxKM magnitude. All smaller values of magnitude will be translated to a proportionately larger path size. This allows us to use centrality metrics.
Definition 2 Given a knowledge distance matrixMrepresentingk1, ...,knknowledge asset
ver-tices and p1, ...,pmperson person vertices, we define theknowledge in distance (KID)and the
knowledge out distance (KOD) for each person vertex as follows: KID(kn0) =∑m
i=1Mn0,i and
KOD(pm0) =∑ni=1Mm0,i.
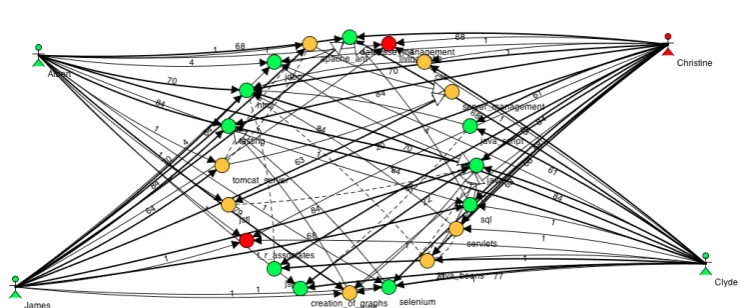
Figure 2: A more complex knowledge map with knowledge asset vertices coloured according to KMR values and person vertices coloured according to PMR values.
Definition 3 At this point we can define the metrics forknowledge asset mobility risk (KMR) andperson mobility risk (PMR)as:KMR(kn0) = KD
KID(kn0) andPMR(pm0) =
KOD(pm0)
KD .
The higher the value of KMR for a particular knowledge asset, the more at risk it is of being lost due to personnel movements. Similarly, the higher the value of PMR for a particular person, the more knowledge the company stands to loose if the person leaves.
To aid risk analysis, one can make risk visible by representing the values of PMR and KMR as colours on a visualisation of a knowledge map such that different colours point to different levels of risk. In Figure2, this is done be representing areas of low, medium and high risk with the colours green, yellow and red respectively. This immediately draws an analyst’s attention to the areas of risk and subsequent filtering would eliminate all the noise and allow one to analyse the root causes for the high risk values of individual vertices. An example of this is given in Figure
3. This filtered map clearly shows why the knowledge assets in question where considered to be exposed to mobility risk.
3
Case Study
Figure 3: An example of a filtered knowledge map showing only high knowledge mobility risk assets.
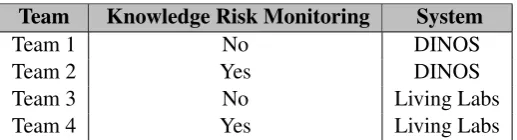
Team Knowledge Risk Monitoring System
Team 1 No DINOS
Team 2 Yes DINOS
Team 3 No Living Labs
Team 4 Yes Living Labs
Table 1: Team product and process assignments.
(DINOSandLiving Labs) in return for the right to use any developed software for commercial purposes. Each software system was developed twice by separate teams as outlined in Table1. This provided a common platform on which to compare knowledge risks exhibited by teams who tracked knowledge risk with those who did not.
In accordance with the required academic effort, participants were required to work together for at least nine hours a week with any particular time slot being not less than two hours. They were supported by means of preparatory workshops, lab facilities reserved for their exclusive use, a team wall, access to an actual industry customer, and a process coach who facilitated their meetings and answered process-related questions.
The semester comfortably accommodated four iterations of two weeks each and an additional iteration zero3 for setup purposes. The case study therefore consisted of two weeks in which various workshops were organised4, an iteration zero, four iterations of two weeks each, and finally two weeks in which to wrap up the project and produce and required reporting.
3In agile development, the termiteration zerois used to refer to an iteration of work in which the project infrastructure
is set up without the expectation of any functionality being delivered to the customer.
4Workshops introduced students to agile development, unit testing, continuous integration, automated web testing
As a minimum commitment, the customer agreed to attend iteration planning meetings, show cases and also be on site for one hour a week with each team. Telephone, e-mail and instant messaging details of the customer were also made available to participants who were told they could contact him whenever required. Additionally, a virtual learning environment was set up with workshop material and space for the customer to upload relevant documentation.
3.1 Context Factors
Williams et al. [WKLA04] propose a benchmark measurement framework that enables researchers to express the context of studies being carried out. This work has been adopted by a number of studies concerning XP such that studies can be compared and contrasted through a number of context factors. Williams et al. use their framework to compare and contrast successive iterations of the same project within a study. In the context of this research however, the framework is used to compare and contrast the circumstances of four different projects at the beginning of the re-search exercise. As recommended by Williams et al., each team’s context was profiled according to (1)sociologicalfactors such as team size, education level and domain expertise; (2) project-specificfactors such as the amount of user stories, the nature of the domain and the duration of the project; (3)ergonomic factors such as the physical workspace layout, distraction level and nature of customer communication; (4)technologyfactors including methodology, programming language and the level of reuse; and finally (5)geographicfactors consisting of team location, customer cardinality and customer location. The contexts were compared and apart from in-tentional differences in process and technology factors for teams who tracked knowledge risk, they were found to be homogeneous in all aspects that could affect the answers to the research questions.
3.2 Tool Support
A purposely designed tool (see Figure4) was developed and made available to teams who were tracking their knowledge risk throughout the project. The tool allowed teams to define knowledge assets and relationships between the various assets. It also enabled participants to log particular events such that knowledge relationships between individual participants and knowledge assets could be calculated automatically. Furthermore, the tool provided analytical capabilities such as filtering and knowledge risk visualisation which made the tracking of knowledge risk easier.
3.3 Results relating to RQ1
Figure 4: A screenshot of the knowledge modelling tool developed for the case study.
Perceived accuracy of... Avg Score Comment
Knowledge relationships 4.3 Agree Knowledge rel magnitudes 3.6 Weak Agree
Knowledge metrics 3.9 Agree
Table 2: Results of perceived accuracy questions
the average scores for the survey. For example with regards to the questions related to the accu-racy conclusions about knowledge relationships regardless of magnitude, the results are highly encouraging. Teams scored a high level of agreement with statements like “Jack is the only per-son who knows PHP” with the average score being4.3(agree). This indicates that the proposed technique effectively models who knows what within the organisation.
disagreement.
Finally, we analysed the accuracy of conclusions drawn by analysing knowledge maps with vertex colouring representing knowledge mobility risk values. A typical conclusion in this regard would be “if Jack leaves the team, our knowledge of web development will suffer”. Statements designed to gauge the validity of such conclusions scored an average of3.9 (agree). Although this is a positive score, an issue was noted whereby the granularity of knowledge representation and ‘size’ of individual knowledge assets (e.g. knowledge a simple task vs knowledge of a large knowledge area) affected the accuracy of these conclusions. For example, learning a ‘small’ knowledge asset such as the JDBC API did not require much effort and in most cases, a few minutes of practice would render anyone competent in the area. In such cases, very few events were logged against the assets and thus unrealistically indicated a relative knowledge risk in the grander scheme of things.
3.4 Results relating to RQ2
In this part of the evaluation, we were interested in looking for evidence that participants were conscious of knowledge risk and were taking steps to mitigate it. We were also interested in com-paring and contrasting this awareness between teams who were maintaining knowledge maps and those who were not. The question was answered using a combination of Truck Factor Analysis and Knowledge Map Analysis
3.4.1 Truck Factor Analysis
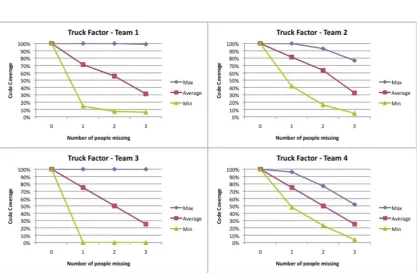
Since only two of the teams were maintaining knowledge maps, an alternative source of data was needed to compare and contrast risk between all four teams. Thetruck factormetric [ZSK+10] was used for this purpose. This metric originates from the field of software development and is (somewhat morbidly) defined as “the number of people on your team that have to be hit with a truck before the project is in serious trouble” [ZSK+10]. Calculation of the truck factor for a project involves analysing a team’s source control repository5 and for each file, counting the number of different team members who have committed the file to the repository over its life time. This is then plotted on a line graph showing the best case, worst case and average scenario of loosing a certain number of people from the team. Truck factor metrics for each team were calculated and plotted in Figure5.
Figure5refers to Teams 1 and 3, which were not maintaining a knowledge map, and Teams 2 and 4, which were . In the case of Team 1, the picture shows a substantial degree of risk. The fact that the best-case (max) scenario is always that of 100% coverage indicates that there is at least one person who has knowledge of all the files in the code base. Also, the fact that the worst case coverage for 1 person being missing is 15% indicates that one person is carrying a dispropor-tionate load in terms of project knowledge. Further investigation revealed that a particular team member had substantial experience with technologies being used and was carrying the team in most of their activities. The worst-case plot on the graph refers to instances of this expert being missing from the team. So long as he is present, then code coverage is decent but the effects of
5A source control repository is a central storage area where teams store their work. Such repositories maintain a log
Figure 5: Truck factor metrics for all four teams in the case study. Teams 2 and 4 tracked knowledge risk whilst Teams 1 and 3 did not.
him not being part of the team would be disastrous. The team has in fact built a risky dependency on this person and in a real-world context, it would be a very costly dependency to have.
3.4.2 Knowledge Map Analysis
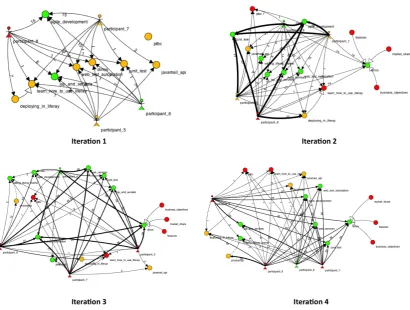
Knowledge map analysis was restricted to the two teams which were maintaining knowledge maps and was concerned with looking for evidence of knowledge risk awareness and mitigation. Within the timeline of the case study, the teams managed to carry out four two-week-long itera-tions. We collected and analysed knowledge maps at the end of each iteration in order to check if knowledge risk was being highlighted. Figure6provides a snapshot of Team 2’s knowledge maps at the end of iterations 1 through 4. By the end of iteration 1, the team had just started identifying knowledge assets of value to them and had started to focus on what they thought was important. Very little knowledge risk was highlighted at this point but as the case study wore on, various knowledge assets started being highlighted as being exposed to knowledge risk. This is evidenced by the occurrence of red vertices and by increasing of KMR and PMR values (not visible in the screenshot). In fact, deeper analysis of events logged during maintenance of the knowledge map indicate that the team was undertaking knowledge transfer activities of knowl-edge assets that were exposed to mobility risk. Whilst this did not results in substantial risk reduction within the context of the case study, sustained efforts over longer periods are likely to have the desired effect. Similar results were observed for Team 4.
3.5 Validity of the Study
As with all case studies, lack of generalisability is the main threat to the external validity of this study. Whilst this can be addressed in the long run by a series of similar studies, the risk was mitigated, albeit marginally, by utilising two pairs of teams, thus in effect running two case studies simultaneously. The second threat to external validity is the use of students as subjects. Whilst students lack technical experience, this particular study was not concerned with technical issues but rather with the knowledge being created and managed by a team. To this end, students participating in the exercise were informed that most of their grade would reflect their level of adherence to process and not the technical quality of their work. Finally, it is worth noting that the study compares results from four largely homogeneous teams of students and does not attempt to make comparisons outside that context. The design of the case study implemented all of Carver et al.’s [CJMS03] seven recommendations regarding the design case studies with student participation.
With regards to internal validity, the main risk involved the fact that we were attempting to measure highly tacit and subjective concepts with no standard benchmark being available for comparison. This was addressed by (1) asking participants to rate accuracy of conclusion against their perception of the team’s knowledge landscape, (2) utilising multiple questions to measure the same concepts, and (3) utilising truck factor analysis for further corroborating the results.
4
Related Work
Figure 6: Snapshots of Team 2’s knowledge map at the end of iterations 1 through 4
5
Conclusions and Future Work
In a global economy that’s increasingly dependent on change and innovation, companies increas-ingly depend on knowledge and knowledge workers to stay ahead of their competition. In such an environment, nurturing and retaining this knowledge is of critical importance. In this paper, we provided an overview of a technique which involves visually representing knowledge assets, employees and various types of relationships between them. Furthermore, we showed how this graphical representation combined with techniques from the field of graph theory can be used to detect knowledge mobility risk when it occurs, thus providing companies with the opportunity to mitigate it. The results of a three-month-long case study with four software development teams were presented which showed that teams using our visualisation were conscious of knowledge risks and were actively taking steps to mitigate it. Conversely, teams which did not use our tech-nique exhibited evidence of being oblivious to mounting knowledge risk whilst focusing solely on producing software for their customer.
In the future we aim to explore this technique further by addressing issues related to main-taining knowledge maps, which surfaced during the case study. We also plan to investigate other metrics related to knowledge management and knowledge risk. For example, the representation allows us to reason about the level of common knowledge between two people. This information is useful in scenarios where knowledge transfer is required since if people have a certain degree of common knowledge, knowledge transfer activities are more likely to be successful. Finally, whilst the three-month case study provided useful insights and encouraging results, we would like to trial the technique out for longer periods of time so as to observe the effects of real-world phenomena such as staff turnover.
Bibliography
[BCM+92] V. R. Basili, G. Caldiera, F. E. McGarry, R. Pajerski, G. T. Page, S. Waligora. The Software Engineering Laboratory: An Operational Software Experience Factory. InProceedings of the International Conference on Software Engineering. Pp. 370– 381. IEEE, 1992.
[BD08] F. U. Bjørnson, T. Dingsøyr. Knowledge management in software engineering: A systematic review of studied concepts, findings and research methods used. Infor-mation and Software Technology50(11):1055–1068, 2008.
[BM06] F. Bayer, R. Maier. Knowledge Risks in Inter-Organizational Knowledge Transfer. In Proceedings of the International Conference on Knowledge Management and Knowledge Technologies. Pp. 76–88. ACM, 2006.
[Bra98] S. Branch. You Hired ’Em. But Can You Keep ’Em? Fortune 138(21):101–103, 1998.
[CJMS03] J. Carver, L. Jaccheri, S. Morasca, F. Shull. Issues in Using Students in Empiri-cal Studies in Software Engineering Education. InProceedings of the International Symposium on Software Metrics. Pp. 239–. IEEE, 2003.
[CM11] E. Cachia, M. Micallef. An event-driven cartographic approach to modelling soft-ware engineering knowledge. In Proceedings of the International Conference on Knowledge Management and Information Sharing. Pp. 18–27. SciTePress, 10 2011.
[DH03] S. B. Droege, J. M. Hoobler. Employee Turnover And Tacit Knowledge Diffusion: A Network Perspective.Journal of Managerial Issues15(1):50–64, 2003.
[Ear01] M. Earl. Knowledge Management Strategies: Toward a Taxonomy.Journal of Man-agement Information Systems18(1):215–233, 2001.
[Mai07] R. Maier.Knowledge Management Systems. Springer, 2007.
[MC11] M. Micallef, C. Colombo. A language for modelling software engineering knowl-edge. Technical report CS2011-02, Department of Computer Science, University of Malta, 2011. Available from http://www.um.edu.mt/ict/cs/research/technical reports.
[WKLA04] L. Williams, W. Krebs, L. Layman, A. Anton. Toward a Framework for Evaluating Extreme Programming. InProceedings of the International Conference on Empiri-cal Assessment in Software Engineering. Pp. 11–20. IEEE, 2004.