Research Article
a
May
2018
Computer Science and Software Engineering
ISSN: 2277-128X (Volume-8, Issue-5)
Development of Dermatological Skin Disease Detection and
Classification based on Wavelet and ANN
Revati Kadu
PG Student, HVPM COET, Amravati, Maharashtra, India
Dr. U. A. Belorkar
Professor. & Head, Dept. of EXTC, HVPM COET, Amravati, Maharashtra, India
Abstract— One of the most common and augmenting health problems in the world are related to skin. The most unpredictable and one of the most difficult entities to automatically detect and evaluate is the human skin disease because of complexities of texture, tone, presence of hair and other distinctive features. Many cases of skin diseases in the world have triggered a need to develop an effective automated screening method for detection and diagnosis of the area of disease. Therefore the objective of this work is to develop a new technique for automated detection and analysis of the skin disease images based on color and texture information for skin disease screening. In this paper, system is proposed which detects the skin diseases using Wavelet Techniques and Artificial Neural Network. This paper presents a wavelet-based texture analysis method for classification of five types of skin diseases. The method applies tree-structured wavelet transform on different color channels of red, green and blue dermoscopy images, and employs various statistical measures and ratios on wavelet coefficients. In all 99 unique features are extracted from the image. By using Artificial Neural Network, the system successfully detects different types of dermatological skin diseases. It consists of mainly three phases image processing, training phase, detection and classification phase.
Keywords— Skin disease, Wavelet Techniques, dermatological , Melanoma color,Artificial Neural Network
I. INTRODUCTION
Computational systems for skin cancer diagnosis have been proposed in order to aid dermatologists in early assessment of such diseases, or even to monitor pigmented skin lesions. Such lesions, which may be classified as benign or malignant, are mainly caused by an abnormal production of melanocyte cells, caused by factors such as excessive sun exposure. Melanocyte cells are responsible for creating the substance melanin, one of the functions of which is to provide pigmentation in the skin. Benign lesions display a more organized behavior than malignant lesions, since the former are not able to proliferate into other tissues. Seborrheic keratosis (Figure 1.1b) and nevus (Figure 1.1a), such as melanocytic, blue, halo, sptiz, dysplastic, Clark, recurrent, reed, congenital, compound, intradermal, junctional, dermal, are examples of benign lesions. In the case of malignant lesions, i.e., skin cancer, the cells split quickly, and may invade other parts o f the body. Indeed, these cells do not die, as generally occurs with normal cells. Skin cancer may be divided into two categories: melanoma (Figure 1.1c) and non-melanoma (Figure 1.1d). Melanoma is the most aggressive form of skin cancer, and also the one with the highest mortality rate, due to its high levels of metastasis. Basal cell carcinoma and squamous cell carcinoma are two examples of non-melanoma skin cancer (NMSC), the most common of all skin cancers. Moreover, these types of cancer have a higher chance of cure than melanoma, since they have a reduced capacity to spread (metastasis) to other parts of the body. The number of skin cancer cases has increased in recent years, and consequently an increasing number of deaths caused by this disease has been reported, particularly by melanoma. Thus, pigmented skin lesions have been a cause of global concern, since some types of benign lesions may become skin cancer, such as dysplastic nevus.
Dermoscopy images as illustrated in Figure 1.1 are widely applied for image analysis of pigmented skin lesions. Such images may be acquired from dermatoscope devices or specific cameras to provide a better visualization of the pigmentation pattern on the skin surface. The identification of regions of the lesion in such images may be performed in order to assist in the process of analysis. Segmentation is an important step that allows the extraction of regions of interest (ROI) within a dermoscopy image. Frequently, the images under analysis are pre-processed for image enhancement and artefact removal, so that more robust segmentations may be achieved.
Image computational analysis of pigmented skin lesions is usually based on the intensities of the pixels within the segmented ROIs. Furthermore, the extraction of representative features of the ROIs under analysis is an important step for the efficient classification of the segmented lesions. In this step, a few common difficulties are:
1) identification of the features to be used; 2) to confirm that the number of selected features is sufficient to describe the classification problem; 3) the number of selected features is too large, which requires high computational resources; and 4) there are unnecessary and/or irrelevant features that should be removed from the features set. Techniques to reduce the dimensionality of the data may be used to solve these problems according to the following reduction strategies: feature transformation (well-known as feature 11 extraction in literature concerning pattern recognition, and feature selection [3].The feature extraction strategy allows the modification of all of the data of the image, in order to emphasize the most effective features, ensuring the correct separation of the classification classes [4]. Such strategy is based on the generation of a new feature space, which may expand or reduce, according to the adopted strategy. The new features may be extracted by means of discovery of missing information from relationships among the features, or even by means of searching for a new feature space with smaller dimensions, through functional mapping. In contrast, new features are not created in the feature selection strategy, meaning that a subset from the original features is selected by using this approach. Both approaches may also be combined in order to achieve a better representation of the features. For example, in cases in which the feature extraction step increases the number of features, feature selection techniques could provide an automatic reduction of such excessive features. Furthermore, a larger feature space may include redundant or irrelevant data [5]. For example, the principal component analysis (PCA) [6], which is a technique for space dimensionality reduction based on basic linear transforms of the input features, has been applied to both feature extraction or feature selection.
Several clinical methods are used by dermatologists in order to diagnose pigmented skin lesions based on their own features. The ABCD(E) rule is a commonly used method to classify such lesions based on Asymmetry, Border, Color, Diameter and Evolution (or Elevation) criteria. Additionally, texture analysis may be performed in order assess the superficial roughness of the lesions. Clinical methods based on pattern analysis are also used to classify features in pigmented skin lesions specifically visible in dermoscopy images. The Seven-point checklist and Menzies’ methods were proposed to simplify the clinical approaches based on pattern analysis methods [7]. Several computational solutions[8] have been proposed for feature extraction and selection of pigmented skin lesions, in order to represent them according to a certain criteria. Such features may be used for the classification process, in order to provide dermatologists with a computer-aided diagnosis of the pigmented skin lesions [9].
The objective of this thesis is the development of a new approach based on ensemble model and feature selection for skin lesion pattern recognition in dermoscopy images, in order to provide information that may assist the dermatologist, as well as to contribute to the CAD area with an increased performance of the automatic diagnosis.
II. PROPOSED WORK
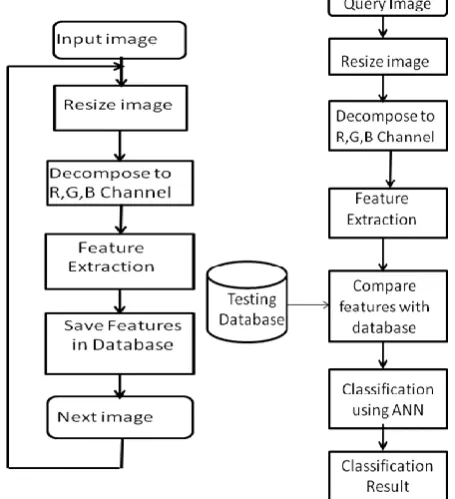
Initially the database is created that contains the 99 features of each image used for the training of classifiers. The special features are identified and calculated for each image and stored in the database along with its category indicator for that features group. While actually testing the performance of the system, the query image i.e. the image to be classified is presented to the system as an input. For the query image, exactly same features are extracted with same procedure that was applied at the time of database creation. Now, the classifiers come into action at this stage which was allowed to train for the known images and specified categories. The classifier uses its training knowledge to classify the given query image into its desired class. First, the ANN classifier is tested for the required purpose, on no. of images belonging to different categories and its performance is recorded. The performance consists of the no. of images that are correctly classified and wrongly classified as well as the time taken for the classification. The classification result of both the classifiers is then analyzed for the given parameters in order to draw the final conclusion.
6.1 Off line process
considered and there feature vectors were stored in the database. The features of all the images constitute the database for the system.
``Fig.2 Online process (a) and offline process (b) for Image classification using ANN
The table 2 shows the image category and image description belonging to each category along with the number of images
Table 2.1 Database of images
Sr. no Category Image Description No. of Images
1 Category-1 Malenoma 47
2 Category-2 psoraisis 29
3 Category-3 Ring worm 30
4 Category-4 Scabies 24
5 Category-5 Vitiligo 31
Fig 3 shows some of the images of category 1 i.e. Malenoma, that were considered for creating the database. The images below are part of the set of images that constitute the database for system.
Fig.3 : Malenoma images from database Fig.4: psoraisis images from database
Fig.7: Vitiligo fr database
III. IMAGE FEATURE EXTRACTION
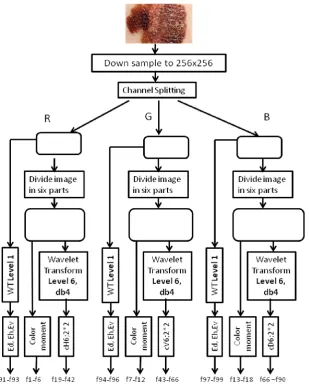
The accuracy of the system behavior is majorly depends on the features used for training of classifier and the classifier structure itself. In this work, the effort is made to present the novel feature extrication method which computes the unique ninety nine features for each image. These features are stored in the database which is used to compare with features of query image for the classification. Figure 6.8 elaborates the complete feature extraction methodology used in this approach.
Figure 8 Image feature extraction methodology
The images available are of different sizes, at first all such images are resized to 256*256 RGB image format. After this, the resized image is then split into three color channels namely R, G and B.
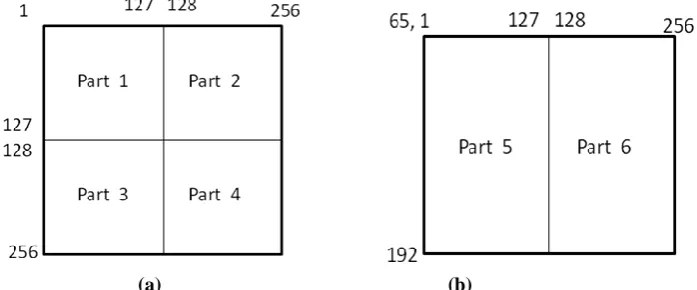
Each channel is then portioned into six parts by spatial segmentation. The derived image channel is segmented into four parts of equal size from 256*256 image pixels. Figure 6.9 (a) shows the range of pixel values that are considered for forming this four parts of an image. Again, the image is spatially segmented into two parts with the range of pixel values as shown in figure 9 (b). In the end, from each channel six spatial parts are obtained.
(a) (b)
Figure 9 (a) Spatial segmentation of image in 4 parts (b) Spatial segmentation of image in 2 parts
Now, for each of these six parts, the color moments are calculated from the formula given as
These color moments constitutes (6*3) eighteen features of an image.
The next step is successive wavelet decomposition of each of the six parts. Each part is decomposed to six levels by db4 wavelet transform. Here, after each decomposition the size of the image gets halved. Therefore starting at 256*256, six level decomposition leads to final image of size 2*2. Thus, this procedure gives the 2*2 matrix of horizontal, vertical and diagonal components for each part of each channel after six level decomposition.
For Red channel, each value of 2*2 matrix of horizontal component for each of six parts is stored as feature values. (6*4)
For Green channel, each value of 2*2 matrix of vertical component for each of six parts is stored as feature values. (6*4)
For Blue channel, each value of 2*2 matrix of diagonal component for each of six parts is stored as feature values. (6*4)
(b)
This process provides (6 parts * 4 values) 24 features for Red, 24 features for Green and 24 features for Blue channel. The total no. of features that are obtained after this complete procedure is ninety nine. All these features are stored as a column vector associated with the category specify corresponding to each image presented to the system for training purpose. Hence this feature extraction process is novel and which special supports the classifier to improve the performance.
The above table 2, contains five categories and the image description for each category .It also gives the number of images considered for training and testing.
Table. 2 Performance matrix for ANN classifier for Training images
Classification Result
Malenoma Psoriasis Ring worm Scabies Vitiligo
Input Image
40/47 1/47 2/47 3/47 1/47
0/29 26/29 1/29 2/29 0/29
2/30 1/30 25/30 2/30 0/30
1/24 0/24 1/24 22/24 0/24
0/31 2/31 1/31 1/31 27/31
distribution for correctly classified images for each category. From table 8.2 it can be concluded that among of 47 images of Malenoma the artificial neural network has accurately classified 40 images in category 1 and 2 images in category 2 and 2 images in category 3, 3 images in category 4 and 1 images in category 5. For category 2, the ANN has classified 26 images correctly in category 2 and wrongly classified 1 images in category 3 and 2 images in category 4.Similarly for category 3, 25 images were correctly classified and 2 images were classified in category 1 and 1 images in category 2 and 2 images in category 4. Similar Classification is shown in table for category 4 and category 5. Thus the above table presents the overall classification performance of ANN classifier for input training images.
Fig.10 Performance of ANN classifier for training images
Table.4 Performance matrix for ANN classifier for testing images
Classification Result
Malenoma Psoriasis Ring worm Scabies Vitiligo
Input Image
12/15 0/15 1/15 1/15 1/15
0/15 13/15 1/15 1/15 0/15
1/15 0/15 13/15 1/15 0/15
1/15 0/15 0/15 14/15 0/15
0/15 1/15 1/15 0/15 13/15
The above table 4 shows the distribution of classification performance of ANN classifier. Here, 15 images belonging to each category were provided as a testing image to system. Malenoma , psoriasis, Ring worm, Scabies, Vitiligo belongs to category 1, category 2, category 3, category 4 and category 5 respectively. The table shows the distribution for correctly classified images for each category. From table 8.3 it can be concluded that among of 15 images of Malenoma the artificial neural network has accurately classified 12 images in category 1, 1 images in category 3, 1 images in category 4 and 1 images in category 5. For category 2, the ANN has classified 13 images correctly in category 2and wrongly classified 1 image in category 3 and 1 images in category 4.Similarly for category 3, 13 images were correctly classified and 1 images were classified in category 1 and 1 images in category 4. Similar Classification is shown in table for category 4 and category 5.Thus the above table presents the overall performance of ANN classifier for input training images
Table. 5 Accuracy comparison of ANN
ANN
Training(%) Testing(%)
Category 1 87.23 80.00
Category 2 89.66 86.67
Category 3 83.33 86.67
Category 4 91.67 93.33
Category 5 87.10 86.67
The above table 5 shows the comparison accuracy of artificial neural network for training and testing of images. The artificial neural network has a training accuracy of 87.23% for category 1, 89.65% for category 2 and 83.33% for category 3 ,91.66% for category 4 , 87.09% for category 5 whereas for testing it has accuracy of 80% for category 1, 86.66% for category 2 and 86.66% for category 3, 93.33% for category 4 , 86.66% for category 5. From above table 8.6 it is observed that artificial neural network classifier has better classification accuracy,
The aim of thesis is to present the extensive study of neural network for image classification. The work of proposed classification system is to successfully classify the dermatological image from given database. The main objective of such system is to increase classification accuracy with minimized time required for classification. Accuracy of image classification depends upon some parameter like image features, image quality, color moment and image texture. Perfect extraction of image features gives better classification result.
In this thesis, a classification is made of five categories using Artificial Neural Network. This comparison is based upon their performance classification in terms of classification accuracy. The technique that utilize the statically characteristics of image classification is also briefly introduced. Many traditional classification algorithms take a long time in classification especially when database is very large.
IV. CONCLUSION
In this paper, first ANN classification performance with Daubechies wavelet transform is evaluated. Database which is considered for this study consists of variable images of five different categories of dermatological diseases. These categories contain images of Malenoma, psoriasis, Ring worm, Scabies, Vitiligo. Each wavelet based ANN classifier is applied on images and classification result is studied.
In these work, classification result of ANN classifier is analyzed which is most widely used classification algorithm in present day. Finally we observed classification result of ANN for five different categories. It is found that Db4 based ANN classifier has highest classification result. All comparative classification result is mention in table 8.
REFERENCES
[1] D.N.V.S.L.S. Indira # , JYOTSNA SUPRIYA P , Detection & Analysis of Skin Cancer using Wavelet Techniques, International Journal of Computer Science and Information Technologies, Vol. 2 (5) , 2011, 1927-1932
[2] D.S. Zingade, Manali Joshi,,Skin Disease Detection using Artificial Neural Network ,International Journal of Advance Engineering and Research Development Special Issue on Recent Trends in Data Engineering Volume 4, Special Issue 5, Dec.-2017 @IJAERD-2017,
[3] D.S. Zingade1, Manali Joshi2, Viraj Sapre3, Rohan Giri4 Maglogiannis and C. Doukas. Overview of advanced computer vision systems for skin lesions characterization.IEEE Trans. on Information Technology in Biomedicine,
[4] 13(5):721–733, 2009American Academy of Dermatology, 56(3):417–421, 2007R. E. Sorace, V. S. Reinhardt, and S. A. Vaughn, “High-speed digital-to-RF converter,” U.S. Patent 5 668 842, Sept. 16, 1997.
[5] A. Perrinaud, O. Gaide, L. French, J. Saurat, A. Marghoob,and R. Braun. Can automated dermoscopy image analysisinstruments provide added benefit for the dermatologist? Astudy comparing the results of three systems.
British Journalof Dermatology, 157:926–933, 2007
[7] M. Shamsul Ari n, M. Golam Kibria, Adnan Firoze, M. Ashraful Amin, Hong Yan,"DermatologicalDiseaseDiagnosis Using Color-skin Images", Proceedings of the 2012 International Conference on Machine Learning and Cybernetics, Xian, 15-17 July, 2015
[8] L. G. Kabari and F. S. Bakpo, Member, IEEE, "Diagnosing Skin Diseases Using an Artificial Neural Network", 2016IEEE:
[9] Wasan Kadhim Saa'd, Method For Detection And Diagnosis Of The Area Of Skin Disease Based On Color By Wavelet Transform And Artificial Neural Network, Al-Qadisiya Journal For Engineering Sciences [10] Girish Patil , Karan Belsare, An Approach to Natural Image Classification based on Wavelet Transform and