DDoS Detection and Alerting
University of Amsterdam
MSc System & Network Engineering
Daniel Romão
Niels van Dijkhuizen
February 10th, 2014
Abstract: Distributed Denial of Service attacks are becoming very popular nowadays. The easy access to services and resources that can be used for this purpose, and the high resulting amount of damage, are the main reasons for this. Current detection and mitigation systems are not accurate enough and can be very expensive. Previous research has led to detection methods that even though can be accurate for certain kinds of anomalies, no effective real solution or system has been proposed or made. By analyzing NetFlow data from the core routers of the ISP where this research was done, we defined cat-egories for different kinds of traffic, which are treated in a different way. We created a model for volumetric Distributed Denial of Service attacks detection and we created a statistical method to find optimal thresholds for detection of such anomalies. We individually analyze protocol-port combinations that are either popular or have potential to be used for this kind of attacks, which are handled individually for a more accurate detection. By subtracting the indi-vidually analyzed traffic, we also analyze the remaining traffic for new attacks detection. For traffic where a repetitive behavior over time is observed, we cre-ated baselines from past traffic data, which will adapt over time to mimic the traffic trends. Our method revealed to be particularly effective for repetitive traffic with noise, where the statistically calculated values where a good match, avoiding normal traffic noise while detecting traffic peaks related to anomalies. We developed a prototype in a form of a NfSen plugin, where the results of our analysis were applied.
1
Introduction
A Distributed Denial of Service (DDoS) attack is an attempt to make a machine or network re-source unavailable to its intended users from mul-tiple hosts. These attacks are becoming a serious threat to businesses, institutes and governments. The easy access to services that provide DDoS at-tacks for little or no fee, allow even inexperienced users to generate attacks. Attackers use Botnets and so called DDossers, Booters or Stressers1 for
DDoS attacks in order to saturate the targets band-width. Cloud computing and high bandwidth Inter-net connections are widely available for whatever purpose its users intend and therefore can also be abused for DDoS attacks. DDoS attack techniques change from day-to-day and are not only becoming more frequent, but also more sophisticated. Gart-ner wrote a report2 on the increasing use trend of
the hard-to-detect application layer attacks for the year 2013. The high volume or flooding attacks are currently still the most common ones.
Good attack detection and mitigation systems are very expensive, and are still far from preventing every kind of DDoS attacks on a network. De-tection systems often rely on proprietary deDe-tection schemes. Effective DDoS detection requires active monitoring which is both hard and time consum-ing. As a result a lot of networks are vulnerable to DDoS attacks. Often network administrators only realize that they are being victims of such an attack when systems or networks already have availability issues. In those cases the harm is already done. The core network of our Internet Service Provider3
generates NetFlow4 traffic statistics. Among other
things NetFlow data consists of source and desti-nation IP addresses, IP protocol and UDP/TCP port numbers for both source and destination. This data is fed to Arbor Peakflow to do DDoS detection and traffic ’washing’. NfSen is another tool used to monitor the same NetFlow data. Currently NfSen is configured to monitor flows with fixed absolute threshold values. These are being picked manually by the administrators by ”educated guess”.
The ISP likes to know if steps towards automated mitigation of DDoS attacks can be made. Therefore our main research question is:
“Can we derive DDoS mitigation rules from the available production data in near real-time in order to alert and mitigate?”
In order to answer this question, we define some sub-questions:
• What kind of DDoS attacks can we detect?
• Can we detect them on a near5 real-time ba-sis?
• Can we extract enough information for miti-gation?
By analyzing a part of the ISP’s flow-data, we ex-pect to find patterns for specific traffic. We propose a model for near real-time NetFlow analysis on traf-fic with special interest and for residual traftraf-fic. We will pick out commonly used protocol-port combi-nations as well as combicombi-nations that can be used for amplification and reflection attacks. By catego-rizing this traffic and by looking for correlations we derive rules for anomaly detection. With the cate-gorized traffic and anomaly rules, we expect to be able to detect anomalies more accurately than what is possible with the ISP’s current methods. The rest of traffic statistics will be summed up per trans-port layer protocol in order to detect new types of anomalies. We expect that NfSen provides enough flexibility to implement our model in the form of a prototype plugin to do anomaly detection on a near real-time basis. The system will send out an alert to the administrators when an anomaly occurs. The alert contains the information to perform the actual mitigation.
2
Related Work
DDoS attacks have been subject of several stud-ies, especially during the last few years. Even some practical implementations of detection and mitiga-tion systems were made.
Bhuyan et al. [1] did a comprehensive survey on current DDoS attack architectures and existing de-tection methods, highlighting some open issues, research challenges and possible solutions. Even though it doesn’t provide concrete answers on de-tection of DDoS attacks, the work they did is rele-vant when starting research on this topic.
The DDoS threat spectrum White Paper by David Holmes from F5 Networks [2] also presents relevant information on DDoS attacks. The most common
1http://www.safeskyhacks.com/Forums/showthread.php?39-Top-10-DDoser-s-(Booters-Stressers) 2http://www.gartner.com/document/2320416
3We did our research at a relatively big Dutch ISP
4http://www.cisco.com/en/US/products/ps6601/products_ios_protocol_group_home.html 5Near in our case means around 5 minutes
types of DDoS attacks were characterized accord-ing to profiles. An economical overview is also pre-sented, such as the relation of the cost of attack launch versus incurred cost to target, and the possi-bility of extortion by threatening companies to pay a relevant amount of money if they don’t want to be attacked.
Usually, the high volume DDoS attacks are UDP based. Bardas et al. [3] investigate the assump-tion of a proporassump-tional packet ratio to classify UDP traffic. They assume that regular UDP traffic is received in the same amount that is sent, which is something that according to their experiments, ver-ifies for most of the UDP-based applications. How-ever, the normal behavior of some UDP-based ap-plication will raise false alarms. This method does not detect large scale source IP address spoofing where the traffic is spread across many IP’s. Cho et al. [4] present a baseline traffic model us-ing NetFlow data collected on various points of an ISP network. By looking at the flows per second and bits per second information of the data col-lected, they used the simple linear regression anal-ysis technique to find an optimal relation between those variables that identifies regular traffic. Even though they were successful on detecting some types of attacks, this method revealed to be very limited, and as such, can only be applied to certain kinds of network traffic. It is important to make clear that the baseline model type presented in this paper dif-fers from ours, as will be seen in the later sections. The baseline model presented refers to the flows per second and bits per second ratio, while our baseline is the collected statistics of the amount of various parameters of the traffic, in order to learn what the regular behavior of the traffic is.
Another approach, presented by Jun et al. [5], is to look at the entropy of several parameters of the traffic and define thresholds. The first parameter being analyzed is the total volume of the traffic. If the entropy threshold is achieved, the entropy of the destination IP addresses is assessed. If this second parameter is higher than its threshold, the same is done for the source ports, and if again it is higher than the threshold, the same is done for the source packets. If all of these parameters are abnormal, then a DDoS attack is happening. The first limita-tion regarding this method, is that due to its high sensitivity, it is best used with data collected in a router that is close to a customer (edge router), not on the core routers of an ISP where our research is intended. Also, the efficiency of this detection method is not clear on the paper.
The work done by Chen et al. [6] differs from the previous as it is meant for preventing botnet gen-erated DDoS attacks. Web botnets disguise control messages over HTTP, especially this kind of bot-net attacks can be troublesome to detect. By doing deep packet inspection, they were able to recognize patterns that lead to successful detection of botnets. The deployment of deep packet inspection systems is in many cases not feasible, either due to legal and ethical constraints, or due to resource limitations in high traffic environments.
3
Methods
In order to define a scope for the research project, we took the following parameters and resources into account:
• The data set of the ISP is based on captured NetFlow data with a one on hundred sam-pling;
• The data set can be picked only from a limited period of time (1 month max.);
• Two weeks for experiments and development;
• Development and off-line analysis on a Linux-based VM with non-production like flow-traffic capturing possibilities and full access rights;
• Testing possibilities on a FreeBSD server with production-like flow-traffic. Limited access rights.
The focus of the research will be on statistical net-work anomaly detection. We expect to primar-ily detect flooding attacks, which include amplifi-cation and reflection attacks. These volume-based methods should be detectable with a statistical ap-proach. Figure 1 shows the topology of the data collection and analysis system, in which our proto-type will reside. The NetFlow data is transmitted by the core routers of the ISP. This data is collected by machines running NfCapd6, which stores the
in-formation of the flows. To analyze this inin-formation, NfDump6 can be used, or in a visual way with
Nf-Sen7.
6http://nfdump.sourceforge.net 7http://nfsen.sourceforge.net
3.1
Model
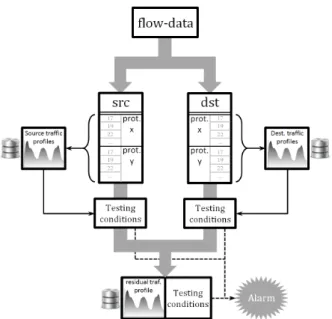
In order to do near real-time anomaly detection, we propose a model that can be either used in a cen-tralized or decencen-tralized set-up. Figure 2 shows a schematic view of our model. Captured NetFlow data will be split up into source and destination traffic and statistical values will be registered for a profile within a short interval. For accurate analy-sis, we decided to split the traffic up inprofiled traf-fic and the non-profiled traffic. The profiled traffic includes all the protocol-port combinations that will be subject to individual analysis.
Figure 1: Network and Services topology
By creating profiles for certain protocol-port com-binations (such as DNS/UDP, NTP/UDP, ...), we can individually monitor the protocols that are cur-rently popular for DDoS attacks, or that have po-tential for this purpose. The statistical values in-clude the amount ofFlows,Packets and Bytes.
The captured statistics of a profile are stored in a database (this is sometimes referred to as a base-line) in order to do time-series data analysis. Anal-ysis can be done fast in this way, because there is no need to keep track of each individual flow and therefore the amount of queries on the flow-data will be limited.
Figure 2: Model for DDoS detection The NetFlow values for a profile can be tested against a set of conditions in order to detect an anomaly. When such is detected, an alarm will be raised until the anomaly is no longer applicable for that specific profile. All statistics of the pro-files are summed up into totals and destination and source traffic are combined per transport layer pro-tocol (UDP, TCP and ICMP). These values will be subtracted from the rest of the transport layer pro-tocols in order to get the residual statistics of each transport layer protocol. This residual transport layer protocol traffic will be called non-profiled. A set of conditions will again be applied on these val-ues in order to detect potential new network appli-cation abuse, and an alarm will be raised in case of anomaly detection.
3.2
Data Analysis
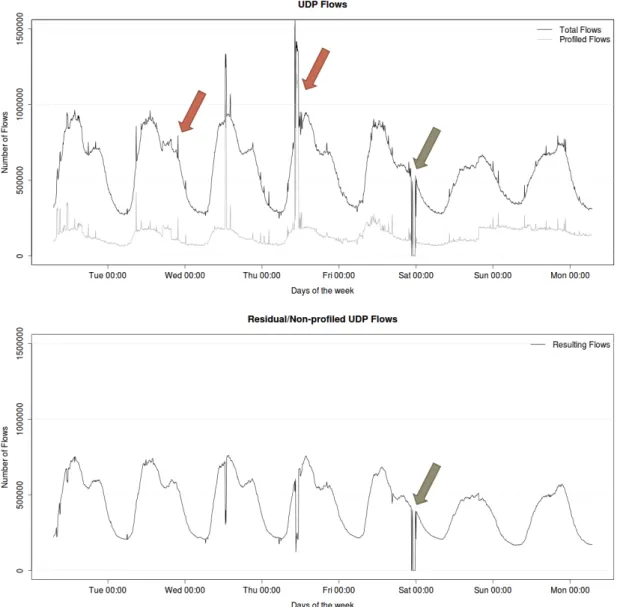
To begin with our analysis, we first collected one week of NetFlow data. The period of data we could choose from was between the last two weeks of De-cember 2013 and the first two of January 2014. The first three weeks were not representative for a nor-mal week of traffic, since the Holidays caused signifi-cantly lower traffic statistics. We chose to pick week two of 2014, which had representable values for an average week. This period contains one restart of the NetFlow collector on Friday just before mid-night. This explains a gap in the data which can be seen in figure 4 at the rightmost arrows of both the top and bottom graphs.
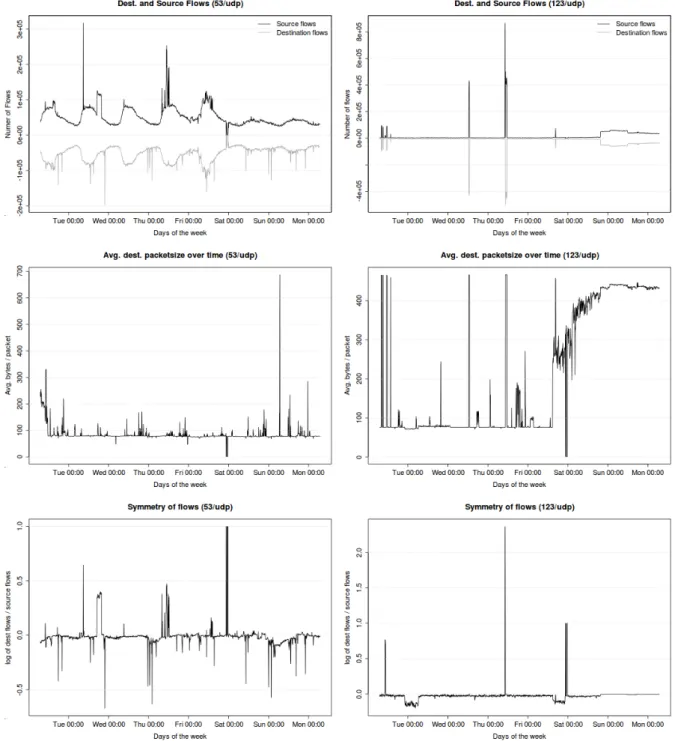
Figure 3: An example of two protocols with different behavior.
3.2.1 Profiled traffic
We did analysis on the protocol-port combinations of table 1. We found out that this traffic can be divided into several categories:
• Repetitive traffic with noise;
• Repetitive traffic without noise;
• Non-repetitive traffic.
Because we had both source and destination traf-fic of the profiles and all statistics on flows, packets and bytes, we could verify if there is a correlation on them. So therefore we also looked at byte/packet correlation and source/destination correlation. The Figure 3 show two very different kinds of traffic: repetitive traffic with noise (left) and non-repetitive traffic (right). In the left column we have Domain Name System (port 53) and on the right we have Network Time Protocol (port 123), both UDP. The top row illustrates the repeating regularity of the
flows of both protocols. On the DNS side one can clearly see the difference between day and night and working days versus the weekend. NTP on the other side doesn’t have this regularity and apparently is also more symmetrical than DNS. The middle row shows the average packet size for both protocols. DNS shows an almost constant value around 90 bytes per packet with some shootouts. With NTP we also see a distinct line around 90 bytes/packet for the first half of the week. At the end of Friday, a sudden raise on the average packet size can be seen. It has been confirmed that this was an attack. The bottom row of figure 3 shows the ratio between the destination and source flows on a logarithmic scale in order to show the symmetry of the traffic. One can see that the ratio of the source and destination traffic is around zero, which proves symmetry. The spikes indicate a sudden anomaly. For DNS spikes occur on both sides. NTP has bigger peaks at the source than at the destination.
3.2.2 Non-Profiled traffic
On the top part of the figure 4, the one week of UDP flow traffic can be seen. The black line rep-resents the total amount of UDP flow traffic, while the grey line represents only the profiled UDP flow traffic. The left two arrows of the top graph point at two example anomalies that are reflected in the profiled data. By extracting the totals of the pro-filed traffic from the total traffic, we get a smoother graph without most of the noise and peaks caused by anomalies. This can be seen in the bottom part of figure 4. The main reason of this is the proto-cols being exploited for DDoS attacks were profiled. By having a cleaner non-profiled data, the detection of new kinds of attacks will be easier, as the noise caused by those will be easily seen. In such situa-tion, the same analysis can be applied and the new type of attack can be profiled, leading again to a cleaner non-profiled data.
Figure 4: Non profiled traffic (UDP).
3.2.3 Baselines and thresholds
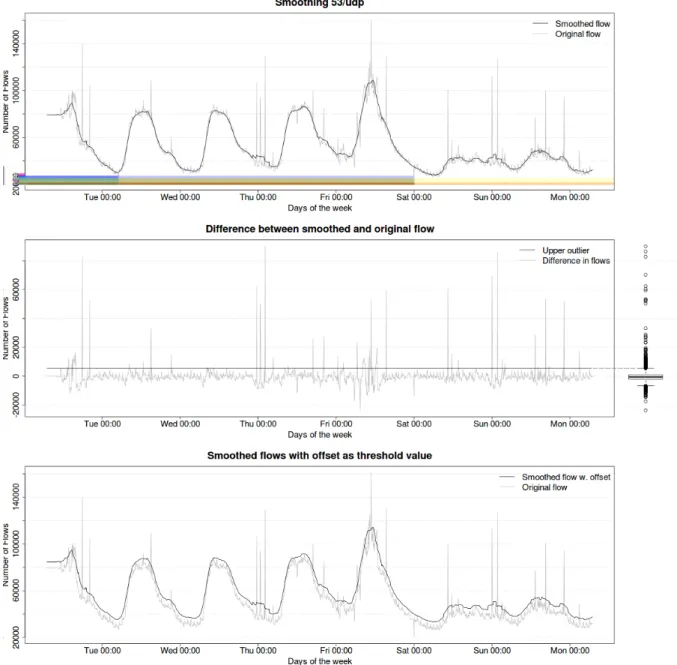
In order to obtain more accurate baseline, we manu-ally adjusted the most obvious anomalies from the flow-data. After that, we applied the Friedman’s smoothing algorithm to remove noise. This can be seen in the top graph of the figure 5.
To find a good relative value (one that will be added to the baseline) that can be used as a threshold, we subtracted the now smoothed baseline to the traf-fic, obtaining only the noise. Then, by calculating
the upper outlier of the boxplot of this data (also known as upper whisker), we found the threshold value seen in the middle graph of the figure 5. As can be seen, all the insignificant noise is below the threshold, while the peaks (network anomalies) are above the threshold.
The bottom graph of the figure 5 shows the original traffic and the final threshold. Again, as expected, all the small noise is below the threshold, while the peaks are above.
Figure 5: Traffic base lining and analysis
3.3
Prototype
The advantages of the integration with NfSen, is the possibility to use NfSen functions, such as e-mail capabilities, the possibility of development of a web interface integrated in the NfSen portal, and the automatic run when a new sample file is avail-able, which happens every five minutes.
NfSen plugins (like ours) are written in Perl. NfSen defines functions that need to be implemented, and run on different situations (NfSen start, new sam-ple file, etc.). Our plugin has all of its logic imsam-ple- imple-mented in Perl, and relies on a SQLite database for retrieval of the baselines, which are also updated by the plugin, retrieval of absolute and relative
thresh-old, profiles, and other specific information, such as the weighting value for baseline updates and layer 4 protocols to be analyzed. The database also con-tains the active alerts and a history of past alerts. For alerts viewing and profiles management, a web interface was developed. This web interface, which is integrated in the NfSen portal, was written in PHP and HTML. A list of profiles is shown, along with the all the information related, such as abso-lute or relative thresholds, and protocol and port. Within the web interface it is possible to add and remove profiles.
4
Results
Our analysis showed us that we can indeed detect network anomalies. After applying our statistical method to the profiles we created, we found that it was the most effective for repetitive traffic with noise. When dealing with repetitive traffic without noise, we found that smoothing is not necessary and even results in wrong baselines. With no or almost no noise, it not possible to get a proper outlier value either. Even though we use baselines for this kind of traffic, we had to define relative thresholds by ana-lyzing visually the graphs. The non-repetitive
traf-fic had to big differences between the normal traftraf-fic and the anomalies, that our statistical approach re-sulted in the outliers being too low in most cases. SNMP/UDP and NTP/UDP were effective though, because the destination traffic was repetitive but the source was non-repetitive. For non-repetitive traffic, we found that using a baseline is not an ef-fective solution. In the end we concluded that the best approach for non-repetitive traffic is to simply define absolute thresholds.
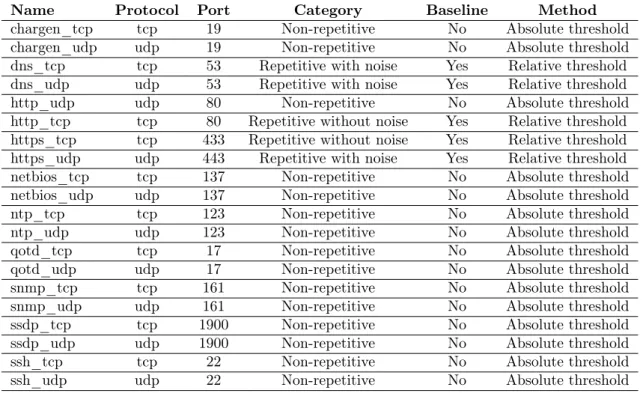
The following table shows the profiles we created for the prototype, the categories where they belong, and the method applied.
Name Protocol Port Category Baseline Method
chargen_tcp tcp 19 Non-repetitive No Absolute threshold chargen_udp udp 19 Non-repetitive No Absolute threshold dns_tcp tcp 53 Repetitive with noise Yes Relative threshold dns_udp udp 53 Repetitive with noise Yes Relative threshold
http_udp udp 80 Non-repetitive No Absolute threshold
http_tcp tcp 80 Repetitive without noise Yes Relative threshold https_tcp tcp 433 Repetitive without noise Yes Relative threshold https_udp udp 443 Repetitive with noise Yes Relative threshold netbios_tcp tcp 137 Non-repetitive No Absolute threshold netbios_udp udp 137 Non-repetitive No Absolute threshold
ntp_tcp tcp 123 Non-repetitive No Absolute threshold
ntp_udp udp 123 Non-repetitive No Absolute threshold
qotd_tcp tcp 17 Non-repetitive No Absolute threshold
qotd_udp udp 17 Non-repetitive No Absolute threshold
snmp_tcp tcp 161 Non-repetitive No Absolute threshold snmp_udp udp 161 Non-repetitive No Absolute threshold ssdp_tcp tcp 1900 Non-repetitive No Absolute threshold ssdp_udp udp 1900 Non-repetitive No Absolute threshold
ssh_tcp tcp 22 Non-repetitive No Absolute threshold
ssh_udp udp 22 Non-repetitive No Absolute threshold
Table 1: Profiles For the residual traffic, we found that our statistical
method was effective. The approach taken for the repetitive with noise category was also applied for this traffic.
By having our prototype running on a system with production flow-data, we were able, as expected, to detect network anomalies and raise alarms when that happens. Unfortunately due to lack of time, we were not able to manually verify, when possi-ble, the type of anomalies for all the alarms raised, however, the following was verified:
Profiled traffic: Some of the DNS/UDP and NTP/UDP traffic alerts were verified by the ad-ministrators to be DDoS attacks. Others could not always be verified since in some situations the
ver-ification has to be done with the customers, which is a time-consuming process.
Non-profiled traffic: A TCP anomaly was de-tected. It has been verified that it was an anomaly caused by an Access Grid application used for video conferencing. In this case, it was legal traffic.
5
Conclusion
During this research project, we looked at several protocols that can be used for DDoS attacks. Some are currently very popular, such as DNS and NTP, while others are, at least at this moment, not being used for this purpose. We did statistical analysis on
the flow data of the ISP, and defined baselines and optimal threshold values for the protocols where those could apply, and absolute thresholds for the remaining. A prototype was developed where the result of our research was applied. Our tests and findings show that our baseline model is effective in the detection of high volume traffic anomalies. By following our statistical analysis on the Inter-net traffic, is it possible to find good thresholds for DDoS attack detection, as long as the traffic con-tains periodic repetition and concon-tains at least some amount of noise. Our prototype is effective in the detection of network anomalies and able to do this on a near real-time basis, however at this stage, there is no conclusion on the type of anomaly. Ad-ditional checks should be performed to point out if the anomaly is a scan, DoS, DDoS or legitimate change in the network flows. We could not detect other anomalies than high volume ones with our method.
6
Future Work
After finishing the work on this project, there are some things based on our findings we think are im-portant for continuing this research. On the data analysis sub-section we will point what should be the next step in order to obtain better values for some kinds of traffic, and on the prototype sub-section we will tell what would be the next steps regarding our implementation.
6.1
Data Analysis
After applying our statistical approach to the pro-filed traffic, we found that our approach worked significantly better on some profiles than others, leading to some unusable results. Further studies should be done in order to identify which statisti-cal approach leads to the best results for each kind of traffic. Further analysis should be done to find out which complementary tests can be done, either to find more about a current attack, or to detect non-volumetric attacks.
6.2
Prototype
Even though our prototype shows in a satisfac-tory way the results of our research, further test-ing should be done before deployment on a produc-tion system. The first step should be having inde-pendent threshold values/thresholds for source and destination traffic, as we verified that in some situ-ations a common value is not optimal. In order to detect if an anomaly was caused by a DDoS attack, further tests should be performed after an anomaly is detected. An interesting extension, which can be seen in the Figure 1, is communication with a mitigation system and the mitigation system itself. As an example, Flowspec could be used to instruct compatible routers to automatically filter out mali-cious traffic.
References
[1] Monowar H. Bhuyan, H. J. Kashyap, D. K. Bhattacharyya and J. K. Kalita |“Detecting Distributed Denial of Service Attacks: Methods, Tools and Future Directions” | December 2012
[2] David Holmes |“The DDoS Threat Spectrum“ | F5 Networks. 2012.
[3] Alexandru G. Bardas, Loai Zomlot, Sathya Chandran Sundaramurthy and Xinming Ou | “Classifi-cation of UDP Traffic for DDoS Detection” | April 2012
[4] Yoohee Cho, Koohong Kang, Ikkyun Kim and Kitae Jeong |“Baseline Traffic Modeling for Anoma-lous Traffic Detection on Network Transit Points” | January 2009
[5] Jae-Hyun Jun, Hyunju Oh and Sung-ho Kim |“DDoS flooding attack detection through a step-by-step investigation” | December 2011
[6] Chia-Mei Chen, Ya-Hui Ou and Yu-Chou Tsai |“Web Botnet Detection Based on Flow Information”