D
ESIGN AND
A
NALYSIS
P
ERFORMANCE OF
F
IXED
W
ING
VTOL
UAV
Muhammad Fadhil Bin Jamaludina, Mastura Ab Wahida,*, MohdNazriMohdNasira, NorazilaOthmana, MohdZarhamdyMd. Zainb
aDepartment of Aeronautic, Automotive and Ocean Engineering, School
of Mechanical Engineering, Faculty of Engineering, Universiti Teknologi Malaysia, 81310 UTM Johor Bahru, Johor, Malaysia
bDepartment of Applied Mechanics and Design, School of Mechanical
Engineering, Faculty of Engineering, Universiti Teknologi Malaysia, 81310 UTM Johor Bahru, Johor, Malaysia
Article history
Received
1 June 2018
Received in revised form
11 June 2018
Accepted
19 November 2018
Published
28 November 2018
*Corresponding author [email protected]
G
RAPHICALA
BSTRACTK
EYWORDSMultirotor; Fixed Wing; VTOL; Thrust Performance
I
NTRODUCTIONUnmanned Aerial Vehicle (UAV) is an aircraft without human on-board has become popular due to rapid growth of its application in the most field exist. Many researches has been focusing on technology advancement of UAV to increase its operational experience. In Hungary, UAV are essential to provide significant meteorological support system during planning and executing phase, which is very important to generate an accurate prediction for short-time visibility [1]. Hodgson et al. [2] apply UAV technology to monitor wildlife in tropical and polar environment because UAV demonstrate good ability to survey hard-to-reach population and area.
Mainly there is two type of UAV, multirotor and fixed wing. Both type of UAV have their own advantages and disadvantages. Generally, fixed-wing UAV have good cruising speed performance. In addition, fixed wing UAV have remarkable payload capacity depending on the type of operations and aim. However, fixed wing UAV need runways or special launch equipment such as catapult launcher. Meanwhile, multirotor UAV able to perform vertical take-off and landing (VTOL) but have poor cruising speed and payload capacity as compared to fixed wing UAV [3]. Hence, fixed wing VTOL UAV is developed in order overcome these problems and to optimize the capability UAV.
Japan Aerospace Exploration Agency (JAXA) has been developed Quad Tilt Wing (QTW) fixed wing VTOL UAV to improve capabilities and
A
BSTRACTapplications of civil UAVs [4]. The development of fixed wing VTOL UAVs offer many advantages in military application. Eagle Eye by Bell Helicopter, Panther by Israel Aerospace Industries and AD-150 by American Dynamics Flight System are example of fixed wing VTOL UAV that developed for military application [4]. Some industry developed fixed wing VTOL UAV by installing multi rotor equipment. This will result in increasing of wing loading for the UAV. Hence, proper design process need to be establish. This include the placement of motor for vertical take-off and landing. Quadcopter and Tricopter is the most popular configuration used for fixed wing VTOL UAV.
Agrawal et. al [5] in his paper claimed that the tricopter is more stable if compared to bicopter, but highly unstable if compared to quadcopter. Even though development of tricopter is less expensive, however if one of the motor fails, the UAV cannot operating any further. Vuruskanet. al [6] claimed that quadcopter is more stable, which is important criterion in development of fixed-wing VTOL UAV. Designing VTOL mechanism into fixed-wing UAV means we add more weight into the system. Hence, it is crucial to assigned properly the place for extra components that will be add to avoid the center of gravity shift from the original too much. The CG can be calculate by using the law of the lever, where weight on one side of fulcrum multiplied by its arm is equal to weight of the other side times by its arm [7].
Selection of motor and propeller is crucial to determine the capability of the UAV to fulfil the mission requirement. Benson, C [8] stated that there is two type of motor usually used for UAV, which is Brushless DC motor and Brushed DC motor. Brushless DC motor is more efficient and have longer lifespan as compare to Brushed DC motor [9]. Choosing type of propeller must be link with type of motors used. Hence, according to datasheet of motor, type of propeller used can be decide. Azman, S. [10] conduct performance analysis by using equation available in book Introduction to Flight [11]. However, the equation only cover for fixed wing mode. Saengphet, W. et. al [12] collected the formula that can be used to calculate the thrust during multi rotor mode. This included the thrust to take-off, thrust to hover and thrust to landing.
In this design project, a modification on fixed wing UAV, Skysurfer X-UAV will be carry out. This process involve in specifying the position of motors in order to ensure the UAV can hover and take-off in stable condition. The problem due to the modification is the effect of increase in wing loading on thrust performance of the UAV. Hence, the objective of this project is to develop a
conceptual design of fixed wing VTOL UAV based on ready-to-fly (RTF) fixed wing UAV and to analyze the thrust performance of the fixed wing VTOL UAV in both, fixed wing and multirotor modes.
M
ETHODOLOGYBackground and Requirement
Designing of an UAV must fulfil the requirement. In this project, the design is focusing on how to modify ready-to-fly (RTF) fixed wing UAV into VTOL fixed wing UAV. Hence, proper understanding of what parts are required for both flying mode is very crucial. Successful UAV should be able to fulfil its mission profile.
Figure 1: Mission profile of the UAV
Figure 1 shows the mission profile for the fixed wing VTOL UAV. In this project, mission planner, as well as mission requirement parameters, specified in order to analyze the thrust performance of the UAV. Table 1 shows the required mission parameters.
Mass and Balance Analysis
As explained, the center of gravity (CG) is the average weight position of an object and a point where the aircraft is balance. As explained in Raymer method, the CG can be calculate by using the law of the lever. The CG of this UAV can be determine by using the steps below:
1. Set a point as a datum and measure the arm of each weight from the datum. 2. Multiply the weight and the arm to get
moment of each weight.
3. Obtained the summation of weights and moments.
4. Divide the total moment by the total weight to obtain the CG position.
the CG of the UAV, the position of motors can be define in such way the summation of moment about the x-axis and y-axis is equal to zero, where T is motor thrust.
𝑀𝑥 = 𝑀𝑦 = 𝑇 × 𝑙𝑎𝑟𝑚 = 0 (1)
Table 1: Target mission of VTOL Skysurfer X-UAV
Mode Requirement Value Description
MR
VTO 3 m/s Take-off
velocity
VLD 2 m/s Landing
velocity
HTO 50 m Take-off
altitude
HLD 30 m Landing
altitude Ttran 10 s Transition
time Thold 2 mins Position
hold
FW
Vcruise 17 m/s Cruise to
target Srange 1 km Operating
range Hcruise 50 m Cruise
altitude Tloiter 5 mins Loiter time
.
Performance Analysis
Thrust Required and Power Required for Fixed Wing Mode
In order to calculate the thrust required during fixed wing mode, the first, the zero-lift drag coefficient needs to be determine. Zero-lift drag coefficient, CD,0 is a dimensionless parameter
where the value is reflective of parasite drag, which shows how smooth the streamlined of an aircraft’s aerodynamics are.In this design process, zero-lift drag coefficient is determine by using DATCOM method. The formula to calculate zero-lift drag coefficient for wing expressed as below [13].
𝐶𝐷,0= 𝐶𝑓 1 + 𝐿 𝑡𝑐 + 100 𝑡𝑐 4
𝑅𝐿,𝑆𝑆𝑆𝑤𝑒𝑡 𝑟𝑒𝑓(2)
On the other hand, the formula to calculate zero-lift drag coefficient for fuselage expressed as below [13].
𝐶𝐷,0= 𝐶𝑓 1 + 𝑙𝐵60 𝑑
3+ 0.0025 𝑙𝐵
𝑑 𝑆𝑆
𝑆𝐵+ 𝐶𝐷𝑏(3)
This value is important to be determine because the thrust required is effect by the total drag of the UAV, where the total drag is combination of zero-lift drag and lift-induced drag. The coefficient of drag expressed as shown below [11]:
𝐶𝐷 = 𝐶𝐷,0+ 𝐶𝐿 2
𝜋𝑒𝐴𝑅 (4)
Lift induced drag is drag that contribute by the lift coefficient. As explained in the literature review, the lift coefficient expressed as shown below [11]:
𝐶𝐿=1 𝐿 2𝜌𝑉∞2𝑆
=1 𝑊 2𝜌𝑉∞2𝑆
(5)
Since, during level flight, the lift is equal to weight of the UAV and noted that the wing loading is equal to weight of the UAV, W divide by the wing area, S. Hence, lift induced drag is contribute by wing loading. By installing the multirotor equipment, the total weight of the UAV is increases, thus the wing loading also increase since the wing area is remained constant. To fly the UAV at specific velocity, the power system of this UAV must produce a net thrust equal to drag as shown in equation below [11].
𝑇𝑅= 𝐷 = 𝑞∞𝑆𝐶𝐷 (6)
𝑇𝑅= 𝑞∞𝑆𝐶𝐷,0+ 𝑞∞𝑆 𝐶𝐿 2
𝜋𝑒𝐴𝑅 (7)
The minimum thrust required obtained by using the formula as shown below [11]:
𝑉𝐷𝑚𝑖𝑛 = 𝑊𝑆𝑇𝑂 𝑟𝑒𝑓 2 𝜌
1
𝐶𝐷,0∙𝜋∙𝑒∙𝐴𝑅 (8)
During Fixed-Wing (FW) mode, the power required is in function of thrust required and velocity of the UAV. The equation expressed as shown below [11].
𝑃𝑅= 𝑞∞𝑆𝐶𝐷,0𝑉∞+ 𝑞∞𝑆𝑉∞ 𝐶𝐿 2
𝜋𝑒𝐴𝑅 (9)
Thrust Required and Power Required for Multi Rotor Mode
During Multi-Rotor (MR) mode, there are three conditions to be consider, which is power to take-off, power to hover and lastly power to landing. The take-off thrust required and power required for each propeller expressed below [14]:
𝑇𝑇𝑂=
𝑊𝑇𝑂+12𝜌𝑆𝐿𝑉𝑇𝑂2 𝑆𝑟𝑒𝑓𝐶𝐷0,𝑎𝑥𝑖𝑎𝑙
ŋ𝑚𝑜𝑡𝑜𝑟 𝑁 (10)
𝑃𝑇𝑂 =𝑇𝑇𝑂2𝐹𝑀𝑉𝑇𝑂 2 + 1 + 𝜌 2𝑇𝑇𝑂
𝑆𝐿𝐴𝑝𝑟𝑜𝑝𝑉𝑇𝑂2 (11)
Where the CD0,axial is a drag coefficient in axial
climb and by assuming it to be a flat plate, the drag coefficient in axial climb is 1.9 (104< Re <105) [15]. During transition from multi rotor to fixed wing mode and vice versa, the UAV needs to hover. The hover required and hover induced velocity expressed as below [14]:
𝑃𝐻=
𝑊 𝑇𝑂 ŋ𝑚𝑜𝑡𝑜𝑟 𝑁
3 2
𝐹𝑀 2𝜌𝑆𝐿𝐴𝑝𝑟𝑜𝑝 (12)
𝑉𝐻= 𝑊𝑇𝑂
ŋ𝑚𝑜𝑡𝑜𝑟𝑁
2𝜌𝑆𝐿𝐴𝑝𝑟𝑜𝑝 (13)
For descend case in axial direction. The motor disc work in the vortex ring state that only exist for the case of descent velocity that is twice less than hover induced velocity. Descend induced velocity obtained based on quadratic equation below [14]:
𝑉𝑖= 𝑉𝐻 1.2 − 1.125𝑥 − 1.372𝑥2− 1.718𝑥3− 0.655𝑥4 (14)
Where
𝑥 = −𝑉𝐿𝐷
𝑉𝐻 (15)
Hence
𝑇𝐿𝐷=
𝑊𝑇𝑂−12𝜌𝑆𝐿𝑉𝑇𝑂2 𝑆𝑟𝑒𝑓𝐶𝐷0,𝑎𝑥𝑖𝑎𝑙
ŋ𝑚𝑜𝑡𝑜𝑟 𝑁 (16)
𝑃𝐿𝐷 = 𝑇𝐹𝑀𝐿𝐷 𝑉𝑖− 𝑉𝐿𝐷 (17)
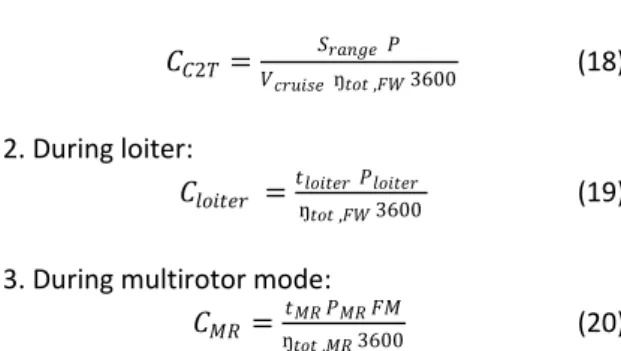
Based on equation 10, the thrust to take-off is depend on the speed of the UAV need to take-off. Hence, the graph of thrust required against speed can be plot for MR mode. By comparing with the maximum thrust available, the maximum speed of the UAV can take-off can be determine. Besides, this graph also plotted in order to determine whether the UAV able to take-off with the speed specified in the mission requirement.
Thrust Available for Fixed Wing and Multi Rotor Mode
In order to validate whether the UAV can fulfil the mission requirement as stated earlier, a thrust test is conduct for both motors. This can be achieve by comparing the thrust available value obtained from the thrust test with the thrust required. Based on the minimum speed to cruise, the range of speed that UAV can cruise also can be determine. Dynamometer Series 1520 used to do the thrust test shown as in figure 2 [16].
Figure 2: Dynamometer Series 1520 [16]
Figure 3: Thrust test conducted on 980KV motors
Figure 3 shows thrust test conducted on 980KV motors used for multi rotor mode. This motor tested with 10-inch propeller while fixed wing motor, which is 2450KV tested with 5-inch propeller. The thrust test conducted as follow:
1. Repeat the experiment seven times and average the data.
2. Attach the ESC to the Dynamometer Series 1520 firmly.
3. Connect the ESC signal cable to the Dynamometer Series 1520.
5. Connect the ESC to the motor and make sure the rotation of the motor is in the same direction of propeller direction. 6. Connect the USB cable to laptop and run
RCBenchmark software.
7. Connect the battery and run the automatic thrust test using the software. The software will automatically control the signal to increase the current draw.
Energy Consumption
After having the power required for each mode and mission, the power will converted to electric energy required (Wh). This can be done by considering the subsystem efficiency that will be explain in next section and by neglecting the energy consume by the subsystem device such as controller board, gyroscope, accelerometer and receiver. The equation of energy required is divide according to each mission and expressed as shown below [17].
1. During cruise:
𝐶𝐶2𝑇=𝑉 𝑆𝑟𝑎𝑛𝑔𝑒𝑃
𝑐𝑟𝑢𝑖𝑠𝑒ŋ𝑡𝑜𝑡 ,𝐹𝑊3600 (18)
2. During loiter:
𝐶𝑙𝑜𝑖𝑡𝑒𝑟 =𝑡ŋ𝑙𝑜𝑖𝑡𝑒𝑟𝑃𝑙𝑜𝑖𝑡𝑒𝑟
𝑡𝑜𝑡 ,𝐹𝑊3600 (19)
3. During multirotor mode: 𝐶𝑀𝑅 =ŋ𝑡𝑀𝑅𝑃𝑀𝑅𝐹𝑀
𝑡𝑜𝑡 ,𝑀𝑅3600 (20)
In other to consider the safety due to unpredicted voltage drop during discharging and cut-off voltage at low capacity, the total energy required is divided by factor 0.7 [17].
𝐶𝑡𝑜𝑡 =𝐶𝐶2𝑇+𝐶𝑙𝑜𝑖𝑡𝑒𝑟0.7+𝐶𝐶2𝐵+𝐶𝑀𝑅 (21)
By calculating the energy required for each mission, we can compare which mission will used the highest electrical energy.
Subsystem Efficiency
Saengphet, W et. al [17] stated in his research, the efficiencies of parts and equipment need to be estimate based on available literature review in order to calculate the power and energy required. Total efficiency for both mode, fixed wing and multi-rotor are expressed as [18]:
ŋ𝑡𝑜𝑡 ,𝐹𝑊 = ŋ𝐸𝑆𝐶ŋ𝑚𝑜𝑡 𝑜𝑟ŋ𝑝𝑟𝑜𝑝 (22)
ŋ𝑡𝑜𝑡 ,𝐹𝑊 = ŋ𝐸𝑆𝐶ŋ𝑚𝑜𝑡𝑜𝑟𝐹𝑀 (23)
Propeller
For both mode, MR and FW, it has different propeller shape and size. To match with operating condition, blade width and blade pitch or angle can be optimize. Mathew, H et. al [19] claimed that, for the propeller with diameter ranging 10-13 inch and pitch angle between 4.7 to 8 inch can have maximum efficiency varied from 0.6 to 0.75 depend on size, pitch and airfoil used. For MR mode, the efficiency term is changed to FM [17]. Gordon, J [20] stated that efficiency of multi-rotor propeller has a figure of merit (FM) more than 0.6.
Motor
Brushless DC is a traditional motor that has widely used to predict the motor performance. According to manufacturer, the motor efficiency is ranging from 0.8 to 0.95 depend on the specification, technology used, and operating condition such as propeller size, voltage supply and RPM [21].
Electronic Speed Controller (ESC)
According to Lundstrom, D [22], ESC efficiency was affected by resistive losses in the electronic and FETs as well as loss due to duty cycle. At normal operating condition such as cruise, the throttle was often set at 40% to 60%. At this range, the efficiency drop from 1 to 0.85 to 0.9 [22]. The result of this efficiency is consistent with research by Schomann, J [23], where with input of 14.8V, the efficiency obtained is around 0.8 to 0.9.
Table 2: Subsystem efficiency
Efficiency value
Equipment Symbol Value
FW propeller ŋprop 0.7
Motor ŋmotor 0.8
ESC ŋESC 0.85
MR propeller FM 0.65
FW total ŋtotal ,FW 0.48
MR total ŋtotal ,MR 0.44
R
ESULTS ANDD
ISCUSSIONMass and Balance Analysis
Figure 4: CG before and after modification
As what we observed in figure 4, for both calculation, even after addition of equipment and parts for VTOL mechanism, the CG does not change. In x-axis, the CG from the datum is 31.57cm. This mean the aircraft will able to perform stable flight as what it was design originally because it is longitudinally stable. If only if the CG change, then the calculation of coefficient of moment versus angle of attack need to be conduct.
In order for UAV to hover or take-off in stable condition, the summation of moment about x-axis and y-axis must be equal to zero. In order to achieve this, the position of multi-rotor must be symmetrical about x-axis and y-axis.
Figure 5: position of multi rotor motors
𝑀𝑥= 𝑀𝑌 = 𝑇 × 𝑙𝑎𝑟𝑚0 (24)
Since the position of motors is symmetrical about the x-axis and y-axis, the UAV can take-off and hover in stable condition because thrust from motors not producing any imbalance moment.
Thrust Required and Available in Multi Rotor Mode
Based on the thrust test with 980KV motor and 10 inch propeller, the maximum thrust can be produced is equal to 800g. Based on equation 10, a graph of thrust required against speed plotted as shown in figure 6.Comparing the thrust available based on thrust test and thrust required, the
maximum speed the UAV can take-off during multi rotor mode is 6 m/s.In the mission requirement, the UAV is required to take-off at 3 m/s. Since it is lower that maximum speed, the UAV can fulfil the mission requirement.
Figure 6: Thrust required and available for multi rotor mode
Thrust Required and Available in Fixed Wing Mode
As mention earlier, to calculate the thrust required for fixed wing mode, zero-lift drag need to be determine by using equation 2 and 3. The result obtained shown in table 3:
Table 3: Zero-lift drag calculated
Part Zero-lift drag
Wing 0.0098
Fuselage 0.095
Total 0.1
The largest source of drag contributed by the fuselage while wing only contributed to small proportion. One assumption made in this design process, where the multi-rotor parts not contribute to any drag, which is far from true. In order to get zero-lift drag coefficient value for multi-rotor part, Computational Fluid Dynamic (CFD) or wind tunnel test can be conduct, which is not included in the scope of this project. This limitation left for future work to improve the result obtained. Since the total weight of the UAV has
31.57cm
8
.7
8
increased, the wing loading also increased. The calculation of the new wing loading shown as below:
WS = W S =
1.1
0.2329= 4.723 kg/m2
Wing loading contribute to the lift coefficient. Hence, increasing the wing loading will affect the performance of the UAV. Thus, two graph plotted for thrust required for fixed wing mode before and after the modification to observe the changing of thrust required due to increase of wing loading.
Figure 7: Graph of thrust available and thrust required
As we can see, the maximum thrust produced by 2450KV motor is only 550g, which is much lower from 980KV motors. However at this point, the current draw already reach maximum continuous current for this motor, which is 25A. This is because the propeller diameter used for this test is only 5 inch. Used of 5 inch propeller is due to the clearance between the fixed wing motor and the fuselage is very small and make it impossible to use bigger propeller.
Since the wing loading of the UAV change, we need to consider how it will affect the total thrust required. Based on figure 7, it is observe that the wing loading totally effect the thrust required only at lower speed. As the speed of the UAV increases, the difference getting smaller and smaller due to thrust required generated progressively more by increasing of dynamic pressure. This mean, increasing the wing loading of the UAV does not affect too much on the UAV
performance. Based on equation 8, the minimum speed of the UAV to cruise is 9.82 m/s.
Comparing the result of thrust test with thrust required for fixed wing mode as shown in figure 7, maximum speed of this UAV can achieve is 19 m/s. Since this UAV is required to cruise with 17 m/s and it is in between of maximum and minimum speed during fixed wing mode, hence this UAV can fulfil the mission requirement.
Power and Energy Consumption
Table 4: Power consumption for each mission
Mission Power (W)
Multi rotor
Take-off 257.36
Transition 157.8
Landing 80.8
Fixed wing
Cruise to target 75
Loiter 50
Cruise to base 75
By using formula 9, 11, 12, and 17, the power required obtained as shown in table 4. Based on the result obtained, the maximum power required is during take-off. This is because during take-off, the UAV need to run four motors simultaneously. While, during transition, the power required is the second highest. This is because during transition, the UAV need to run five motor simultaneously. The fact that the power required during transition is a bit lower than power to take-off is due to during hover, the four motors only need to produce just enough thrust to keep UAV hover. By using equation 18-21, energy consumption obtained as shown in table 5.
Table 5: Energy consumption for each mission
Mode Mission Energy
Consumption (Wh)
MR
Take-off 1.795 Transition 0.648
Landing 0.497
FW
Cruise to target
2.17
Loiter 8.68
Cruise to base 2.17 Total Divide by 0.7
for safety
22.8
long distance, which is 1000m from the ground station.
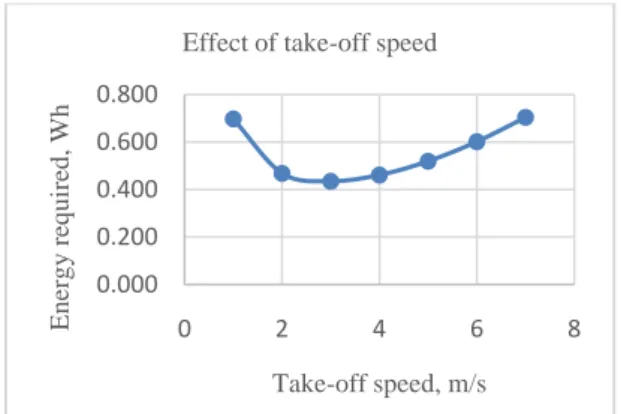
By doing power and energy consumption calculation, its observed take-off mission consumed a lot of power. One of the step to optimize the energy available is by revising the effect of take-off velocity. For energy required during take-off is influence by two factors, which is take-off speed and time take-off to reach 50 m height. In order to investigate this effect, the speed is vary from 1 m/s to 7 m/s. The result obtain shown as in table below.
Figure 8: Effect of take-off speed on energy consumption
Based on figure 8, the minimum energy required for take-off is during 3 m/s. After 3 m/s, the energy required is higher as the speed increase. This is because at higher speed, the UAV required to produce more power to hover. However, at lower speed, which is less than 3 m/s, the UAV required more energy due to longer time taken for the UAV to reach 30 m of height.
CONCLUSION
In general, the objective of this project is to develop a conceptual design of fixed wing VTOL UAV based on ready-to-fly (RTF) fixed wing UAV. Hence, to maintain its stability, in this project, the position of each equipment assigned such way the center of gravity of the UAV does not change. In addition, in order for a UAV to hover in stable condition, the position of multi-rotor is place such way it is symmetrical about x-axis and y-axis. This is to ensure that the UAV will not produce any moment during hovering or take-off. Next, the performance analysis conducted in order to analyze the capability of the UAV to fulfil the mission requirement. Based on thrust test and thrust required, the UAV can fulfil the mission requirement as specified earlier. Moreover, analysis shown that increase in wing loading does
not affect too much on the thrust performance during fixed wing mode. Take-off velocity from the mission requirement is already perfect to optimize the used of electric energy. On the other hand, since the minimum speed to cruise of the UAV is 9.82 m/s, it is still safe to reduce the speed of the UAV as long as it does not touch the stall speed. Reducing speed of the UAV can reduce the power required.
A
CKNOWLEDGEMENTSThis work is supported by UTM GUP 1 Grant No. 20H30 and Aeronautical Laboratory (AEROLAB) UTM Skudai .
R
EFERENCES[1] Bottyan et al 2016. “Weather Forecasting System
for the Unmanned Aircraft Systems (UAS) Missions with the Special Regard to Visibility Prediction, in
Hungary”.
[2] Hodgson, J., Baylis, S., Mott, R., Herrod, A. and Clarke, R. 2016. Precision wildlife monitoring using unmanned aerial vehicles. Scientific Reports, 6(1). [3] Sato, M. and Muraoka, K. 2013. Flight control of
quad tilt wing unmanned aerial vehicle. Journal Of The Japan Society For Aeronautical And Space Sciences, 61(4):110-118.
[4] Tran, A., Sakamoto, N., Sato, M. and Muraoka, K. 2017. Control Augmentation System Design for Quad-Tilt-Wing Unmanned Aerial Vehicle via Robust Output Regulation Method. IEEE Transactions on Aerospace and Electronic Systems, 53(1):357-369.
[5] Agrawal, K., Shrivastav, P. 2013. Multi-rotor: A Revolution In Unmanned Aerial Vehicle. International Journal of Science and Research (IJSR). ISSN (online): 2319-7064
[6] Vuruskan, A., Yuksek, B., Ozdemir, U., Yukselen, A., Inalhan, G. 2014. Dynamic Modelling of a Fixed-Wing VTOL UAV. 2014 International Conference on Unmanned Aircraft Systems (ICUAS).
[7] Aircraft Weight and Balance Handbook. 2007. U.S Department of Transportation: Federal Aviation Administration.
[8] Benson, C. 2015. How to Make a Drone/UAV. Retrieved at 6 June 2018 from http://www.robotshop.com
[9] Jim. 2014. Brushless Motor vs Brushed Motors,
What’s the difference? Retrieved at 6 June 2018
from http://www.quantumdev.com
[10]Azman, S. 2018. Design the VTOL Aircraft for Land Surveying Purposes. Faculty of Mechanical Engineering, University Teknologi Malaysia. [11]Anderson, J. D. 1998. Aircraft Performance and
Design. Mc-Graw-Hill Education.
[12]Saengphet, W., Thumthae, C. 2016. Conceptual Design of Fixed Wing-VTOL UAV for AED Transport. International Conference on Mechanical Engineering.
0.000 0.200 0.400 0.600 0.800
0 2 4 6 8
Ene
rgy
re
quire
d,
W
h
[13]Blake, W. B. 1985. Prediction of Fighter Aircraft Dynamic Derivatives Using Digital Datcom. U. S. Air Force Wright Aeronautical Labs.
[14]Wang, B., Hou, Z., Liu, Z., Chen, Q., Zhu, X. 2016. Preliminary Design of a Small Unmanned Battery Powered Tailsitter. International Journal of Aerospace Engineering, Vol. 2016, Article ID 3570581.
[15]Hoerner, S. F. 1965. Fluid Dynamic Drag. Hoerner Fluid Dynamics, Bakersfield, CA.
[16]RCBenchmark 2018. Series 1520-Thrust Stand and Dynamometer. Retrieved at 5 April 2018 from https://www.rcbenchmark.com
[17]Saengphet, W., Thumthae, C. 2016. Conceptual Design of Fixed Wing-VTOL UAV for AED Transport. International Conference on Mechanical Engineering.
[18]Jouannet, C., Berry, P., Melin, T., Amadori, K., Lundström, D., & Staack, I. 2012. Subscale flight testing used in conceptual design. Aircraft
Engineering And Aerospace Technology, 84(3):192-199
[19]McCrink, M., and Gregory, J. 2017. Blade Element Momentum Modeling of Low-Reynolds Electric Propulsion Systems. Journal Of Aircraft, 54(1):163-176. doi: 10.2514/1.c033622
[20]Gordon, J. 2006. Principles of Helicopter Aerodynamics. 2nd Edition Cambridge University Press
[21]T-Motor Safetest Propulsion System and Product. Retrieved at 6 Jun., 18 from http://www.rctigermotor.com
[22]Jouannet, C., Berry, P., Melin, T., Amadori, K., Lundström, D., & Staack, I. 2012. Subscale flight testing used in conceptual design. Aircraft Engineering And Aerospace Technology, 84(3):192-199
![Figure 2: Dynamometer Series 1520 [16]](https://thumb-us.123doks.com/thumbv2/123dok_us/8011067.2122870/4.892.526.727.353.532/figure-dynamometer-series.webp)