1
A Comparison of Deterministic and
Stochastic Approaches for the Estimation
of Trips Rates
Anil Minhans,a,* Nazir Huzairy Zaki,a Shamsuddin Shahid,a Akmal Abdelfatah,b
a
Faculty of Civil Engineering, Universiti Teknologi Malaysia, 81310 UTM Skudai, Johor, Malaysia.
b
Department of Civil Engineering, American University of Sharjah, United Arab Emirates.
*Corresponding author: [email protected]
Abstract
Typically, traffic impact assessment is conducted to evaluate the impacts by proposed developments. In these assessments, trip rates are mostly adapted from local trip generation manual. This study is about evaluation on the current trip rates of commercial land use for three hypermarkets in Malaysia, by comparing deterministic and stochastic approaches. In this study, three deterministic approaches, Trip rate Analysis, Cross-Classification Analysis and Regression Analysis are applied to generate trip rates respectively. Similarly, stochastic approaches using ‘Weibull distribution’ are found appropriate for the collected trip generation data. The obtained mean trip rates have been critically examined for their suitability of use. The results indicate that the four approaches considered in this research produced significant variances from the estimated mean entry trip rates as mentioned in the Trip Generation Manual of Highway Planning Unit (HPU) of Malaysia.Therefore, this study debates the adoption of currently available trip rates for nationwide application and presents suggestions about the direction of future trip generation studies. In this regard, this study presents a framework for the estimation of trip rates for Malaysian conditions, based on the aforementioned four approaches along with some guidelines for their adoption.
Keywords: Trip rates, traffic impact assessment, cross-classification analysis, Stochastic methods, Weibull distribution
1. INTRODUCTION
Policy makers of National Transformation Program (NTP) under the current 9th Malaysian Plan intend Malaysia to become a developed nation by the year 2020. This can be seen from rampant urban development in many states, including the southern state of Johor. Given the locational value of Skudai Town of Johor Bahru due to its close proximity with the high-income country of Singapore, its
development is much more intense than other parts of the country. Skudai Town also has an international university, Universiti Teknologi Malaysia (UTM), which provides education to over 20,000 students and employs more than 4,000 academic and non-academic staffs. Thus, Skudai Town is regarded as University town. The Coastal Zone of South Johor is 64 km in length, which presents unique location based development and faces Straits of Johor, the waterway that separates
2
Malaysia from Singapore. Skudai Town is a part of a larger Iskandar Development Region [1], which is a federal initiative to turn southern Johor into a world class tourism, education and financial hub. Altogether, major infrastructure development activities are being carried in this region at a remarkable pace, bestowing concern to urban planners. Evidently, massive development efforts bring about increased congestion, traffic accidents, pollution and costs of transport manifold.
Land use and transport are inseparable entities, as type, scale and distribution of land use influence the type, intensity and routes of traffic streams; which further influence the type, capacity and structure of urban transport systems. These transport systems i.e. public transport, private transport and their combination thereof, have great potential to influence the current land uses. Typically, traffic impact assessment (TIA) is conducted to assess the impact of proposed land use development or other land use changes on the transport system. Both the developers and governments do acknowledge the need for such assessment. However, there is no general consensus about when the study would be necessary and what approaches are deemed suitable for the estimation of trip rates [2-4]. In the absence of legal guidance, the awareness for the study is usually initialized by the traffic experts or local bodies. Only recently, new conditions are outlined to conduct such assessments. In Malaysia, the conditions and practice of performing traffic assessment is no different than trip generation manual of the United States. Malaysian problems exist with respect to lack of standards and procedures of traffic assessment [5]. These have raised concerns on the validity of the estimation of traffic generation at proposed sites and neighbouring sites, traffic assignment and mode split.
Since there are no proper standards to follow, traffic engineers or planners usually refer to the guidelines of TIA and use trip generation rates from previously established manuals such as Malaysia’s own Trip Generation Manual from Highway Planning Unit (HPU) [6] or Manual of Transportation Engineering Studies by the Institute Transportation Engineers (ITE) of the United States. Experiences from past projects in
determining trip rates are also used as analogy for estimating trip rates for upcoming projects. Even though the trip rates stated in the HPU trip manual are based on studies conducted all across Malaysia, the manual is still at early stage of compilation due to reference from limited number of survey sites, especially for less common types of land uses. On the other hand, the trip rates stated in the ITE manual do not reflect well the local conditions of typical Malaysian lifestyle and travel pattern, as these are based on various studies within the United States which have no resemblence to typical Malaysian way of life, climate, socio-economic considerations and so forth, which makes the travel pattern different between these two countries.
Apart from that, both manuals provide trip rate that are insensitive to population density, travel patterns, economic growth, accessibility etc. For example, the number of vehicle trips going to a shopping mall for a car dependent city will be considerably higher than that of a city that depends on public transport, even for the same shopping mall type and area. In other words, the number of trip generations of certain type of land use depends on local conditions of the area. Thus, trip rates calculating procedures can be prone to biases or errors which can result in overestimation or underestimation of mean trip rates. These inherent flaws in trip estimates have provided motivations to conduct this study.
3
hence estimation on trip rates. To achieve this aim, the following objectives have been underlined: a. To test and validate the adoption of mean trip rates per 100 m2 while comparing three deterministic approaches: Trip Rate Analysis, Cross Classification Analysis, and Regression Analysis; b. To test and validate the adoption of mean trip rates per 100 m2 using stochastic approach of Weibull Distribution;
c. To draw a comparison between the deterministic and stochastic approaches of estimating trip rates and propose a few suggestions meant to improve the reliability of trip rates.
2. RESEARCH BACKGROUND
Traffic impact assessment procedures are valuable tools to urban planners and developers for analysing traffics generated by proposed developments with new accesses or increased use of existing accesses. The trip generation of such proposed developments is estimated using mean trip rates, which, when applied, forecasts the development traffic that will use the neighbouring network for horizon year. Mean trip rates are determined by carrying out trip generation analysis. Trip generation is the first and the most important step in the four-step process for forecasting the travel demand [7]. The objective of a trip generation model is to forecast the number of trips that begins or ends in each of the zones within a study area [8].
Depending on the needs of study, Trip Rate Analysis, Cross-Classification Analysis (CCA), and Regression Analysis (RA) are widely used to determine the mean trip rates for zone-wise traffic studies [9, 10]. Trip Rate Analysis is heavily dependent on the experience and knowledge from past studies with similar characteristics. Cross-Classification Analysis is a widely accepted method because its variables can be altered according to suitability and availability of data. According to Stopher and Meyburg (1978), [11] there are two ways to conduct Cross-Classification Analysis, either by trip production (in which the trip rate obtained will show the number of trips produced at that particular place), or trip attraction (in which
the trip rate obtained will show the number of trips attracted to that particular place). A typical Cross-Classification table shows the number of trips produced per household with characteristics such as car ownership, household size, average income and/ or other variables whichever seem to fit.
Regression Analysis for trip rate estimation is conducted by referring to several assumptions. Firstly, the number of trips generated from a facility is assumed to be linear to the selected variables. Secondly, the selected variable may be one independent variable or a combination of some independent variables to produce a multiple regression to produce a single regression. All the variables can be checked for their dependency on each other by using a statistical analysis to ensure a good fit of the data. The dependent variable is subject to error. This error is assumed to be a random variable, with a mean of zero. Systematic error may be present but its treatment is outside the scope of regression analysis. Thirdly, the sample must be representative of the population for the inference prediction.
Deterministic models for trip generation differ from stochastic models in term of where every set of variable states are uniquely determined by parameters in the model and by sets of previous states of these variables. In a stochastic model, randomness is present, and variable states are not described by unique values, but rather by probability distributions [12].
This research requires necessary background provided by a model for accurately predicting the trips generated by commercial properties in Malaysia. At a time when Malaysia is witnessing widespread urban expansion involving commercial land use, the research on new hypermarkets can provide useful insights. High reliance on the foreign-based trip generation manuals for Malaysian scene is disagreeable. Therefore, new models which address the local conditions of hypermarkets must be developed.
4
independent variables, which may either not be independent entirely or even relevant to the trip making behaviour. Major problems of these deterministic type of models are their inability to provide real insights into the processes of trip making or their tendency to form casual relationships. The obtained regression coefficients indicate the strength of independent variable in constitution of a model. Nevertheless, the fact that regression coefficients are usually assumed to be relevant for current as well as future time is still unreal.
Effects of improper estimation are implicated on poor decision making involving land use development and its chosen location [13]. Without full understanding on the land use impacts on transport, the whole purpose of land use development may be diminished. Undesired effects of underestimation need to be evaluated to lessen responsibility of developers to undertake economic or technical burden as a result of their intended development. Furthermore, it burdens the government into imposing heavy taxes and financial cuts on other sectors, which may deter investments in infrastructure [2]. Due to underestimation of trips, unanticipated traffic problems occur, which demand urgent traffic management solutions. In such cases, traffic management is uninformed and unprepared to handle such crises. Often, poor traffic flows are generated, which contribute to high rate of traffic accidents and congestion. Also, it further reduces the productivity and efficiency of overall transport system.
Equivalently, overestimation may increase the responsibility of developers or government disproportionately to solve traffic problems, which are intensive of resources and capital. Also, significant revenues will be lost by developers and governments departments. In worse situations, it may even deter developers from investing in similar locations, thus would search for alternate investment locations. Furthermore, the new traffic solutions, be it infrastructure or management type, should bear potential to promote high vehicle ownership, which further affects urban congestion. Trip models are mostly influenced by subjective dimensions of trip-making behavior. Complex
interrelations are formed between life situation, lifestyle, residential location, urban form and travel modes; all are regarded to generate trips [14]. Thus, all the above explained backgrounds provide necessary insight to this research.
3. METHODOLOGY
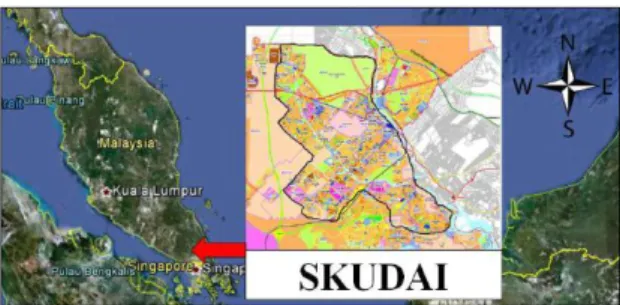
After establishing the needs of the study, the study area was earmarked. A number of existing commercial developments, especially hypermarkets, were chosen as a basis to determine the mean trip rate. The study sites involved three popular hypermarkets in Johor Bahru (Figure 1), namely Giant U Mall (GUM) in Pulai Utama, Jusco Taman Universiti (JTU) in Taman Universiti and Carrefour Sutera Utama (CSU) in Taman Sutera Utama.
Figure 1. Location of Study Area
Adequate attention was given to parameters when selecting hypermarkets for the study, such as location of the hypermarkets, type of shops and activities within the hypermarket premises (to compare equal patronage), neighbouring land uses, opening hours, number of access points, free or cheap parking fares with good and adequate parking facilities, and equal facilities for any type of patron, either elderly or handicap person at the hypermarkets [15]. The size of the hypermarkets were also considered; GUM hypermarket (15,820 m2) and JTU hypermarket (16,105m2) having almost similar area size for fair comparison, and the smaller CSU hypermarket (62895m2) was chosen to understand differences that might arise due to larger area.
5
1. Vehicle count was conducted at each hypermarket to classify vehicles and to determine vehicle occupancy levels. These levels were used to determine conversion factors essential to convert person trips to vehicle trips.
2. Customers survey was conducted at each hypermarket to observe the distribution of customers by shop categories.
3. Shop owners survey was conducted at each hypermarket to observe the activities, number of employed staff, average sales etc. Shop owners survey was done to determine the characteristics of the shops for each existing commercial developments-hypermarkets under study. This was done by using a set of questionnaire, to obtain information from the shop owners about the shop name, type of their shop-retail type or service type, GFA, number of employees and average sales obtained in a typical month. Surveyors had been to each shop at all locations and asked the shop owners directly, and then aggregated information in the questionnaires themselves. The questionnaire was designed based on data requirements and simplicity for the surveyors.
4. Adjacent land use and zoning information were collected from city municipalities.
Manual vehicle counts were done at GUM, JTU and CSU, respectively. Data were collected during morning peak (11AM until 1PM) and during evening peak (5PM until 7PM). These times were apperceived to capture maximum footfalls at the hypermarkets. The peak hour was defined by the highest volume of consecutive counts rather than highest clock hour. The highest hourly data was considered as peak hour rate for each location, and the traffic volumes were converted into PCU factor based on Trip Generation Manual (2010) [6]. Surveyors were stationed at all entry and exit points for all 3 hypermarkets to manually count the incoming vehicle in the area together with their vehicle occupancy for each vehicle type. Vehicle types were considered in terms of car/van, light lorry consisting of less than 2 axles, heavy lorry which consists of more than 2 axles, motorcycle and bus. These procedures were performed for 1 day, each on typical weekday and weekend for all sites.
Customers surveys were done to determine the characteristics of the customers who made the trip to GUM, JTU and CSU, respectively. Using O-D survey as guideline, this was done by using a questionnaire to obtain customers’ personal details and their trip details. Personal details included gender, age, marital status, occupation, household size and employment status, car ownership and income, while trip details included the origin of the trip, time taken to make the trip, mode of travel, vehicle occupancy, purpose of trip and their frequency of visiting the place in a typical week. Shop owners surveys for all shops were conducted at GUM, JTU and CSU to obtain information on type of shops, GFA, average number of employees employed during peak hour and the average sales obtained in a typical month.
Secondary data was also collected from Majlis Perbandaran Johor Baru Tengah (MPJBT) on land use, socio-economic variables, and trip behavior [10]. Current and proposed land use developments data were indicative of the type, scale and intensity of the land uses. The study area was segregated into five small and manageable zoning areas, which were numbered accordingly. The origin or destinations were noted for all trips. The zone sizes were determined based on the size of the survey area, density of population, and purpose of the study. Current and proposed land use development was one of the important data collected for trip generating process. Current land use and proposed land use development clearly indicated the type and intensity of future land use development planned to be implemented by authorities in the area.
The step-wise procedure that was followed to calculate the mean trip rates is explained below. 1. Total peak hour person trips were obtained from occupancy rates, while vehicle counts were manually conducted at GUM, JTU and CSU by actual observation.
6
3. The peak hour person trip for each shop was determined by multiplying the total peak hour person trip with the percentage of the average daily person trip to each shop; underlying assumptions were made that the percentage of trips attracted to each shop as average daily and peak hour trips would be the same.
4. The GFA of shops was grouped into small (<200 m2), medium (200 m2-500 m2) and large (>500 m2) and number of employees was grouped into categories of 1, 2, 3, and 4+ employees. 5. The conversion factor (CF) was obtained by dividing the peak hour PCU trip with total peak hour person trip.
Three deterministic trip generation methods, namely Trip Rate Analysis, Cross-Classification Analysis (CCA), and Regression Analysis (RA) were applied. In addition, probability distributions were used to determine the stochastic mean trip rate for entry into hypermarkets. The obtained mean trip rates were then compared for their accuracy of prediction.
4. RESULTS AND ANALYSIS
4.1 Mean Trip Rate Estimation Using
Deterministic Approaches- Trip Rate Analysis
Firstly, mean trip rates were estimated using Trip Rate Analysis. Using this method, peak hour traffic volume (AM and PM) for weekdays and weekends were used to produce the rate trips per 100 m2 for all hypermarkets. The mean of all three trip rates were considered as the mean trip rate. The equation used to determine the mean trip rate is given in Equation (2). Table 1 shows the results of entry mean trip rates per 100m2 GFA using Trip Rate Analysis.
Table 1. Trip rates in PCU trips per hour per 100m2 GFA and standard deviation using TRA
Hypermarket Weekday Weekend AM
peak PM peak
AM peak
PM peak
GUM 2.29 2.27 2.27 2.65
JTU 1.14 1.43 1.35 1.68
CSU 0.91 1.46 2.02 1.80
Mean trip
rate 1.45 1.72 1.88 2.04
Stand. Dev. 0.7393 0.4766 0.4757 0.5288
The equation used in the estimation is:
2 m 100 )
2 ( m GFA Total
) ( PCU/hr volume traffic hour Peak GFA 2 rate/100m
Trip
Equation (1)
4.2 Mean Trip Rate Estimation Using
Deterministic Approaches- Cross Classification Analysiss
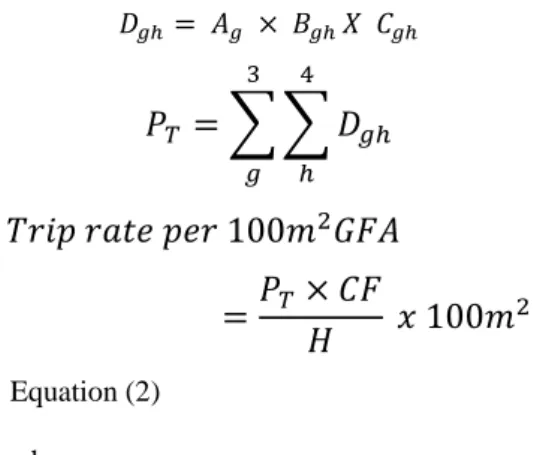
In brief, the Cross-Classification Analysis is used to conclude a relationship between the average peak- hour person trips in a particular shop category that employs a particular number of employees. Table 2 shows the mean trip rate obtained using Cross-Classification Analysis for GUM, JTU and CSU, respectively. The following models were used to calculate the mean trip rate:
∑ ∑
Equation (2) where,
Dgh = Number of person trips per hour attracted
to the shops with GFA category g and number of employees category h,
Ag = Percentage of shops with GFA category g
either small, medium or large,
Bgh = Percentage of shops in GFA category g
with number of employees category h (h = 1, 2, 3 or 4+) per shop,
Cgh = Average number of person trips per hour
attracted to the shop at GFA category g and number of employees category h,
7
CF = Conversion factor from person trip to PCU trip,
H = Total average GFA for every GFA category g with number of employees category
h.
For this estimation, we used peak-hour person trips, GFA and number of employees in the 3 categories of shops as variables. Firstly, the analysis involved the estimation of the percentage distribution of particular shops with respect to GFA categories and the total number of employees at the same shop. A total of 3 shop categories (small, medium and large) and 4 categories of total employees by shop categories were created. Secondly, the average arrivals of customers into each shop category by GFA with a known number of employees in the same shop were calculated. Thirdly, total person trips were obtained by adding individual trips in each shop employing a certain number of people. These person trips per hour were converted into PCU per hour using a conversion factor. Finally, the PCUs per hour were calculated by average GFA and PCUs per hour and per 100 GFA.
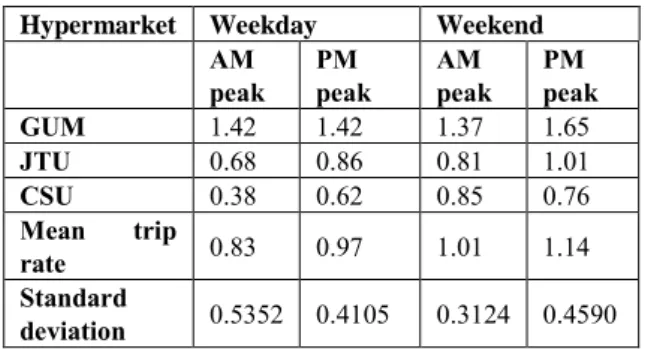
Table 2. Trip rates in PCU trips per hour per 100 m2 GFA and standard deviation using CCA
Hypermarket Weekday Weekend AM
peak PM peak
AM peak
PM peak
GUM 1.42 1.42 1.37 1.65
JTU 0.68 0.86 0.81 1.01
CSU 0.38 0.62 0.85 0.76
Mean trip
rate 0.83 0.97 1.01 1.14
Standard
deviation 0.5352 0.4105 0.3124 0.4590
4.3 Mean Trip Rate Estimation Using
Deterministic Approaches- Regression Analysis
Mean trip rates were also estimated using Regression Analysis. For this purpose, multiple regression equations were obtained using PCU per hour as a dependent variable, and the gross floor area and employees in each shop as independent variables. Four equations were developed to analyze each supermarket for four different periods. The coefficient of determination (R2) was found to be between 0.9 and 0.91 for all the cases. It indicates a high correlation between the dependent
and independent variables. A high coefficient of determination also indicates that the developed regression equation can be used for prediction with reasonable accuracy. Therefore, the multiple regression equations developed in the study area were used for trip generation.
The coefficient of a multiple regression equation provided the influence of independent variables on the dependent variable. In the present study, the regression equation coefficient for GFA was used to estimate the trip rate generated for each 100 m2 GFA. Table 3 shows the entry mean trip rates obtained using Regression Analysis for JTU and CSU, respectively.
Table 3. Trip rates in PCU trips per hour per 100 m2 GFA and standard deviation using RA
Hypermarket Weekday Weekend AM
peak PM peak
AM peak
PM peak
GUM - - - -
JTU 0.4 0.5 0.4 0.5
CSU 0.8 1.4 1.9 1.7
Mean trip
rate
0.6 0.95 1.15 1.1
Standard
deviation - - - -
*The data for GUM was found inconsistent and was not included in the analysis.
4.4 Mean Trip Rate Estimation Using Stochastic Approaches- Weibull Distribution
8
distributions was evaluated using Kolmogorov-Smirnov and Anderson-Derlington tests. It was observed that Weibull distribution best fitted the trip-generation data for all cases. Therefore, Weibull distribution was adopted to estimate the most probable value of the trip-rate for 100 m2 floor area.
In probability theory, the Weibull distribution is a continuous probability distribution. The probability density function of a Weibull random variable is given as,
∫(
) {
(
)
( ⁄ )
where
0
is the shape parameter and λ > 0 is the scale parameter of the distribution. The mean of the data having Weibull distribution is calculated as,(
⁄ )
Weibull distribution was used to estimate the trip rates per 100 m2 GFA for three cases of hypermarkets under study, both separately and together. For this purpose, Weibull distribution was fitted in the trip rate data of each three super markets separately and the merged data of all hypermarkets. Kolmogorov-Smirnov and Anderson-Derlington test statistics for all fittings were found within the range of 0.59 to 1.27 and 0.89 to 2.33, respectively. This indicates good fit of Weibull distribution for all sets of data.
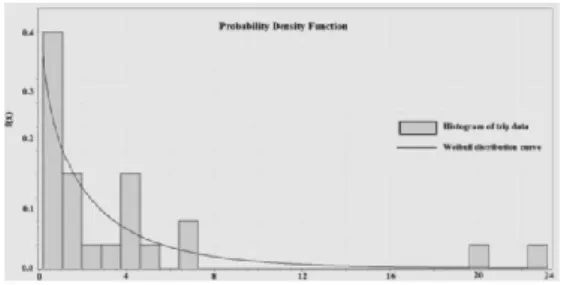
Figure 2. Weibull distribution curve over weekend morning peak hour trip-rate data at Carrefour Sutera
Utama (CSU)
A Weibull sample distribution curve for weekend morning peak hour data at Carrefour Sutera Utama CSU is shown in Figure 2.
The theoretical Weibull probability distribution versus empirical probability distribution or P-P plot for the fitting showed that the Weibull distribution points aligned alone in a straight line. Repeatedly, it verified that Weibull distribution fitted properly with trip-rates data and therefore, can be used to estimate most probable trip-rates. The parameters of Weibull distributions
(
and
)
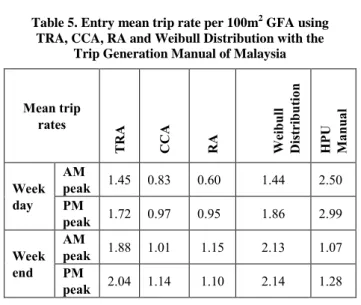
for the fitted curve were also used in the second equation to calculate the most probable values of trip rates in PCU trips per hour per 100 m2 GFA. The obtained results are shown in Table 4.Finally, different mean trip rates were compared with the one suggested by the HPU Malaysian Manual,as in Table 5. This table presents a summarized account of the mean entry trip rates, estimated using all the three deterministic approaches and one stochastic approach, and comparison with trip rates as suggested by Malaysian manual.
In the end, the test results indicated that the lowest mean difference for the Cross-Classification method of estimation and the mean trips rates produced by this method of estimations could be used for the rest of the analysis.
Table 4. Trip rates in PCU trips per hour per 100 m2 GFA and standard deviation using Weibull
Distribution
Hypermarket Weekday Weekend AM
peak PM peak
AM peak
PM peak
GUM 0.60 1.70 1.65 1.99
JTU 0.82 1.33 1.25 1.56
CSU 1.35 2.17 3.00 2.69
Mean trip
rate 1.44 1.86 2.13 2.14
Standard
deviation 1.54 1.60 0.81 1.77
9
Table 5. Entry mean trip rate per 100m2 GFA using TRA, CCA, RA and Weibull Distribution with the
Trip Generation Manual of Malaysia
Mean trip rates
TRA CCA RA We
ib
u
ll
Distr
ib
u
tio
n
H
PU
Ma
n
ua
l
Week day
AM
peak 1.45 0.83 0.60 1.44 2.50
PM
peak 1.72 0.97 0.95 1.86 2.99
Week end
AM
peak 1.88 1.01 1.15 2.13 1.07
PM
peak 2.04 1.14 1.10 2.14 1.28
5. DISCUSSION OF RESULTS
Generally, trip rates as listed in the trip generation manual of Malaysia can indeed be viewed as a source for trip rates applied to most Malaysian condition. This study provides guides and explanation if trip rates are either over- or under-estimated, depending on the estimation methods used when compared with the available manual. All four approaches produced significant differences with the abovementioned manual at multiple accounts. This makes the authors believe that the rates mentioned in the manual might be conservative or might not reflect the local conditions in some parts of Malaysia.
It was observed from this study that inclusion of socioeconomic and demographic factors, as well as land use considerations in the Cross-Classification Analysis, produced reliable trip estimates closer to manual for weekend cases. However, for weekdays, the observed differences can be attributed to the scope of applied methods, variables used for analysis and inconsistency of available data. Human errors while performing traffic surveys, as well as unconnected and incomprehensive data might have affected results. Even though the trip rates as per manual were deemed reliable estimates, these were based on limited number of surveyed sites. A total of 6 to 11 sites for sub land use category- hypermarkets were studied for obtaining nationwide trip rates. Nevertheless, reliability of such estimates for application is questionable for newly proposed hypermarkets throughout Malaysia. Furthermore, the manual provided trip rates that are
insensitive to modal shares, propensity to mobility, population density, travel patterns, economic growth, accessibility to the site, and neighbouring land use and its composition, among many other important factors. These inherent shortcomings of the trip estimation methods can be eliminated by developing newer models that address solution of the above factors.
Trip Rate Analysis can be viewed as the simplest of the four approaches, whose general procedures had involved counting total number of people and/ or vehicles entering and exiting the prescribed area within an allocated time period. If realistic assumptions are made and performed correctly in case of hypermarkets with similar characteristics, it can produce reliable results. Even though, this method accounted the current traffic conditions, it failed to distinguish the relationship between other socioeconomic and trip variables.
Cross-Classification Analysis, although widely used in trip generation models of urban transport planning system modelling approach, its use for trip rates for TIA is rather infrequent. Therefore, Cross-Classification Analytical approach proved to be a good candidate for comparison. Additionally, this method took consideration of the most important socioeconomic and trip variables that contributed to making the trip. However, inherent flaws were observed; for example, it was difficult to determine whether the independent variables were truly independent and furthermore, as there were no established statistical tests available to support the reliability of end results.
10
small allocation of trips per GFA. Therefore, similar relationships must be checked after consideration of more hypermarkets in different peak time periods.
Methods that incorporate more than one trip making attribute such as Cross-Classification Analysis and Regression Analysis were deemed more suitable to determine the trip rate accurately. In this regard, the inclusion of socio-economic, demographic and land use variables can be significantly important [16]. The associated weaknesses of approaches can be limited by applying hybrid models, for example Regression Analysis can be used for checking the dependency of each variable through statistical tests, and later Cross-Classification approach can be used on the selected variables.
6. CONCLUSIONS AND FUTURE
DIRECTIONS
To boldly state one trip rate which fits all conditions of hypermarkets in Malaysia is questionable. In the Malaysian manual, trip rates are more exaggerated than conservative estimates in most cases. The higher trip rates in the Manual put the liability on developers to bear the cost of impacts caused by their developments. Therefore, more accurate methods must be constantly developed to genuinely reflect the trip making mechanisms involving hypermarkets.
• Traditionally, estimates such as future growth of traffic, average delay at traffic signals and queue length are estimated based on the trip rates sourced from standard estimates. The adoption of trip rates, according to standard estimates, can suggest disproportional allocation of transport infrastructure development and management resources.
• A need for the availability of comprehensive data pertaining to shops and customers has been underlined in this study. In future studies, when estimating hypermarkets-related trip rates, a due consideration must be made regarding details of shop size, employees in the shop, revenue from sales in each shop, average- daily person arrival distribution by shops, closing and opening hours of shops, among many important
variables. The composition of shop types within the hypermarkets is also vital, e.g. eating outlets (a frequent activity) are found to generate more trips than hair salons (an infrequent activity).
• Primary data collection should eliminate possibilities of inaccurate report of respondent’s income, customer expenditure, car ownership, revenue from sales of shops etc. These information can be verified with secondary sources.
• In case of significant variation in traffic entering into hypermarkets, such occurrences should adequately take into account appropriate conversion factors to convert the vehicle trips/hour and person trips/hour.
• Future studies must relate the location of the hypermarkets with land use of neighbouring areas. The composition of land use is supposed to have a great effect on the trip generation.
• Trip generation is sensitive to prevalent modal shares. Generally, a city with multi-modal transport is likely to possess different trip rates than cities exclusively reliant on individual transport modes. Similarly, non-hypermarkets related arrivals must also be adequately accounted.
• Rate of trip generation with respect to gross floor area using different methods of trip rate estimation can give useful insights into trip making behaviour and its consideration in traffic assessment. In case of assessment involving person-trips at shops, customer distribution with respect to shops must be carefully examined before using it to generate trip rate.
• A study to produce reliable trip rates for weekdays and weekends must be conducted several times to accommodate seasonal and other effects. The Malaysian manual contradicts the observed fact that more trips to shopping areas are made during weekends than weekdays. Since this study was limited to estimation of entry mean trip rates, future studies should involve total traffic in both directions.
11
study. There is no single approach that is suitable to estimate single trip rate for all land uses. Literatures have suggested diverse approaches and recommended their use in certain cases. From this study, it is observed that inclusion of more socioeconomic and trip variables is conducive to estimation of trip rates. However, this observation relies on comparison of four approaches with the Malaysian manual, which is based on limited sites. More sites must be included in order to improve the accuracy of trip estimation for developing reliable standards.
• Correct estimation is also necessary to substantiate developments in the urban areas of Malaysia. Unanticipated traffic congestion, traffic accidents, economic losses and reduction of environmental quality in many cities of Malaysia, including Johor Bahru, may also be a result of developments that are permitted despite discrepancies of traffic impact assessment.
7. ACKNOWLEDGEMENT
The Author (Principal Investigator) hereby acknowledges the support from Ministry of Higher Education (MOHE) and Universiti Teknologi Malaysia (UTM) for providing funding for this research project (Vote Number PY/2014/02339) and Research Management Center (RMC) for logistical assistance throughout the duration of this project.
8. REFERENCES
[1] Shen, L., Jorge Ochoa, J., Shah, M., & Zhang, X. (n.d.). The Application Of Urban Sustainability Indicators – A Comparison Between Various Practices. Habitat International, 17-29.
[2] Minhans, A., Zaki, N., & Belwal, R. (2013). Traffic Impact Assessment: A Case of Proposed Hypermarket in Skudai Town of Malaysia. Jurnal
Teknologi.
[3] Schroeder, B.J., Cunningham, C.M., Findley, D.J., Hummer, J.E., & Foyle, R.S. (2010). Manual of transportation engineering studies.
[4] Fan, H.S., & Lam, S.H. (1997). Parking generation of commercial developments in singapore. Journal of transportation engineering, 123(3), 238-242. [5] Siong, W. K. (2001). Development of Traffic Impact
Assessment (TIA) Criteria in Malaysia: Johor State as the Basic Model. Doctor Philosophy, Universiti Teknologi Malaysia, Skudai.
[6] Highway Planning Unit (2010). Trip Generation Manual 2010. (1st ed.). Malaysia: Highway Planning Unit.
[7]Black, J. (1981). Urban transport planning: Theory and practice. Baltimore: Johns Hopkins University Press.
[8]Papacostas, C., & Prevedouros, P. (2001). Transportation engineering and planning 3rd edition.
[9]Tesco PLC (2012). Tesco PLC Annual Review and Summary Financial Statement 2012. Tesco PLC: United Kingdom.
[10]Traffic impact assessment: REAM guidelines. (2011). Road Engineering Association of Malaysia & Jabatan Kerja Raya Malaysia
[11]Stopher, P., & Meyburg, A. (1975). Urban transportation modeling and planning. Lexington, Mass.: Lexington Books.
[12]Ashenagar, J. (2010). Comparative assessment of trip generation category analysis and regression modelling techniques, Faculty of Civil Engineering, Universiti Teknologi Malaysia, Malaysia
[13]Badoe, D. (2000). Transportation–land-use Interaction: Empirical Findings In North America, And Their Implications For Modeling. Transportation Research Part D: Transport and Environment, 235-263.
[14]Mohamed, S. S. & Hokao, K. (2000). Estimation of generated traffic by new developments, current practice and possible improvements based on bangkok experience. Victoria Transport Policy Institute. Referred from www. vtpi. org.
[15]Uddin, M., Hasan, M., Ahmed, I., Das, P., & Hasan, T. (2012). A comprehensive study on trip attraction rates of shopping centers in dhanmondi area. International Journal of Civil & Environmental Engineering, 12(4).
[16]Jongho, R. (2003). Improvement of trip generation forecast with category analysis in seoul metropolitan area. Paper presented at the Proceedings of the Eastern Asia Society for Transportation Studies. [17]Shahid, S., Minhans, A., & Puan, O.C. (2014).
Assessment of greenhouse gas emission reduction measures in transportation sector of malaysia. Jurnal Teknologi, 70(4).
[18]Zaki, Nazir Huzairy (2013) Traffic impact assessment
of new commercial developments in the
neighborhoods of Skudai town.Masters thesis,