111
Development of a novel setup for direct colorimetric visualization of elemental
mercury vapor adsorption on colloidal gold nanoparticles
Mohammad Javad Assari
1, Abbas Rezaee
*1, Ahmad Jonidi Jafari
2, Abdolrahman Bahrami
31) Environmental and Occupational Health Department, Faculty of Medical Sciences, Tarbiat Modares University, Tehran, Iran 2) Environmental Health Engineering Department, School of Public Health, Iran university of Medical Sciences, Tehran, Iran 3) Occupational Health Engineering Department, School of Public Health, Hamadan University of Medical Sciences, Hamadan, Iran
Author for Correspondence: E-mail: [email protected]
Received: 17 Sep. 2013, Revised: 01 Nov. 2013, Accepted: 13 Dec. 2013
ABSTRACT
Mercury is a toxic, persistent, and bio-accumulative pollutant that has adverse effects on environmental and human health. Various studies have been conducted to monitor different forms of mercury. The objective of this study was to develop a novel setup for assessing gas phase elemental mercury vapor adsorption using colloidal gold nanoparticles solutions that display a characteristic surface plasmon resonance absorption peak in the visible spectrum. The UV-VIS-NIR spectrographs of gold nanoparticles blue shifts after exposure to mercury vapor. The surface plasmon resonances (SPR) of ∼4 and ∼30 nm gold nanoparticles were appeared with the sharp peaks at 515 and 528 nm respectively. The mercury vapor adsorbed in gold nanoparticles was related to the size. The amounts of mercury vapor adsorbed per grams of ∼4 and ∼30 nm gold nanoparticles solutions were obtained 1100 µg·g-1 and 1300µg·g-1 respectively. A proposed novel setup based on UV-Vis spectroscopic undertaken to provide simplicity, use facilitating, potentially inexpensive, and sensitive enough is a suitable system for mercury vapor capture in many fields. It was demonstrated that the amount mercury adsorbed has been related to the sizes of gold nanoparticles. The color change was observed, when elemental mercury vapor adsorbedon the gold nanoparticles.
Key words:
Mercury; Gold nanoparticles; Surface plasmon resonance;Adsorption; UV-Vis spectroscopyINTRODUCTION
Mercury is one of the toxic chemical agents in environmental. It is released in the atmosphere through different natural and anthropogenic sources [1, 2]. Exposure to high mercury concentrations can be harmful to the human organs such as, brain, heart, kidney, lung and immune system [3]. Elemental mercury vapor (Hgo), inorganic mercurous (Hg+) and mercuric (Hg2+) compounds, and organic mercuric (R-Hg+, where R represents any organic ligand) compounds are different form of mercury in the environment [4]. Mercury has various effects on microorganisms, plants, invertebrates, fishes, birds, and humans [1].
Hgo has generated a high vapor pressure and low water solubility at an atmospheric residence time of 1-2 years. It is the most abundant form of mercury in the atmosphere [5]. Mercury vapor is a dangerous source in air pollution. The present mercury in the air can cause damage to human, plant and animal [6]. Various technologies were proposed for mercury removal from the environment. It is recognized that the porous materials the same activated carbon have
high efficiency for mercury adsorption [4, 7]. The activated carbon injection technology is widely used for controlling elemental mercury. [8]. Major problems associated with activated carbon technology are that the lower affinity between non-treated carbons (without specific active sites) and elemental mercury as well as low pressure drop in the fixed bed. Also, sulphur agents are used for Hgo adsorption on fixed beds, but the problem of hazardous wastes still remain [8]. Therefore, it is an interest to conduct various studies to find a novel material as an alternative adsorbent with high mercury adsorption performance. Determination of elemental mercury is a research topic for solving the problems. Regenerable adsorbents could apply for high mercury adsorption. Some of the adsorbents are low cost, because their reuse.
112
gold nanoparticles to adsorb the mercury is well known [9]. The price is a main problem in using of gold in the industrial activities, but in the field scales usually some materials the same pit has used with very high cost. Moreover, it is expected that the desorption Hgo from adsorbed gold could improve the economy of the process. The adsorption and desorption Hgo on the gold were presented in the literature [8]. The unique optical properties of gold nanoparticles have led to the development of colorimetric assay. It is well known that the wavelength of the SPR is sensitive to adsorption of materials on the surface. Adsorption can generate either blue or red color in the SPR. Mie theory has introduced the color change after Hgo adsorption. Generally, an adsorbent that withdraws electron density from the particle will produce a red shift. In contrast, an adsorbent that donates electron density to the particle will lead to a blue shift of the SPR [10]. In this study, we evaluated a novel setup for assessing of elemental mercury vapor using colloidal gold nanoparticles that display a characteristic SPR absorption peak in the visible spectrum. The colloidal gold nanoparticles were synthesized according to two well-known procedures using HAuCl4. The characteristics of prepared gold nanoparticles were analyzed by UV-VIS-NIR spectroscopy, dynamic light-scattering (DLS), and transmission electron microscopy (TEM). Also, the optical changes were compared on different sized gold nanoparticles after exposure to Hgo.MATERIAL AND METHODS
Chemicals and Materials
Chlorauric acid (III) hydrate (HAuCl4.3H2O) as the source of gold nanoparticles, tri-sodium citrate (Na3C6H5O7), sodium borohydride (NaBH4), and tin chloride (SnCl2.2H2O) as the reducing agents, and mercury chloride (HgCl2) were provided from Merck, Germany. Nitrogen (N2) was used as the carrier gas. A stock solution (1000 µg ml−1) of Hg (II) was prepared by dissolution of mercury chloride salt and was stored at 4°C prior to use. Working standard solutions of Hg (II) were prepared by appropriate stepwise dilution of the stock standard solution to the required levels just before use. The reductant solutions were prepared fresh daily and were purified from possible traces of elemental mercury by 30 min degassing with N2.
The separation chamber was constructed of a cylindrical polyethylene container (164.3 mm length × 72.7 mm i.d.), adjustable valves and the push-fit connections made of poly-tetra-fluoro-ethylene. The channels in an upper cell were managed with two tubes (4.9 mm i.d.); one tube for the inlet carrier gas and another for outlet mixture (Hgo+N2). The lower
channels cell managed two parallel outlets, one for HgCl2 solution and the other for reducing agent. The in-line impinge were applied (SKC Inc.).
Instrumentation
Perkin Elmer Lambda 950 UV-VIS-NIR
spectrometer was applied to determine the SPR peak of each gold colloidal solution before and after exposure to Hgo. TEM, Philips-EM 208, and Dynamic light-scattering (DLS) using a Malvern Zetasizer Nano ZS apparatus (ZEN 3600) were performed to characterize the morphology and size of the gold nanoparticles. Two peristaltic pumps (JMS model SP-510 and JAZ-1800) were used in the proposed elemental mercury vapor generator unit.
Gold nanoparticle synthesis
Gold nanoparticles were synthesized by two procedures. In the procedure 1; gold nanoparticles were synthesized by adding 5 ml of 1% tri sodium citrate solution to 95 ml of a boiling chlorauric acid solution that contained 5 mg of gold [11]. The color of the mixture turned wine red during few minutes, which indicates the presence of the gold nanoparticle of about 30 nm in average diameter. In the procedure 2 for synthesis ofsmaller gold nanoparticle (Procedure 2), sodium borohydride was used as reported previously [12]. Briefly, 100 ml of chlorauric acid aqueous solution containing 1 mg of gold was stirred vigorously, followed by the addition of 5 ml of 1 wt % aqueous tri-sodium citrate. After reaction during 1 min, 1 ml of 0.075 wt % NaBH4 in 1 wt % aqueous tri sodium citrate was added. The solution was stirred for 5 min and the solution changed from colorless to orange. Stirring was stopped, and the solution was left undisturbed for 2 h. The resulting gold nanoparticles were about 4 nm in average diameter. Glassware used in the preparation and storage of the nanoparticles solutions was thoroughly cleaned by immersion in a solution of HCl/HNO3 (3/1) followed by extensive rinsing with water and drying in an oven at 110 ºC. The nanoparticles prepared were stored in a refrigerator in a dark-colored glass bottle before use.
Mercury adsorption experiments
Mercury vapor generation
113
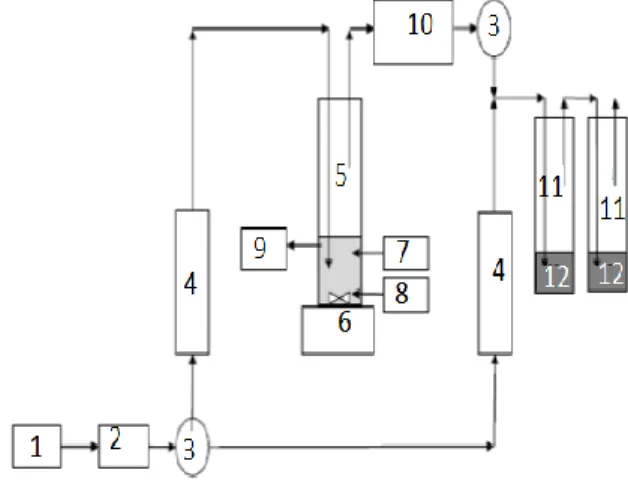
reaction container by peristaltic pumps. Hgo was produced by setting Hg (II) and reduction rate (flow rate or concentration). N2 was supplied as carrier gas to transport Hgo out of the reaction container. The purge gas flow rate of passing through the reactor was 200 ml. min-1, based on standard temperature and pressure.Fig. 1: The schematic of a novel setup used for testing the elemental mercury adsorption. (1) Carr gas, (2) Dryer (3) Adjusted valve (4) Flow meter (5) Separation chamber (6) Stirrer (7) Hg (II) peristaltic pump (8) Reductant peristaltic pump (9) Waste (10) Temperature controller (11) Midget impinger (12) Gold nanoparticles colloidal solution
Calibrating and checking the performance of the above Hgo generator unit has already been published in a recent paper [13]. As it is shown in Table 1, the previous study clearly established that around the loading range 0.125-2.5 ml. min−1 of 100 μg. l-1 Hg (II) solution, a linear calibration curve with the equation peak area=0. 134; loading flow=-0.017 and a correlation coefficient r=0. 996 was obtained, and the detection limit was improved up to cL=1μg. l-1. The relative standard deviation of five measurements of lowest flow loading of Hg (II) was RSD=2. 8%. Table 1: The optimization of Hgo generator unit performance data
Mercury Adsorption Measurement
In order to study of kinetic parameters such as breakthrough time (BTT) and dynamic adsorption capacity, Hgo stream laden carrier gas was fed to the reactor. It was consisted of two midget impingers connected in series that each one contained 10 ml of gold nanoparticle colloidal solution suspended in distilled water. Adsorption experiments were conducted at 25 oC, by 100 ng.min-1 (0.1 µg.min-1) Hgo mass flow rate, which corresponded to a purge gas flow rate of 200 ml.min-1. The leak check was performed by verifying the flow rate of purge gas at different locations in the experimental reactor, and the flow rate was measured using a rotameter. Any drop in the flow rate would indicate a possible leak in the system. Calibration of the rotameter was performed using a soap film flow meter and a stopwatch. Each experiment repeated three times under the same experimental conditions, and repeatability was shown with relative standard deviation (RSD %).
RESULTS AND METHODS
Synthesis
and
characterization
of
gold
nanoparticle
Gold nanoparticles were synthesized by two procedures, in order to compare the optical changes that occur on different-sized gold particles after exposure to Hgo. The nanoparticles with an average diameter ∼30 nm and ∼4 nm were synthesized in procedures 1 and 2, respectively. In order to ensure the validity of the above findings and to bring out additional morphological information related to the particle size and their dimensions, TEM study were conducted (Fig. 2). Fig. 2a shows TEM photographs of products obtained by using procedure 1, and Fig. 2b shows TEM photographs using procedure 2. These observations are consistent with the fact that the product solution of procedure 1 is nanoparticles with an average diameter ∼30 nm, while the product solution of procedure 2 were nanoparticles with average diameter ∼4 nm.
The sizes of the nanoparticles were also analyzed using DLS. The size distribution of gold nanoparticles is shown in Fig. 3. As expected, the particle size obtained from DLS analysis was relatively bigger than in its TEM photograph. This result is in accord with similar studies, in DLS analysis, hydrodynamic radius of the particle is measured, which is inversely proportional to the diffusion speed of the particles in the solution. The size of the hydration shell around each particle in the solution can affect the diffusion speed of the particles, subsequently the particle size. If the hydration shell on the gold nanoparticle swelled in
100
Hg(II) conc.(µg.l-1)
0.125-2.5
Linear range of Hg(II) loading (ml.min−1)
2.5% m/v in HCl
Reducing agent(SnCl2)
0.025-0.5
SnCl2 loading (ml.min−1)
200
Purge gas(Ar) (ml.min−1)
p=0.134L-0.017 L=Hg(II) loading
flow
Regression equation ([HgII] in ng.l−1)
r=0.996
Correlation coefficient
cL=1
LOD (ng.l−1)
2.8
114
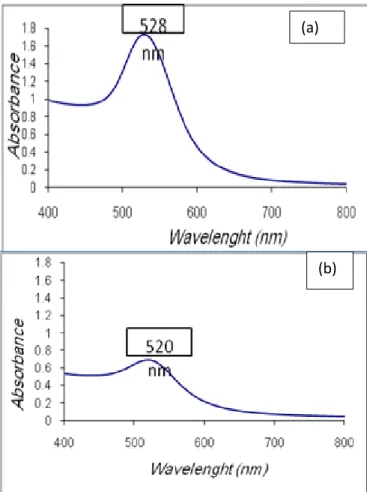
aqueous solution, the water encapsulated in the hydration shell would evaporate and hydrodynamic radius of gold nanoparticles shrunk remarkably in a dry state for measurement with TEM [14].The size is the factor that affects the result of the observed wavelength and SPR absorbance of SPR [9]. As it is shown in Fig. 4, the surface plasmon resonances (SPR) of ∼4 and ∼30 nm gold nanoparticles were appeared with the sharp peaks at 515 and 528 nm respectively.
Fig. 2: TEM images of gold nanoparticles prepared from procedure 1 (a) and procedure 2 (b).
Hg
oadsorption performance
Fig. 3: The size distribution of aqueous gold nanoparticles prepared from procedure 1 (a) and procedure 2 (b).
In the product spectra, broad SPR bands of gold nanoparticles appear in 450-700 nm regions. The region between 450 nm to 600 nm is the region where the SPR bands of spherical particles can be observed, while SPR bands of polygonal particles can be observed in the 550 nm to 800 nm regions [15]. When gold nanoparticles into the impinger was exposed to Hgo, the UV-Vis spectrographs indicate a significant blue-shift, or shift toward smaller wavelengths, and the color of both colloidal gold nanoparticles solutions (prepared using procedures 1 and 2) changed to a blue-purple color. This color change was easily discernable with the naked eye. The increase in absorbance of the SPR peak and blue
37.84
0 1 2 3 4 5 6 7 8
1 5 9 13 17 21 25 29 33 37 41 45 49 53 57 61 65 69
Inte
ns
it
y
(%)
Size(d.nm
)
Precedure 1 (a)5.62
0 1 2 3 4 5 6 7 8
0.40 0.83 1.74 3.62 7.53 15.6932.6772.0082.00
In
tenci
ty
(
%)
Size (d.nm) Perocedure 2 (b) Procedure 1 (a)
115
shift in the colloidal gold nanoparticles solution after Hgo adsorption can be understood in terms of Mie theory [10].When mercury adsorbs onto gold surfaces it lowers the work function, that is, donates electron density to gold. This is consistent with gold being more electronegative than mercury [15]. The extent of the blue-shift is both the amount Hgo flowing through the reactor and time dependent. The blue-shift after exposure to colloidal gold nanoparticles solutions obtained using procedures 1 and 2 were approximately 9 nm and 11 nm respectively. This observation is in excellent agreement with the results presented in many studies which are based on Mie theory [5, 10].
The adsorption of gold nanoparticle can be described by a diffusion model. The possible explanation of the adsorption kinetics is related to the time, concentration and particle sizes of gold nanoparticle, which predicts that surface coverage is proportional to the square root of time [16].
When the same colloidal solutions that have different sizes are used, all of the above parameters are constant and the efficiency of particle adsorption among different sizes can be compared. The obtained experimental results revealed that Hgo adsorbed in gold nanoparticles is inversely proportional to their size, and product gold nanoparticles of procedures 2 adsorbed more Hgo than gold nanoparticles of Procedures 1.
Table 2 summarizes the results of Hgo adsorption in colloidal gold nanoparticles solutions were obtained by using procedures 1 and 2. In this study, the Hgo mass flow rate at 100 ng.min−1,thepurge gas flow rate at 200 ml.min−1 and, adsorption temperature at 25 oC were adjusted. The high amount of Hgo adsorbed per gram gold used had been obtained µg·g -1
. The amount of Hgo adsorbed per gram gold used in gold nanoparticles prepared using procedures 1 and 2 had been obtained 1100 µg. g-1 and 1300 µg. g-1 respectively. As it has been reported in the literature, the reason for this discrepancy can be attributed to the surface area of gold nanoparticles.
Thus, gold nanoparticles synthesized by procedure 2 undertaken to provide more surface area allows more Hgo adsorbed onto its surface. This result is in accord with similar studies [6
Fig. 4: The UV–VIS–NIR absorption spectra of the gold nanoparticles synthesized by tow procedures (a) sodium citrate method and (b) sodium borohydride method.
Table 2: Experimental results of Hg0 adsorption on gold nanoparticles colloidal solution a
breakthrough (min)
Hgo capture
capacity at breakpoint (µg.g-1)
Amount Hgo
absoebed (µg.g-1)
Amount Au used (g)
SPR changes due gold nanoparticles exposure to Hgo
(nm)
gold nanoparticles size effectb (nm)
before after
procedure 1 (∼30nm)
11 1100 586.7 0.0005 528 537
procedure 2 (∼4nm)
13 1300 411.7 0.0005 515 526
a
Sinifies 15 min capture experiment, 100 ng.min
-1Hgomass
flow rate, and 200 ml.min
-1N
2flow rate
bExperiment at 25
oC.
Procedure 2 (b)
(a)
116
CONCLUSION
A novel setup for a UV-Vis spectroscopic study of elemental mercury vapor adsorption on colloidal gold nanoparticles was developed. The results are promising and a setup based on this technique undertaken to provide the advantages such as simplicity, as facilitating, potentially inexpensive, and sensitive enough is a suitable system for use in many fields such as coal fired combustion plants, metals processing facilities, hospitals, and research laboratories.
The obtained experimental results show that Hgo adsorption depends strongly on the sizes of gold nanoparticles and the amount Hgo adsorbed is inversely proportional to their size. A further study will be carried out to control the sizes of gold nanoparticles for optimum Hgo adsorption. It was also shown that a color change is discernable with the naked eye when Hgo adsorbs onto gold nanoparticles. Therefore, a further study would be carried out to control the sizes of gold nanoparticles for optimum Hgo adsorption as a basis for future applications of this nanomaterial.
ACKNOWLEDGEMENT
The authors wish to acknowledge the financial support of the Tarbiat Modares University
REFERENCES
[1] Romero V, Costas-Mora I, Lavilla I, Bendicho C. Cold vapor-solid phase microextraction using amalgamation in different Pd-based substrates combined with direct thermal desorption in a modified absorption cell for the determination of Hg by atomic absorption spectrometry. Spectrochim Acta B 2011; 66 (2): 156–62
[2] Rezaee A., Derayat J, Mortazavi SB, Yamini Y, Jafarzadeh MT. Removal of mercury from chlor-alkali industry wastewater using Acetobacter xylinum cellulose. Am J Env Sci 2005; 1(2): 102-05
[3] Rezaee A, Derayat J, Godini H, Pourtaghi GH. Adsorption of mercury from synthetic solutions by an Acetobacter xylinum biofilm. Res J Env Sci 2008; 2(5): 401-07
[4] Zhao B, Zhang Z, Jin J, Pan W-P. Simulation of mercury capture by sorbent injection using a simplified model. J Hazard Mater 2009; 170 (2-3): 1179–85
[5] Scallan K, Lucas D, Koshland C. A novel uv-vis spectroscopic method to detect elemental mercury using gold nanoparticles. Epidem 2006; 17 (6): S493 [6] Mohamad MF, Kamarudin KSN, Nik NNF, Fathilah M, Mohamed MS. Effects of PVP concentration on the formation of size and shape of gold (Au) nanoparticles for mercury adsorption. J. Appl. Sci. 2010; 10: 3374-78
[7] Rezaee, A., Ramavandi B, Ghanati F, Ansari M, Solimanian A. Biosorption of mercury by filamentous algae Spirogyra species. J Biol Sci 2006; 6(4): 695-00
[8] Izquierdo MT, Ballestero D, Juan R, García-Díeza E, Rubio B, Ruiz C, Ros M. Tail-end Hg capture on Au/carbon-monolith regenerable sorbents, J. Hazard. Mater. 2001; 193: 304– 10
[9] Sozana K, Kamarudin N, Fazliana M. Synthesis of gold (Au) nanoparticles for mercury adsorption. Am. J. Appl. Sci. 2010; 7 (6): 835-39
[10] Moores A, Goettmann F. The plasmon band in noble metal nanoparticles: an introduction to theory and applications. New J Chem 2006; 30: 1121–32 [11] Yanjun Ding, Jia Liu, Hua Wang, Guoli Shen, Ruqin Yu. A piezoelectric immunosensor for the detection of a-fetoprotein using an interface of
gold/hydroxyapatite hybrid nanomaterial.
Biomaterials, 2007; 28(12): 2147–54
[12] Kim YJ, Kim JW, Lee JE, Ryu JH, Kim J, Seop I. Synthesis and ddsorption properties of gold nanoparticles within pores of surface-functional porous polymer microspheres. J Polymer Sci A: polymer Chem 2004; 42: 5627–35
[13] Assari MJ, Rezaee A, Jonidi-Jafari A, Bahrami A. Optimization of a novel sequential injection system for an on-line study of elemental mercury adsorption by cold-vapour atomic absorption spectrometry. JRHS 2013; 13(1): 37-42
[14] Komalam A, Muraleegharan LG, Subburaj S, Suseel S, Babu A, George S. Designed plasmonic nanocatalysts for the reduction of eosin Y: absorption and fluorescence study. Int Nano Lett 2012; 2:26 [15] Tsuji M, Hashimoto M, Nishizawa Y, TsujiT. Preparation of gold nanoplates by a microwave-polyol method. Chem Lett 2003; 32: 1114-15
[16] Morris T, Kloepper K, Wilson S, Szulczewski G. A spectroscopic study of mercury vapor adsorption on gold nanoparticle films, J Colloid Interface Sci 2002; 254: 49-55