doi: 10.17700/jai.2016.7.1.268 65 V.P. Yakushev , E.V. Kanash: Evaluation of wheat nitrogen status by colorimetric characteristics of crop canopy presented in digital images
Hungarian Association of Agricultural Informatics European Federation for Information Technology in Agriculture, Food and the Environment
Journal of Agricultural Informatics. Vol. 7, No. 1
journal.magisz.org
Evaluation of wheat nitrogen status by colorimetric characteristics of crop
canopy presented in digital images
Victor P. Yakushev1, Elena V. Kanash2
I N F O
Received 8 Dec. 2016. Accepted 6 Mar. 2016 Available on-line 30 Apr. 2016 Responsible Editor: M. Herdon
Keywords:
nitrogen deficiency, digital image, spatially differentiated fertilization, CIELAB colour system.
A B S T R A C T
The main factor responsible for non-uniform density of planting is the inequality of soil fertility in different parts of the field and above all the inequality of the content of available nutrients. The aim of our work is to study, in field conditions, the relationship between the nitrogen status of crops and colorimetric characteristics of their digital images and to develop a method of selecting uniform management zones for spatially differentiated fertilization. The field was photographed using a small radio-controlled aircraft equipped with a digital high resolution camera at the flight altitude of 500-700 m. The colour of crop images was characterized by parameters L, A and B of the CIELAB colour system. Changes in these parameters (∆L, ∆A and ∆B), hue (∆C) and saturation (∆H) were calculated relative to their values at reference plots with different content of nitrogen in the soil. Dissimilarities in the colour of the crop canopy between reference plots and various sections of the field were determined from the value ∆E that summarizes changes in the parameters L, A and B. To quantify nitrogen status of plants for spatially differentiated fertilization, regression relationships between colour characteristics of the canopy and the dose of nitrogen at test plots were used. The experiment performed has shown that the method we used to analyze colorimetric characteristics of crop canopy by its digital image, test plots with known nitrogen content in the soil including, is of considerable promise for quantitative evaluation of plant needs in nitrogen nutrients, management zones selection and spatially differentiated fertilization.
Introduction
Availability of nutrients is one of the principal conditions of attaining maximum potential productivity of each crop and variety. The problem of maintaining balance between crop yields, profits and environment protection can be solved with the help of a new agricultural strategy which consists in applying fertilizers with regard for spatial and temporal heterogeneity of plant provision with nutrients during the vegetation period. It is implied that the amount of nutrients provided will be fully utilized by plants.
At present, the assessment of crop canopy spatial heterogeneity and differentiated fertilizer application are performed on the basis of various optical criteria. The most widely used of them are the simplest indices that permit to evaluate, more or less accurately, parameters of plant growth and represent either a simple ratio of reflectance values in two spectral regions or a difference between these values (Jordan, 1969; Tucker, 1979). Most of reflection indices used in the evaluation of plant nitrogen status exhibit a close correlation with the content of chlorophyll (Blackburn, 1998; Datt, 1999; Sims and Gamon, 2002, and others). These indices may be defined with the help of multispectral aerospace vehicles having spectral channels in the red (600-750 nm) and near infrared (750-1300 nm) regions. It is these vehicles that are most often used presently in assessing crop canopy condition.
1Victor P. Yakushev 2Elena V. Kanash
doi: 10.17700/jai.2016.7.1.268 66 V.P. Yakushev , E.V. Kanash: Evaluation of wheat nitrogen status by colorimetric characteristics of crop canopy presented in digital images
However, methods of remote sensing based on the estimation of chlorophyll content do not always detect the deficiency of the pigment early in its development. Thus, when studying variation of wheat optical properties with the intensity of plant growing technology, we observed no close correlation between chlorophyll index and net productivity at early stages of nitrogen deficiency, such dependence appearing only after considerable reduction of the green pigment content (Kanash, Osipov, 2009). At early stages of stress, when chlorophyll concentration does not change or changes only slightly, growth inhibition may be evidenced, for instance, by increased value of photochemical reflection index as well as by indices of anthocyanins, flavonols and carotenoids (Kanash, Osipov, 2009; Yakushev et al., 2010). Changes in the value of these indices suggest a less effective utilization of photosynthetically active radiation, a poorer assimilation of carbon and a slower growth rate. The above indices can be determined with the availability of the equipment that is capable of carrying out a hyper-spectral assessment of the plants and obtaining hyper-spectral aerospace photographs in remote sensing.
Multispectral remote sensing, and still more so the hyper-spectral one, make possible to perform monitoring of crops state with high degree of accuracy and promptly take necessary corrective actions. However, this method has grave disadvantages, such as high maintenance costs, a limited number of remote sensing stations and weather dependent performance of the system. Drawbacks inherent in remote sensing carried out from satellites may be avoided by using light aircrafts that allow to survey the field and obtain promptly high-quality aerial photographs. Remote sensing carried out from low altitude attracts attention of both research and practical workers owing to the rapidity of operation and relatively low expenditures, as well as high resolution of the equipment and high accuracy of observations.
Appliances for remote sensing from low altitudes, such as hyper-spectral reflection sensors, SPAD 502, GreenSeeker ® and Yara N sensor have been employed successfully for crop monitoring and evaluation of crops nitrogen status. However, some of these instruments are too expensive for the farmers while the cheaper ones are able only to indicate the need of nitrogen dressing but cannot quantify the dose to be applied. In this connection, a number of researchers wishing to estimate the demand of plants for nitrogen in due time used crop photographs taken with digital cameras and then evaluated the condition of crops from the colour of crop canopy. Basing on the colour system RGB, they determined the indices correlated with the chlorophyll content as measured per leaf area (Kawashima and Nakatani, 1998) or per unit area of crop canopy (Jia et al., 2004; Lee and Lee, 2011). It has been also demonstrated with rice plants that the intensity of crop canopy colour is closely related to plant biomass at the stages of ear formation and flowering. Methods of digital visualization were also employed for measuring the extent of projective cover that is related to leaf area index, above-ground biomass and nitrogen content at early stages of plant development (Lee and Lee, 2011).
doi: 10.17700/jai.2016.7.1.268 67 V.P. Yakushev , E.V. Kanash: Evaluation of wheat nitrogen status by colorimetric characteristics of crop canopy presented in digital images
Materials and methods
Objects and variants of the experiment
The experiment was carried out in field conditions at Menkovo branch of the Agrophysical Research Institute (Leningrad region, the north-western part of Russia) during growing seasons of 2008-2010. Wheat plants (Triticum aestivum L. cultivar Ester) were grown in the experimental fields with the area of 6.5 – 7.5 ha. Three variants of the experiment procedure were tried.
Variant 1. Extensive technology (C) – no fertilizers were applied (control), initial content of nitrogen in the soil before sowing varied from 20 to 60 kg/ha;
Variant 2. Standard Russian technology (N) – application of nitrogen fertilizer before sowing at a rate of 40-60 kg/ha (FBS-60); no additional dressing was applied during the vegetation period.
Variant 3. High-intensity technology (HI) – FBS-60 plus two water-soluble nitrogen dressings (WSN) at the stages of tillering and shooting with a cumulative dose of 60 kg of active fertilizer per hectare.
Fertilizers were applied in two ways: a necessary amount of nitrogen was either distributed uniformly over the field or applied in different doses depending on the content of nitrogen in the soil and optical properties of the crop canopy at given section of the field.
Radio-controlled aircraft and image acquisition
Digital images of crops were obtained with an unmanned radio-controlled aircraft engineered at the Agrophysical Research Institute. Aerial photographs were taken with digital SLR cameras Olimpus E510 or Canon EOS Rebel Tli from the height of 300-500 meters. All images were saved in JPEG
format with the highest quality and minimal compression.
The camera was connected to the aircraft remote control station. Aerial photographs taken at the aircraft turnaround at the end of the rout were discarded when the value if only of one angle of aircraft orientation (tangage, bank, yaw) exceeded 3°. Digital images were combined and related to the Global Positioning System with ERDAS Imagine software. Aerial photography was performed once in 7-10 days.Test plots
To quantify nitrogen status of plants and to select homogenous zones for spatially differentiated fertilization, regression relationships between colour characteristics of the canopy and the dose of nitrogen in test plots were used. The area of one test plot was equal to 25 m2. Different doses of
ammonium nitrate: 0, 30, 60, 90, 120, 150, 180, 210 kg/ha were introduced by hand into the soil of test plots before sowing. Test plot with maximum nitrogen content in the soil of a given field (210 kg/ha) was taken as reference area while colorimetric characteristics of the canopy in this plot were taken as reference for comparing with them canopy colorimetric characteristics in other test plots and other sites of the field. The difference in canopy colorimetric characteristics between reference plot and test plots with lower content of nitrogen was used to plot a calibration curve allowing to evaluate quantitatively the provision of plants with nitrogen in different sections of the experimental field.
In quantifying nitrogen status of plants, only high-quality aerial photographs with the whole field and the test plots clearly visible were employed. Uniform illumination of the field without any shadows from the clouds was a necessary condition when selecting a photograph for further examination.
Colour characteristics and colour theory
doi: 10.17700/jai.2016.7.1.268 68 V.P. Yakushev , E.V. Kanash: Evaluation of wheat nitrogen status by colorimetric characteristics of crop canopy presented in digital images
the distance between two points indicates the difference in colour between two objects. When colour is related to the coordinates of this model, the values L, A and B represent lightness, red/green and yellow/blue components, correspondingly (CIE Colorimetry, 1986). In this model, the value of L is separated from the value of chromatic component (hue, saturation). The maximum value (L=100) corresponds to white colour of an ideally reflecting diffuser, the minimum value (L=0) corresponds to black colour. Numerically, axes A and B are not limited. Positive A values are characteristic of red objects, negative values of green ones. Positive B values represent yellow objects, while negative values correspond to those of blue colour. Axes A and B intersect and designate the diameters of the circle along whose circumference the hue (H) changes whereas changes in colour saturation (C) are plotted along the radius.
Associated with the colour scale CIELAB are delta values ΔL, ΔA and ΔB which show how much two objects (for instance, a reference plot and a tested sample) differ in parameters L, A and B (Fairchild, 2005). When plant demand for nitrogen nutrition is determined from colorimetric characteristics of crop canopy, delta values allow to estimate the difference in the provision of nitrogen between L, A and B of plants in a given section of the field (a sample) and L, A and B in a test plot with a maximum dose of nitrogen to be applied in the field (a reference plot). The lower are the values ΔL, ΔA and ΔB, the less is the difference between a sample and a reference plot, which may serve as an indication of equal or nearly equal supply of nitrogen. Differences between two points in the three-dimensional space of CIELAB may be estimated from a single value ΔE that takes into account differences in the values of L, A and B and represents a segment of the straight line drawn in a three-dimensional coordinate system between two points corresponding to the colours being compared:
2 2
2 A B
L
E
(1)
The value ΔE does not indicate which colour characteristic of the sample differs from that of the reference plot (L, A and/or B) but merely gives evidence of differences in colour (Plataniotis and Venetsanopoulos, 2002). The value of ΔE increases with building-up of colour differences between the reference plot and the sample.
There are also two other delta values related to the colour scale CIELAB that characterize the difference in colour saturation (ΔС) and hue (ΔH):
ΔС = Csample – Creference , (2) where
2 2
B A
С (3)
2 2 2 C L E
H
(4)
Data acquisition and analysis
To measure colorimetric characteristics, aerial photographs of the field and test plots taken from radio-controlled aircraft are downloaded into the program of image processing. The photos are analyzed with the program Adobe Photoshop CS4 Portable (*jpeg, 8 bit) or with another program capable of processing digital images and recording their colorimetric characteristics. A digital image is covered with a grid; spatial positions of the grid cells may be pin-pointed because coordinates of the field as well as position of various landmarks and cropping strips on the field are determined beforehand with the help of GPS navigation system. The size of a cell was usually specified equal to 9 x 9 m. Colorimetric characteristics of digital images are conveniently measured in the Histogram windowby Lab mode. The colour spacemodel Lab is an early version of CIELAB, their components relationship is described by Equations 5-7:
100
)
255
/
(
L
L
CIELAB (5)120
))
255
/
)
240
((
A
A
CIELAB (6)120
))
255
/
)
240
((
B
doi: 10.17700/jai.2016.7.1.268 69 V.P. Yakushev , E.V. Kanash: Evaluation of wheat nitrogen status by colorimetric characteristics of crop canopy presented in digital images
The colorimetric characteristics of the crop canopy are measured in the test plots or sections of the field which are chosen with the help of the Rectangular Marquee instrument. The mean L, A, B values, their median and standard deviation, as well as the number of pixels inside the area chosen are displayed in the Histogram window of the program Adobe Photoshop CS4 Portable.
Results and discussion
The relationship between provision of plants with nitrogen and colorimetric characteristics of crop cover
Figure 1 displays an aerial photograph of the field with wheat variety Ester at the stage of ear formation. It can be seen that coloration of the plant canopy is uneven which results from different rates of fertilizer application. Test plots are situated in that section of the field where neither presowing nor supplementary fertilization was carried out, – in other words, they represent Variant 1 of the experiment.
1 2 3 4 5 6 7 8 9 10 11 12 13 14 15 16 17 18
a
b
c
d
e
f
g
h
i
j
k
l
m
n
o
p
q
r
s
t
u
Figure 1. Aerial photograph of the field with wheat variety Ester. Each pixel covers 0.25 × 0.25 m2 of
a field area. Test plots are framed in red. The soil of test plots was fertilized with nitrogen before sowing at a rate of 0, 30, 60, 90, 120, 150, 180 and 210 kg/ha. At the right of the figure there are values of ΔE that refer to the section of the field in yellow frame and show the difference in colorimetric characteristics between crop canopy in the reference test plot and various parts of this section (g12 – j17). Coordinates of these parts are displayed in bold face.
12
13
14
15
16
17
g
22.4 20.7 17.2 14.7 11.6 15.9
h
19.5 17.2 14.4 11.4 8.1 12.1
i
18.1 16.7 16.4 14.5 7.5 9.7
doi: 10.17700/jai.2016.7.1.268 70 V.P. Yakushev , E.V. Kanash: Evaluation of wheat nitrogen status by colorimetric characteristics of crop canopy presented in digital images
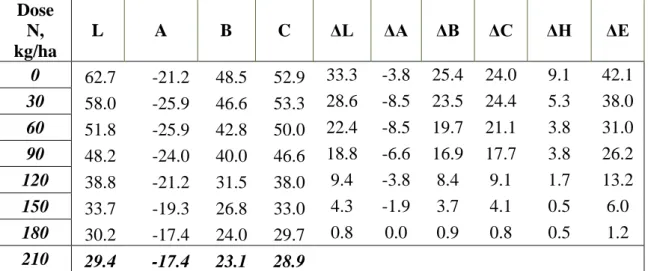
Table 1 lists colorimetric characteristics of crops in the test plots of Fig. 1. As may be seen, crops in all test plots with lower dose of applied fertilizers differ from those in the reference plot with 210 kg of nitrogen per hectare, values L and B displaying most notable variation with the increase of fertilizer dose. There is a close inverse relationship between the value of ∆L and nitrogen dose which manifests itself in the fact that in conditions of nitrogen deficiency crops become lighter in colour. When the dose of nitrogen is 180 kg/ha, ∆L of crop canopy is 40 times greater than that of the crop in the reference plot where nitrogen has not been applied and plants suffer from acute nitrogen deficiency. Positive values of ∆B indicate the increased proportion of yellow in crop coloration as compared with crops in the reference plot. The higher is the value of ∆B, the more pronounced is the yellow colour of plants suffering from nitrogen deficiency. In the test plots with 150 kg of nitrogen per hectare this value is 4 times higher than in the plots with 180 kg/ha, while in the plots without nitrogen it is 25 times higher. Negative values of ∆A indicate that green colour of the crop is less pronounced than that in the reference plot. Absolute values of ∆A, ∆L and ∆B make it possible to evaluate quantitatively the extent of the changes taking place under nitrogen deficit.
Nitrogen deficiency causes reduction in colour saturation which is accompanied by the increase of ∆C values and changes in hue (∆H). High values of ∆H indicate major changes of crop canopy colour.
Table 1.
Mean values of colorimetric characteristics of crops in the test plots and parameters
indicating their deviation from reference values
Dose
N,
kg/ha
L
A
B
C
ΔL
ΔA
ΔB
ΔC
ΔH
ΔE
0
62.7
-21.2
48.5
52.9
33.3
-3.8
25.4
24.0
9.1
42.1
30
58.0
-25.9
46.6
53.3
28.6
-8.5
23.5
24.4
5.3
38.0
60
51.8
-25.9
42.8
50.0
22.4
-8.5
19.7
21.1
3.8
31.0
90
48.2
-24.0
40.0
46.6
18.8
-6.6
16.9
17.7
3.8
26.2
120
38.8
-21.2
31.5
38.0
9.4
-3.8
8.4
9.1
1.7
13.2
150
33.7
-19.3
26.8
33.0
4.3
-1.9
3.7
4.1
0.5
6.0
180
30.2
-17.4
24.0
29.7
0.8
0.0
0.9
0.8
0.5
1.2
210
29.4
-17.4
23.1
28.9
Note: Shown in bold italics are colorimetric characteristics of crop canopy in the reference test plot. The standard deviation of L, A, B is less than 13, 2, and 3 respectively.
Evaluation of plants provision with nitrogen by colorimetric characteristics of crop digital images
doi: 10.17700/jai.2016.7.1.268 71 V.P. Yakushev , E.V. Kanash: Evaluation of wheat nitrogen status by colorimetric characteristics of crop canopy presented in digital images
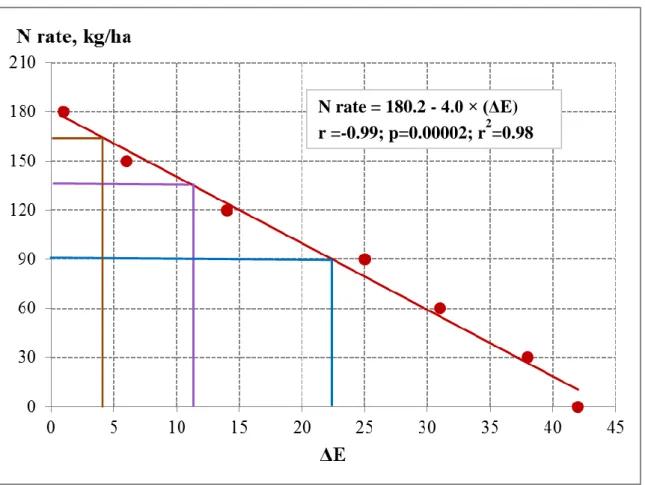
Figure 2. Differences in the colour of crop canopy (∆E) between the reference test plot (with nitrogen content 210 kg/ha) and other test plots (with nitrogen content 0, 30, 60, 90, 120, 150 and 180 kg/ha). The calibration curve plotted indicates provision of plants with nitrogen. Lines below the calibration curve illustrate provision of various sections of the field with nitrogen as determined from ∆E (Eq. 1): J16 – brown colour, h15 – violet, g12 – blue.
It can be seen that the relationship between ∆E values and the content of nitrogen in the range from 0 to 180 kg/ha is a linear one and may be described with a high degree of accuracy by an equation of linear regression (p = 0.000002):
∆Е = 44.43-0.243N (8),
where N is the amount of nitrogen fertilizer applied before sowing.
Colour differences ∆E of crops colorimetric characteristics between field plots j16, h15 and g12 and the reference test plot are equal to 3.8, 11.4 and 22.4, which corresponds to nitrogen doses of 165, 135 and 90 kg/ha, correspondingly. Results of evaluation of plants provision with nitrogen in various sections of the experimental field are given in Table 2. The table demonstrates significant spatial heterogeneity due to different fertilizer doses in different experimental variants and under different nutrient conditions within one variant.
doi: 10.17700/jai.2016.7.1.268 72 V.P. Yakushev , E.V. Kanash: Evaluation of wheat nitrogen status by colorimetric characteristics of crop canopy presented in digital images
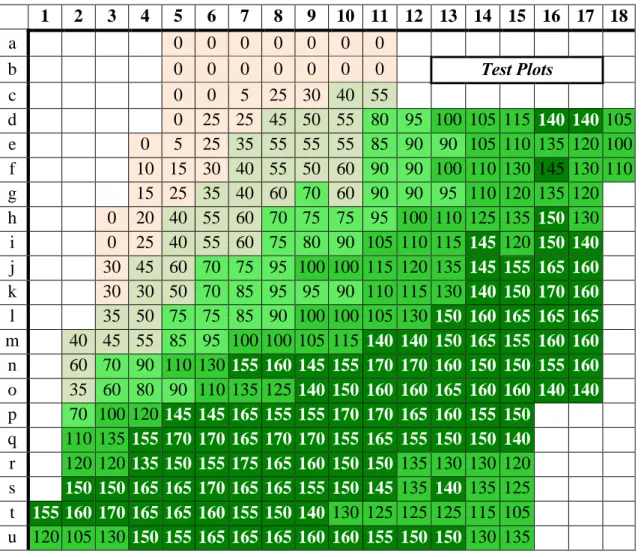
Table 2. The chart illustrating plant provision with nitrogen as determined by evaluating crop
colorimetric characteristics on the basis of digital images of the experimental field
1
2
3
4
5
6
7
8
9 10 11 12 13 14 15 16 17 18
a
0
0
0
0
0
0
0
b
0
0
0
0
0
0
0
Теst Plots
c
0
0
5 25 30 40 55
d
0 25 25 45 50 55 80 95 100 105 115
140 140
105
e
0
5 25 35 55 55 55 85 90 90 105 110 135 120 100
f
10 15 30 40 55 50 60 90 90 100 110 130 145 130 110
g
15 25 35 40 60 70 60 90 90 95 110 120 135 120
h
0 20 40 55 60 70 75 75 95 100 110 125 135
150
130
i
0 25 40 55 60 75 80 90 105 110 115
145
120
150 140
j
30 45 60 70 75 95 100 100 115 120 135
145 155 165 160
k
30 30 50 70 85 95 95 90 110 115 130
140 150 170 160
l
35 50 75 75 85 90 100 100 105 130
150 160 165 165 165
m
40 45 55 85 95 100 100 105 115
140 140 150 165 155 160 160
n
60 70 90 110 130
155 160 145 155 170 170 160 150 150 155 160
o
35 60 80 90 110 135 125
140 150 160 160 165 160 160 140 140
p
70 100 120
145 145 165 155 155 170 170 165 160 155 150
q
110 135
155 170 170 165 170 170 155 165 155 150 150 140
r
120 120
135 150 155 175 165 160 150 150
135 130 130 120
s
150 150 165 165 170 165 165 155 150 145
135
140
135 125
t
155 160 170 165 165 160 155 150 140
130 125 125 125 115 105
u 120 105 130
150 155 165 165 165 160 160 155 150 150
130 135
To obtain the grain yield of 5 t/ha in the given experimental field, the dose of nitrogen applied must be no less than 175 kg/ha. Therefore, in accordance with the schematic map of Table 2, 115 – 155 kg of nitrogen per hectare should be applied in Variant 1 (technological zone 1), 45 – 95 kg/ha in Variant 2 (technological zone 2) and 5 – 40 kg/ha in Variant 3 (technological zone 3).
doi: 10.17700/jai.2016.7.1.268 73 V.P. Yakushev , E.V. Kanash: Evaluation of wheat nitrogen status by colorimetric characteristics of crop canopy presented in digital images
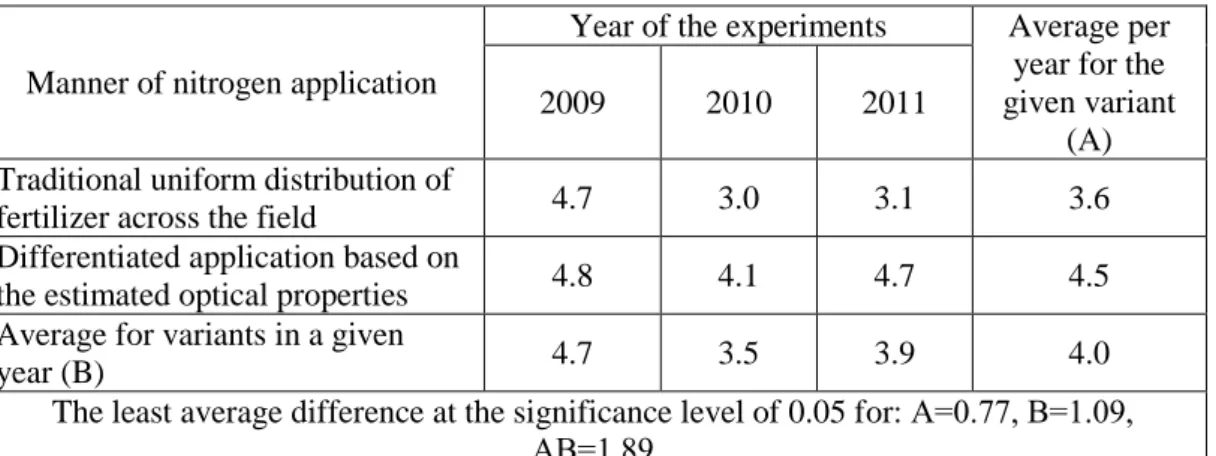
Table 3. Relationship between the manner of nitrogen fertilizer application and wheat grain yield (t/ha). Intensive growing technology (Variant 3).
Manner of nitrogen application
Year of the experiments Average per year for the given variant
(А) 2009 2010 2011
Traditional uniform distribution of
fertilizer across the field 4.7 3.0 3.1 3.6 Differentiated application based on
the estimated optical properties 4.8 4.1 4.7 4.5 Average for variants in a given
year (B) 4.7 3.5 3.9 4.0
The least average difference at the significance level of 0.05 for: А=0.77, В=1.09, АВ=1.89
Note: for each manner of nitrogen application shows the average grain yield from three experimental plots of the field ranging from 2 to 3 hectares.
It should be noted that nowadays the technology of precise application of fertilizers and other agricultural chemicals that implies, among other things, evaluating condition of soil and plant cover, is still in the initial stage of its commercial use in Russia. It may be explained, first of all, by rather high cost of equipment necessary for the implementation of this technology, its low resolution demanding newly developed or advanced software as well as lack of adequate data base, knowledge and experience in carrying out precision operations. Evaluation of plant nitrogen status from colorimetric characteristics of crop digital images was performed with high resolution. Employment of test plots with different content of nitrogen in the soil makes it possible to plot calibration curves and estimate quantitatively plant requirements for nitrogen, enabling spatially differentiated application of fertilizers.
Conclusion
Remote sensing of crops and leaves condition by means of digital images and three-dimensional model of colour representation CIELAB allows to estimate spatial and temporal heterogeneity of wheat physiological state and detect mineral nutrients deficiency at early stages of its development.
The method of quantitative evaluation of plant demand for nitrogen based on the analysis of colorimetric characteristics of crop digital images is very promising. It ensures high resolution, is not expensive and time-consuming. Digital images may be obtained quickly at different stages of plant vegetation and development, which enables monitoring of plant growth dynamics and crop condition. Analyzing crop colorimetric characteristics by aerial photographs, it is possible to mark out technological zones and make up map reference for differentiated fertilizer application when performing dressing during vegetation period. An additional advantage of the method based on the analysis of crop aerial photographs is the possibility to archive and store data as database that can be used in future research work. Aerial photographs permit to estimate requirements of plants for fertilizers over large areas, which is extremely difficult to do from the ground.
Reference
Blackburn G.A. 1998. Quantifying chlorophylls and carotenoids at leaf and canopy scales; An evolution of some hyperspectral approaches. Remote Sensing of Environment. 66 (3) 273-285.
doi: 10.1016/s0034-4257(98)00059-5
doi: 10.17700/jai.2016.7.1.268 74 V.P. Yakushev , E.V. Kanash: Evaluation of wheat nitrogen status by colorimetric characteristics of crop canopy presented in digital images
Datt B. 1999. Visible near infrared reflectance and chlorophyll content in eucalyptus leaves. International journal of Remote Sensing. 20 (4) 2741-2759. doi: 10.1080/014311699211778
Fairchild M. D. 2005. Color appearance models. USA, John Wiley &sons Ltd., 385 pp.
Graeff S., Pfenning J., Claupein W., Leibig H-P. 2008. Evaluation of image analysis to determine the N-fertilizer demand of broccoli plants (Brassica oleraceae convar. Botrytis var. italica). Advances in optical technologies. Volume 2008 (2008), Article ID 359760, 8 pages. doi: 10.1155/2008/359760
Jia, L., Chen, X., Zhang, F., Buerkert, A. and Romheld, V. 2004. Use of digital camera to Assess nitrogen status of winter wheat in the northern China plain. Journal of Plant Nutrition 27(3) 441-450.
doi: 10.1081/pln-120028872
Jordan C. F. 1969. Derivation of leaf area index from quality of light on the forest floor. Ecology 50 663-666. doi: 10.2307/1936256
Kanash E.V., Osipov Ju.A. 2009. Optical signals of oxidative stress in crops physiological state diagnostics. Proceeding 7th European Conference on Precision Agriculture, July 6-8, 2009 Precision agriculture 2009, edited
by E.J. van Henten, D. Goense, C. Lokhorst. Wageningen, Netherlands. pp. 81-89.
Kawashima, S., Naktani, M. 1998. An algorithm for estimating chlorophyll content in leaves using a video camera. Annals of Botany 81 49-54. doi: 10.1006/anbo.1997.0544
Lee K. J., Lee B. W. 2011. Application of Color Indices and Canopy Cover Derived from Digital Camera Image Analysis to Estimate Growth Parameters of Rice Canopy // Precision Agriculture. 2011. Ed. J.V. Stafford, Ampthill, UK. Proceeding of 8th European Conference on Precision Agriculture. Prague, 11-14 July 2011, pp.
111-121.
Plataniotis K.N., Venetsanopoulos A.N. 2000. Color Image Processing and Applications. Springer-Verlag, Berlin, Heidelberg, 353 pp. doi: 10.1007/978-3-662-04186-4
Sims D.A., Gamon J.A. 2002. Relationships between leaf pigment content and spectral reflectance across a wide range of species, leaf structures and developmental stages. Remote Sensing of Environment 81 (2-3) 337-354. doi: 10.1016/s0034-4257(02)00010-x
Tucker C.J. 1979. Red and photographic infrared linear combinations for monitoring vegetation. Remote Sensing of Environment 8 127-150. doi: 10.1016/0034-4257(79)90013-0