*Correspondence to Author:
Amin S. Hamdi
Department of Civil Engineering, King Abdulaziz University, Jeddah, Saudi Arabia
How to cite this article:
Amin S. Hamdi. Performance
Anal-ysis and Classification of the Ports
in Gulf Countries Using Data Envel-opment Analysis. American Journal of Transportation and Logistics, 2019,2:13.
eSciPub LLC, Houston, TX USA. Website: https://escipub.com/
Amin S. Hamdi, AJTL, 2019; 2:13
American Journal of Transportation and Logistics
(ISSN:2637-6172)
Research Article AJTL 2019, 2:13
Performance Analysis and Classification of the Ports in Gulf
Countries Using Data Envelopment Analysis
The study assesses relative efficiency and performance charac -teristics of the major ports in gulf countries using data envelop-ment analysis (DEA). Ports play key role in economic activities
of these countries. The study reveal that technical efficiency of
the ports in the region varies widely with mean constant and variable return to scale of 67.5 and 91 percent, respectively. Port
Jabel Ali in UAE is identified as the benchmark for most of the inefficient ports indicating that the inefficient ports of the region
should follow operational strategies of Port Jabel Ali. Also, all the inefficient ports of the region demonstrate increasing return to scale implying that their performance may improve with the scale of operation. Policy makers may consider investment to enhance operational scope of these ports.
Keywords: Ports; Data Envelopment; Analysis Efficiency; Scale.
Amin S. Hamdi
Department of Civil Engineering, King Abdulaziz University, Jeddah, Saudi Arabia
ABSTRACT
INTRODUCTION
Ports are essential entity in international trade and commerce of any country. They perform as indispensable intermodal connectivity node facilitating exports and imports for industrial and commercial activities. As the intermodal transfer node between waterway and land surface modes, port efficiency is vital for global logistic operation. Moreover, operational efficiency of the ports critically affect regional productivity and competitiveness (Wu and Goh, 2010 and Kutin et al., 2017). Liu (2008) suggest that port efficiency is an important indicator of regional economic activity. Jiang and Li (2009) recommend to monitor port performance for microeconomic development policy processing.
Review of previous studies related to port performance reveal that most of them primarily concentrated on European or East Asian countries. Also, majority of these studies focused on container services (Cullinane et al., 2006). Lack of data availability may be one of the major reasons of scarcity of literature on port performance in gulf countries (Al-Eraki et al, 2010). Particularly for the gulf countries, performance of the ports are very significant as their economy heavily relies on exports and imports. Zahran et al (2015) compared performance of Saudi ports with ports of other countries using revenue as output variable. The authors reported widely varied efficiencies for different model specifications and suggested for further studies in this regard.
Port functionality and management is highly complex. Also, analysis of port performance becomes more challenging due to unavailability of data, lack of transparency and varied operational procedures (Zahran et al., 2017). Usually port authorities rely on wide range of modelling frameworks for port operational management and planning (Zahran et al., 2015). Parametric and non-parametric approaches are the two broad categories of modeling framework that are extensively used in port performance analysis. Among the parametric methods stochastic frontier analysis (SFA) is the most
frequently used parametric approach (Medda and Liu, 2013 and Sarriera et al, 2013). Among the non-parametric approaches application of Data Envelopment Analysis (DEA) is highly prevalent (Hung et al., 2010, Demirel et al., 2012, Schoyen and Odeck, 2013, Ding et al, 2015).
This study analyzes relative efficiency of nine major ports in gulf region, identifies the efficient ports in the region and examine their performance characteristics. Classical Data Envelopment Analysis (DEA) approach is used to measure efficiency and performance indicators, assess production frontier, and evaluate intervention policies for performance improvement. The study contributes in assisting the policy makers to identify performance limitations and provide policy directives for future development.
METHODOLOGY
As mentioned earlier that the methods for performance benchmarking of production entity is usually categorized into parametric and non-parametric framework. Parametric methods, like Stochastic Frontier Analysis (SFA) and Free Disposable Hull (FDH), are based on the assumption of particular population distribution. But, researchers observed that such preemptive assumptions might be very restrictive (Xu and Ishiguro, 2019). Nonparametric approaches, like Data Envelopment Analysis (DEA), do not require such restriction and models can be calibrated using few samples. Due to its simple and flexible structure DEA has evolved as the most suitable tool for assessing efficiency of production entities (Zahran et al.,2015).
AJTL: https://escipub.com/american-journal-of-transportation-and-logistics/ 3
of production unit as the ratio between weighted inputs and outputs stratifying the constraint that the maximum value of the efficiency must not exceed 1. Recently the envelopment form has
become very popular due to its computational benefit (Kutin et al, 2017). Mathematical framework for efficiency assessment of DEA in multiplier form is shown below.
(1)
Where u and v are the weights corresponding to s outputs (y) and m inputs (x) respectively. This model may be solved for all decision-making units (n) to maximize its relative efficiency. It can be further simplified into linear programming
form for computational purpose. The model can also be expressed as input oriented envelop form with constant return to scale (CRS) as follows.
(2)
Notation: K inputs, M outputs, i firms
xi is K1 vector of inputs of i-th firm qi is M1 vector of outputs of i-th firm
X is a KI input matrix, Q is a MI output matrix
is a scalar (=TE), is a I1 vector of constants It is extended to variable return to scale (VRS) by incorporating the following constraint in Equation 2 (Banker et al, 1984).
∑ 𝜆 = 1 (3)
Besides efficiency calculation, outputs of the DEA provide useful information regarding shadow price of the input and output resources through the multipliers of model in Equation 1 or slacks of envelopment form in Equation 2 (Alam et al, 2004). Also, for any decision-making entity (jo) the optimal values of λ identifies the set of corresponding efficient entities, called reference set or peer group, and define the production frontier.
The conventional forms DEA methodology do not incorporate uncertainty or errors in input and output values. To assess confidence interval of efficiency estimates DEA framework can be further extended by using bootstrap technique and fuzzy framework (Hatami-Marbibi et al, 2014).
In order to extract useful information from DEA model it should formulated with specific purpose, the decision-making units with their inputs and outputs should be clearly identified, and the
max ℎ𝑢,𝑣𝑗𝑜 =∑ 𝑢𝑟𝑦𝑟𝑗𝑜
𝑠 𝑟=1
∑𝑚 𝑣𝑖𝑥𝑖𝑗𝑜
𝑖=1
s.t. ∑ 𝑢𝑟𝑦𝑟
𝑠 𝑟=1
∑𝑚𝑖=1𝑣𝑖𝑥𝑖
≤ 1, 𝑗 = 1, … … . . , 𝑗𝑜, … . . 𝑛
𝑢𝑟, 𝑣𝑖 ≥ 𝜖 ∀𝑟, 𝑖
Min, ,
st -qi + Q0,
xi - X0,
model should be appropriately oriented (Almawsheeki and Shah, 2015 and Cook et al, 2014).
VARIABLES AND DATA SETS Input and Output Variable
Selection of variable is the key step in performance investigation that should reflect the objective of the analysis and underlying production mechanism or function. Previous studies suggest that land, labor and capital are
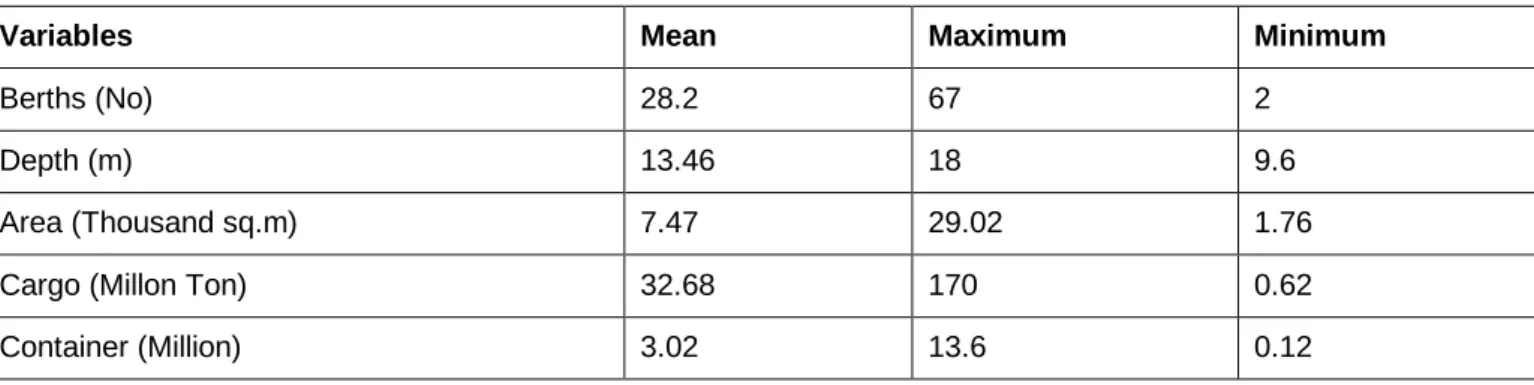
principal factors affecting productivity of the ports. Usually labor data is very difficult to collect and is not generally reported in public reports. In this study, we analyzed port efficiency on the basis of land and infrastructure (no of berths and channel depth) as input variable, while container and cargo throughputs as port outputs (Almawsheki and Shah, 2015 and Panayides et al, 2009). Statistical parameters are summarized in Table 1 below.
Table 1 Summary statistics of the variables for efficiency analysis
Variables Mean Maximum Minimum
Berths (No) 28.2 67 2
Depth (m) 13.46 18 9.6
Area (Thousand sq.m) 7.47 29.02 1.76
Cargo (Millon Ton) 32.68 170 0.62
Container (Million) 3.02 13.6 0.12
The basic requirement of performance analysis is the identification of decision making units. This study analyzes the major ports of the gulf countries that include Saudi Arabia, United Arab
Emirates and Oman. The nine ports those are included in the study are shown in Figure 1 and described in Table 2 below.
AJTL: https://escipub.com/american-journal-of-transportation-and-logistics/ 5
Table 2. Ports of Gulf Countries included in the Study
ID Country Ports
FIP Saudi Arabia King Fahd Industrial Port Yanbu JIP Saudi Arabia Jeddah Islamic Port
KAP Saudi Arabia King Abdulaziz Port IPJ Saudi Arabia Industrial Port Jubail
SPO Oman Sohar Port
PSO Oman Port Salalah
PJA United Arab Emirates Port of Jabel Ali PKF United Arab Emirates Port Khor Fokkan
PMS Bahrain Port of Mina Salman
PSK Kuwait Port of Shuwaikh
For the DEA based efficiency analysis we employed input oriented DEA model for both constant (CRS) and variable (VRS) return to scale. We analyzed efficiencies for multiplier and envelopment forms to assess shadow prices and slacks of the input variables. We used R software packages to analyze efficiency and associated indicators (R Core Team, 2019).
EMPIRICAL ANALYSIS
This section presents the results of analyzes that include technical efficiency of the major ports in gulf countries, scale of production, shadow prices, and slacks corresponding to the input variables. Also, we identified the benchmarks for the inefficient ports and confidence interval of efficiency values.
Relative Technical Efficiency Score of Ports in Gulf Countries
Efficiency scores for the ports is presented in Table 3 and Figure 2 including benchmarks and return to scale information. It is observed that the efficiencies of the ports in gulf region varies widely with mean efficiencies of 67.5 and 91 percent for CRS and VRS, respectively. Also the CRS efficiencies demonstrate wider variation. Ports Jabel Ali, King Abdulaziz, Salaha and Sohor are performing efficiently, while Port Khor Fokkan, Industrial Port Jubail and Port Mina Salman are the most inefficient ports in the region. All the inefficient ports demonstrate increasing return to scale.
Table 3. Efficiency scores of the ports
DMU Efficiency (CRS) Efficiency
(VRS)
Scale
Efficiency
Benchmarks/ References
Lamda sum
Return to Scale
Statistics CRS VRS
Max Efficiency 1.0 1.0
Min Efficiency 0.29 0.71
Mean Efficiency 0.675 0.91
Standard Deviation 0.315 0.114
Figure 2. Summary of Port Efficiency Analysis
Benchmarks
Table 3 shows the benchmarks or reference decision making ports corresponding to the inefficient ports. The benchmarks identify relevant best practice peers for the inferiorly performing DMUs. The inefficient ports can track the relevant benchmarks to improve their performance. Table 3 reveals that Port Jabel Ali is identified as the benchmarks for most of the inefficient ports of the region.
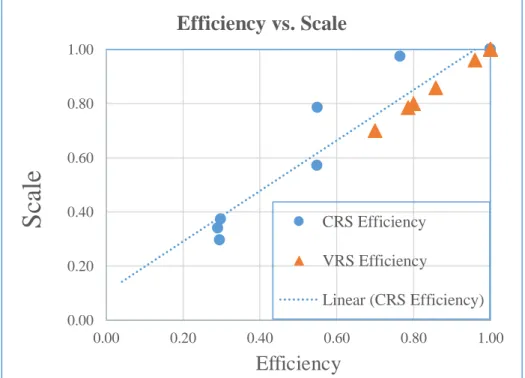
Scale Efficiency and Return to Scale
As mentioned earlier that the ratio between CRS and VRS efficiencies provide information regarding scale efficiency. From Table 3 it is evident that all the inefficient ports of CRS analysis show increasing return to scale. Also, as shown in Figure 3 overall technical efficiency is highly correlated with scale efficiency for both CRS and VRS cases.
Figure 3. Technical Efficiency vs. Scale 0.00
0.20 0.40 0.60 0.80 1.00
0.00 0.20 0.40 0.60 0.80 1.00
S
ca
le
Efficiency
Efficiency vs. Scale
CRS Efficiency
VRS Efficiency
AJTL: https://escipub.com/american-journal-of-transportation-and-logistics/ 7
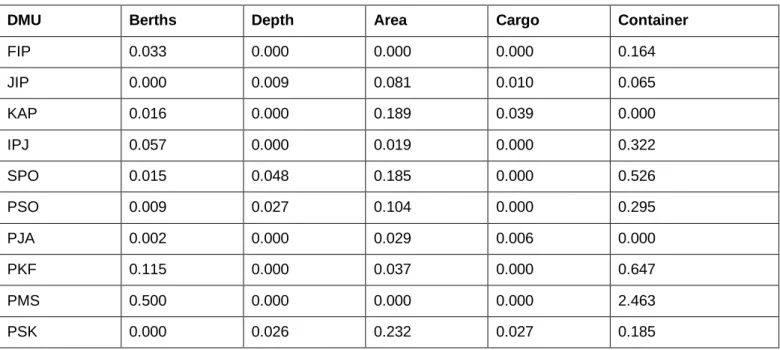
Weights and Slack Variable Analysis
Weights of input and output variables of DEA in multiplier form provides information regarding resource constraint and shadow price. Also, analysis of slack variables provides information for the inefficient units to become efficient by minimizing the input resources (for input oriented models) or maximizing the outputs (for output oriented models). Table 4 shows the measured and CRS target values of the input
variables. The difference between these values provide information about slack (negative gain) in input for variables. As shown in Table 4 the inefficient ports can improve their performance by reducing the inputs by the amounts shown in Gain/Slack column. The input and output weights (Table 5) provides information about shadow/marginal prices of the input and output resources. Larger values of the weights imply higher rate of return for improvement corresponding to the relevant resources.
Table 4. Measured and Target Inputs and Slacks of DEA (Envelopment Form)
DMU Input (Measured) Input (Target) Gain/Slack
Berths Depth Area Berths Depth Area Berths Depth Area
FIP 30.0 15.0 16.7 16.5 3.9 7.1 -13.5 -11.1 -9.6 JIP 58.0 16.0 10.5 30.5 12.2 8.1 -27.5 -3.8 -2.5 KAP 39.0 18.0 2.0 39.0 18.0 2.0 0.0 0.0 0.0 IPJ 16.0 12.0 4.4 4.8 3.5 1.3 -11.2 -8.5 -3.1 SPO 10.0 9.6 2.1 10.0 9.6 2.1 0.0 0.0 0.0 PSO 31.0 16.0 2.9 31.0 16.0 2.9 0.0 0.0 0.0 PJA 67.0 16.0 29.0 67.0 16.0 29.0 0.0 0.0 0.0 PKF 8.0 12.0 2.1 2.3 1.8 0.6 -5.7 -10.2 -1.5 PMS 2.0 10.0 1.8 0.6 0.1 0.3 -1.4 -9.9 -1.5 PSK 21.0 10.0 3.2 8.6 5.5 1.8 -12.4 -4.5 -1.4
Table 5. Weights of inputs and outputs of DEA (Multiplier Form)
DMU Berths Depth Area Cargo Container
FIP 0.033 0.000 0.000 0.000 0.164
JIP 0.000 0.009 0.081 0.010 0.065
KAP 0.016 0.000 0.189 0.039 0.000
IPJ 0.057 0.000 0.019 0.000 0.322
SPO 0.015 0.048 0.185 0.000 0.526
PSO 0.009 0.027 0.104 0.000 0.295
PJA 0.002 0.000 0.029 0.006 0.000
PKF 0.115 0.000 0.037 0.000 0.647
PMS 0.500 0.000 0.000 0.000 2.463
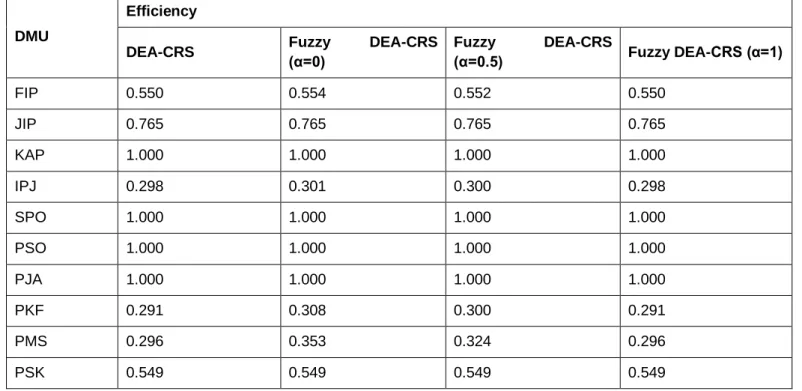
Effect of Data Uncertainty on Efficiency Calculation
Conventional DEA model assumes that the data used for efficiency calculation is accurate and does not allow for any stochasticity. Considering that the information used for efficiency calculation may contain noise, the DEA modeling framework is extended to incorporate
fuzzy concept (Leon et al, 2003). Assuming symmetric triangular fuzzy structure with 10 percent extent of variation for the input and output variables, efficiencies of the DEA model (input oriented CRS) is estimated for different alpha-cuts which are shown in Table 6 below. The table shows that estimated efficiencies remain quite stable.
Table 6. Efficiency of the ports using Fuzzy-DEA
DMU
Efficiency
DEA-CRS Fuzzy DEA-CRS
(α=0)
Fuzzy DEA-CRS
(α=0.5) Fuzzy DEA-CRS (α=1)
FIP 0.550 0.554 0.552 0.550
JIP 0.765 0.765 0.765 0.765
KAP 1.000 1.000 1.000 1.000
IPJ 0.298 0.301 0.300 0.298
SPO 1.000 1.000 1.000 1.000
PSO 1.000 1.000 1.000 1.000
PJA 1.000 1.000 1.000 1.000
PKF 0.291 0.308 0.300 0.291
PMS 0.296 0.353 0.324 0.296
PSK 0.549 0.549 0.549 0.549
CONCLUSION
This study focused on assessing relative efficiency of the major ports in gulf countries with the objective of improving their performance and assist policy makers in formulating strategic policies. DEA framework was used to analyze 10 ports in five countries of the region. Analyses revealed that there exists wide variation in performance efficiencies of the ports considered in the study. Among the 10 ports analyzed, only four performed efficiently that include Port Jabel Ali in UAE, King Abdulaziz Port in Saudi Arabia, and Salalah and Sohar Port in Oman. Although Jeddah Islamic Port is one of the largest ports of the region, it performed incompetently. All the inefficient ports revealed increasing return to scale implying that their performance may improve with increased activity level. Port Jabel
Ali (PJB) was identified as the benchmark for most of the inefficient ports implying that its production policy may be pursued to improve the performance of these inefficient ones. Fuzzy analysis reveal that estimated efficiencies were reasonably stable.
AJTL: https://escipub.com/american-journal-of-transportation-and-logistics/ 9
other regions in order to assess their global competitiveness.
REFERENCES
1. Al-Eraki, A.S., Mustafa, A. and Khader, A.T. (2010), An extended DEA window analysis: Middle East and East African seaports, Journal of Economic Studies, 37, 208-218.
2. Alam J.B., S.H. Sikder and K.G. Goulias, (2004), Role of transportation in regional economic efficiency in Bangladesh: A Data Envelopment Analysis. Transportation Research Record 1864, Journal of Transportation Research Board, USA. 3. Almawsheki, E.S. and Shah, M.Z. (2015),
Technical Efficiency Analysis of Container Terminals in the Middle Eastern Region, The Asian Journal of Shipping and Logistics, 31(4): 477-486
4. Banker, R.D., Charnes, A. and Cooper, W.W., (1984). Some Models for Estimating Technical and Scale Inefficiencies in Data Envelopment Analysis. Management Science, 30(9), 1078– 1092.
5. Charnes, A., Cooper, W. W., & Rhodes, E. (1978), Measuring the Efficiency Inefficiency of Decision Making Units, European journal of operational research, 2(6), 429-444.
6. Cook, W.D., E. Tone and J. Zhu (2014), Data Envelopment Analysis: Prior to Choosing a Model, Omega 44, 1-4.
7. Cullinane, K., Wang, T. F., Song, D. W., &Ji, P. (2006). The Technical Efficiency of Container ports: Comparing Data Envelopment Analysis and Stochastic Frontier Analysis, Transportation Journal of Operation Research Part A: Policy and Practice, 40(4), 354-3742, pp. 429 - 444.
8. Debreu, G. (1951) The Coefficient of Resource Utilization. Econometrica, 19, 273-292.
9. Demirel, B., Cullinane, K. and Haralambides, H. (2012), Container terminal efficiency and private sector participation, The Blackwell Companion to Maritime Economics, 571-598.
10. Ding, Z.Y., Jo, G.S., Wang, Y. and Yo, G.T. (2015) The relative efficiency of container terminals in small and medium sized ports in China, Asian Journal of Shipping and Logistics, 31, 231-251. 11. Farrell, M. J. (1957). The Measurement of
Productive Efficiency. Journal of the Royal Statistical Society, Series A (General), 120(3), 253-290.
12. Hatami-Marbini, A., A. Emrouznejad and M. Tavana (2011), A Taxonomy and Review of the Fuzzy Data Envelopment Analysis Literature: Two Decades in the Making, European Journal of Operational Research 214(3): 457-472
13. Hung, S.W., Lu, W.M. and Wang, T.P. (2010), Benchmarking the operating efficiency of Asian container ports, European Journal of Operational Research, 203, 706-713.
14. Jiang, B. and Li, J. (2009), DEA-based performance measurement of seaports in northeast Asia: Radial and non-radial approach, Asian Journal of Shipping and Logistics, 25, 219-236.
15. Kutin, N., nguyen, T.T, and Vallee, T. (2017), Relative Efficiency of ASEAN Container Ports based on Data Envelopment Analysis, Asian Journal of Shipping and Logistics, 33(2): 67-77. 16. Leon, T., Liern, V., Ruiz, J. and Sirvent, I. (2003)
A Possibilistic Programming Approach to the Assessment of Efficiency with DEA Models, Fuzzy Set and Systems, 139: 407-419.
17. Liu, C.C. (2008), Evaluating the operational efficiency of major ports in Asia Pacific region using data envelopment analysis, Applied Economics, 40, 1737-1743.
18. Medda, F. and Liu, Q. (2013) Determinants and Strategies for the Development of container terminal, Journal of Productivity Analysis, 40, 83-98.
19. Panayides, P/M., Maxoulis, C.N., Wang, T.F. and Ng, K.Y.A. ( 2009) A critical analysis of DEA application to seaport economic efficiency measurement, Transport Review, 29, 183-206. 20. R Core Team (2019), R: A language and
environment for statistical computing. R Foundation for Statistical Computing, Vienna, Austria. URL http://www.R-project.org/
21. Sarriera, J.M., Araya, G., Serebrisky, T., Briceno-Garmendia, C. and Schwartz, J. (2013), Benchmarking container port technical efficiency in Latin America and the Caribbean, Inter-American Development Bank.
22. Schoyen, H. and Odeck, J. (2013), The Technical efficiency of Norwagian container port: A comparison to some Nordic and UK container ports using data envelopment analysis (DEA), Maritime Economics and Logistics, 15, 197-221. 23. Wu, Y.C.J. and Goh, M. (2010), Container Port
Efficiency in Emerging and More Advanced Markets, Transportation Research Part E, 46:1030-1042.
24. Xu, Y. and Ishiguro, K. (2019), Measures of efficiency of Automated Container Terminals in China and Korea, Asian Transport Studies, Volume 5, Issue 4, pp 584-599.