Published online January 10, 2014 (http://www.sciencepublishinggroup.com/j/ajche) doi: 10.11648/j.ajche.20130104.12
Image analysis technique as a tool for extracting features
from the copper surface froth in the flotation process
Nasser Saghatoleslami
1, *, Hajir Karimi
21
Department of Chemical Engineering, Ferdowsi University of Mashhad, Mashhad, Iran
2
Department of Chemical Engineering, University of Yasuj, Yasuj, Iran
Email address:
[email protected] (N. Saghatoleslami), [email protected] (H. Karimi)
To cite this article:
Nasser Saghatoleslami, Hajir Karimi. Image Analysis Technique as a Tool for Extracting Features from the Copper Surface Froth in the Flotation Process. American Journal of Chemical Engineering. Vol. 1, No. 4, 2013, pp. 70-78. doi: 10.11648/j.ajche.20130104.12
Abstract:
The froth can be adopted as an indicator of the performance of flotation processes. The study of froth image structure would enable us to establish a number of parameters from which could convey the froth characteristics. To monitor the operating performance of the floatation cell by machine vision system, it is crucial to identify and extract those features that are descriptive of the surface froth. Consequently, it can provide interdependency between the froth characteristics with the operating conditions on one hand (e.g., aeration rate, froth depth, chemical compound and pH variation) and the cell parameters performance on the other hand, as well (e.g., copper grade, recovery and solid contents). The aim of the present study is to examine the copper froth characteristics, by adopting an image analysis technique and hence evaluating froth features such as the average bubble size, bubbles distribution, bubble shape features, bubble elongation factor, image average color and the color distribution. Owing to the intricacy aspect of the froth structure and in order to match properly between the real froth and the segmentation images, this algorithm adopts features similar to proper filters in the pre-processing stage, edge detection functions, threshold functions and different mathematical morphology models. The findings of this work reveal that the size and shape of the froth bubbles plays an important role in classifying the froth. Hence, it is possible to incorporate such features for either evaluating the flotation cell performance or adopting it for the automatic on-line control of the flotation process. The findings of this research could also be implemented towards the training of the operators.Keywords:
Image Analysis, Copper Grade, Flotation, Froth Color, Bubble Size, Bubble Distribution1. Introduction
In the flotation cell, the performance of the cell is highly dependent on the morphology of the surface froth. Consequently, to control the metallurgical performance of the cell (i.e., copper grade, concentrate recovery and mass flow rate), continuous observation of the froth features (i.e., texture and color froth) by an operator is crucial. To enhance the performance of the cell, the operator must respond according to the visual appearance of the froth. Complex texture of the froth and different operating parameter interactions, make this type of evaluation not an efficient means. In recent years, a number of achievements have been made in the field of machine vision system for enhancement of the performance of the floatation cell. Their objective were initially to achieve a replacement for the visual observation of the operator and finally to associate the froth texture characteristics with the cell performance. To adopt this system for controlling the floatation process, the analysis of the froth texture was of
10% solution gr/ton
10 - 90 Frothers (A653 + MIBC4 )
Valve opening % Aeration rate (AFR)
11.8 pH
0.9 Average feed froth grade
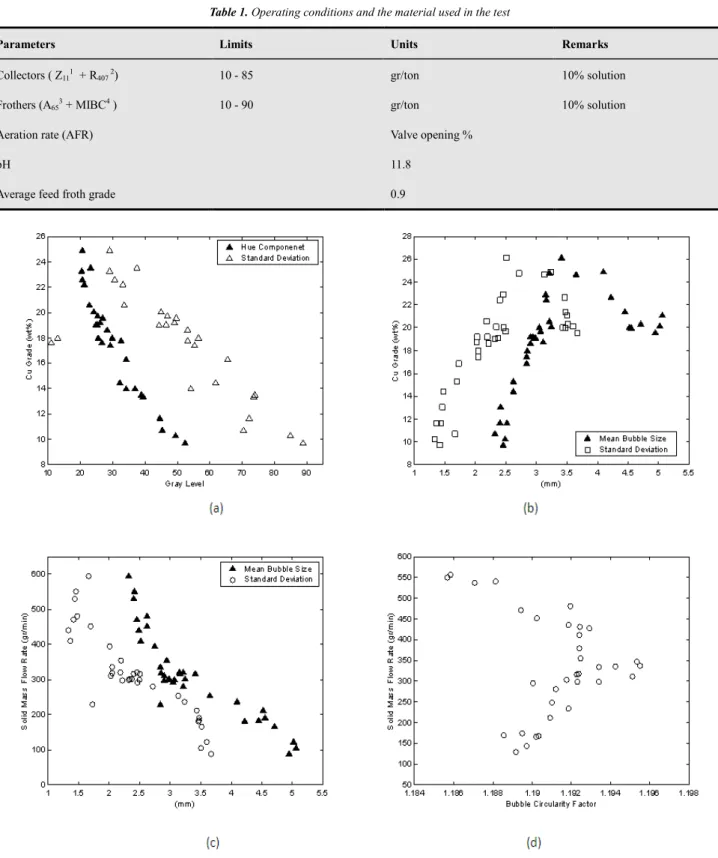
Figure 1. a) Relationship between the copper grade and H (hue) color component. b) Variation of copper grade with the surface froth bubble size. c) Variation of solid mass flow rates with the surface froth bubble size. d) Variation of solid mass flow rates with the degree of the sphericity of the froth bubble size
Figure 2. Network decision making BP algorithm with MLP structure adopted by Saghatoleslami et al., 2002 for modeling and characterization of flotation froth color and texture [1]
The application of machine learning techniques to exploit information from digital images of the froth phase of industrial flotation plants has been analyzed by Grouws and co-works [2]. They included both connectionist techniques to identify control decisions necessary to maintain optimal operation of the plant, as well as symbolic methods, such as induction techniques. Both approaches were utilized to classify froth structures based on statistical features derived from digitized images of the froth surfaces. They also found that back propagation algorithms perform significantly better than either non-incremental or incremental induction [2]. Pelletier and co-workers has also analyzed the froth by the use of the multivariate image analysis (MIA) method to extract the spectral variation contained in a RBG image. The partial least squares (PLS) method was applied to develop an empirical model for the prediction of froth grade. They also studied the feasibility of implementing a hybrid control strategy consisting in a froth structure supervision controller based on the froth concentrate grade estimated by MIA and recovery inferred by image analysis [3]. The robustness of ANN to interpret images with illumination perturbations, produced by light problems or dirt attached to the window of the video
camera was also evaluated. It was concluded that ANN are
reliable for learning and producing generalized predictions of the froth mean bubble diameter and bubble size distribution, when the model is trained using a database that contains information on the illumination intensity [3]. The selection of the proper frother, specifically for a given ore,
is essential in flotation. The evaluation of different frothers,
order to support the control decisions of plant operators, which would leads to significantly smoother control action and more stable plant operation than could be obtained with crisp sets of rules or manual control strategies [6].
2. Significance of the Froth
Characteristics in Flotation Process
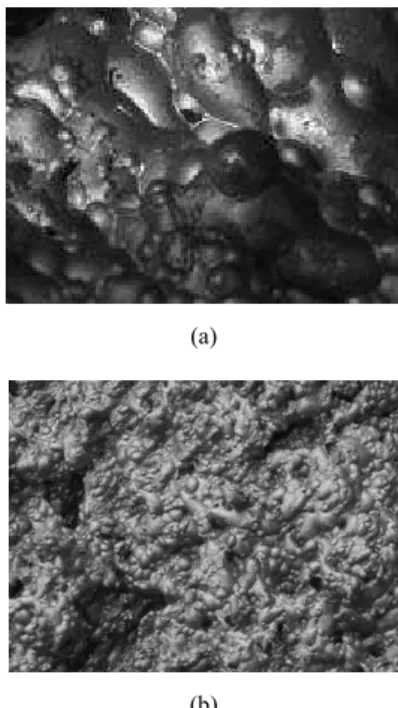
In the past, the relation between the froth characteristics and performance of the cell was not of the prime concern. These features are related to the froth texture and color. Only in recent years, characteristics of froth with the aid of image analysis have attracted the interest of some researchers [7-9]. The most significant parameters in the froth features are the average bubble size, bubble shape, froth color, froth stability and froth mobility. The research shows that the performance of flotation cell is highly dependent on bubble size in the pulp and there exist a relationship between the bubble size in the pulp and the froth phase [10]. Therefore, the bubble size and its distribution in the froth are of significance. The research also reveals that the froth structure can be classified according to the bubble shape and its distribution in different type of froth. Hence, the performance of the flotation process can be controlled in an effective manner. Furthermore, the distribution of bubble size is a powerful indicator of other parameters such as aeration rate, pH variation and the amount substance that attaches to the bubbles which are highly depends on the type of collector and frother [11]. In general, froth with small amount of water content has bubbles of polyhedral configuration. This type of textures has a high froth grade. Spherical types of bubbles are the indication of diluted froth of shallow depth and low froth grade. On the other hand, a bubble of an elliptical configuration signifies the stiffness of the froth and the direction of which the forces are acting along the flow. Figures 3 and 4 demonstrate the forth textures with bubbles of spherical, polyhedral and elliptical configurations.
(a)
(b)
Figure 3. Froth of a) shallow depth with spherical type of bubbles of low froth grade and b) high depth with bubbles of polyhedral configuration and of high froth grade
Research also reveals that the froth color (or light intensity) conveys information about the froth surface grade and there exist a close relation between the froth color and the inorganic compositions present in the concentrate [12]. In the copper flotation process, the high intensity of yellow color in the surface froth is an indication of the high concentration of calcopyrite and pyrite in the concentrate. On the other hand, the froth of darkish yellow color signifies the presence of calcosite in the concentrate. Furthermore, froth of whitish color can manifest that the concentration of the copper is low. Figure 4 shows a froth of different colors. Figure 5a demonstrates froth of high intensity and of a uniform color. On the other hand, Figure 5b represents froth of low intensity and of a non-uniform color. Therefore, it has a low solid contents and a low concentration of copper with a large amount of water.
(a)
(b)
(a)
(b)
Figure 5. Froth of a) high intensity, uniform in color and high froth grade and b) low intensity and non-uniform in color and low froth grade
Stability of the froth is an indication of the degree of the separation of inorganic compounds and selectivity of precious substances. On the other hand, the instability of the froth causes the bubbles to rupture, to loss solid contents and the re-emergence of the froth in the pulp phase. However, excessive stability causes the selectivity of precious substances to be reduced (i.e., a froth of low grade).
In flotation process, mobility and viscosity of froth are also of great concern. The inorganic hydrophobic contents of froth are also depends largely to the viscosity of the froth. Froth of high viscosity can delay the discharge of the hydrophobic substances and hence could have a negative effect on the performance of the process [13]. Froth bubbles of polyhedral and elliptical configurations have a high viscosity and low mobility. Therefore, these types of froth have higher froth grade and lower recovery.
3. Fundamental stages of Image
Processing
A typical image processing flowchart is shown in Figure 6. Fundamentally, image analysis method is divided into the following categories: processing of the primary surface (which includes the stored images and pre-processing), processing of the intermediate surface (which includes image segmentation) and recognition and extraction of the essential features from the original image. Processing of the above surface includes the classification and description of the image features. Pictures can be taken from the froth phase by a handy cam. Installation of a frame grabber on the computer could transform an analog signal to digital one. Furthermore, image analyses and processing could also be carried out on the same computer.
Figure 6. Schematic flow diagram of an image processing system
4. Froth Image Analysis Technique
The fundamental stages of an image analyses method includes: image pre-processing, image segmentation which incorporates edge detection, specification of the features in the picture and finally evaluation of the geometrical features.
4.1. Image Pre-Processing
In this stage, a specified zone of the picture ought to be selected (i.e., region of interest or in brief ROI). This region should have a rectangular configuration that contains the main image and where the algorithm should be carried out. The main pictures are colored and recorded as 680×480 cm or 1152×840 cm frame. In general, pictures of 640×480 cm are employed and prepared for the analysis. The main aim of this work was to reduce the picture noise, to uniformly distribute light intensity on the bubble surface, to prevent the breaks up of a bubble to more than one and to have more clarity at the bubble edges. To obtain these objectives, smoothing-averaging filters, smoothing low-pass and Gaussian function were adopted. Most filters are mathematical functions in which alter the intensity of a grey pixel in accordance with the intensity of neighboring pixels. In these types of filters, the magnitude for each pixel are computed and corrected with respect to the magnitudes of the neighboring pixels and as a result, a coefficient was allocated for the kernel filter. If the magnitude or coefficients which was allocated for the kernel varies, the performance of the filter on the allocated value to the central pixel will also alters. In general, the coefficients which were defined on the kernel would demonstrate the contribution of neighboring pixels on the allocated value for the central pixel. The size of each kernel is an indication that how many of the neighboring pixels can effect and alter the allocated value to the central pixel. Figure 7 demonstrates a typical performance of this category of filters which also incorporates a kernel of the size 3×3 that
Central pixel
Neighbors
Figure 7. Filtering mechanism 4.2. Bubbles Boundaries Considerations
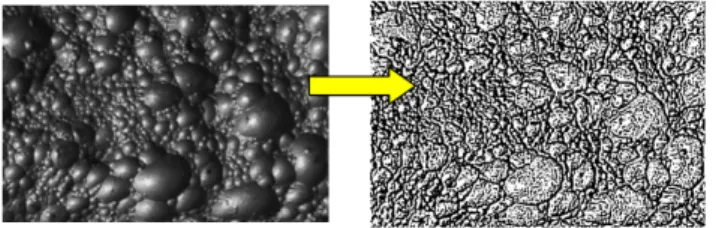
Establishing bubble boundaries in an image is one of the most important and also complex stages in an image analysis practice. This is due to the complex nature of froth texture and the uneven reflection of the light on the bubble surface. Following the pre-processing of the main image, the edge detection stage has to be carried out. This is achieved by adopting Laplacian edge detection function. Figure 8 illustrate the effect of this function on the image after being processed.
Figure 8. The effect of edge detection function on the froth image
This function is a filter of linear type with a high pass category. This type of filter attempts to extract out the bubble boundary (with respect to the light intensity gradient between the bubble edge boundary and bubble itself) and hence to brighten up the image. Laplacian filter employs an operator of a second order differential. In general, they utilize kernels of different resolutions (e.g., 3×3, 5×5 or 7×7) with different elements. A typical kernel of resolution 3×3 is shown in Figure 9, where a, b, c and d are integer numbers.
a
d
c
b
x
b
c
d
a
Figure 9. A typical kernel of resolution 3×3
Depending on whether the central pixel x is equal or greater than absolute value of the square of the neighboring pixels coefficient, filter would have two different effects. In the first case, filters causes pixel recovery of those in which possesses more light intensity variations. These type variations can be originated due to the sharp edges, boundaries between the bubbles and the noises. In the
one could obtain an enhanced results.
4.3. Froth Feature Identification and Evaluation
Froth feature is a part of an image that can be identified in it and then be counted or measured. In a froth image, each bubble is considered as a feature. Feature identification stands for identification of certain features in an image. By adopting proper thresholing function, one could divide an image into two parts: one is the feature zone and the other the distinction zone. To isolate the image features, one can adopt a thresholing function. In general, thresholing function is employed following the utilization of edge function. This procedure enables features to be identified from the background and to enhance the performance. The function which is employed is called metric thresholing function. In contrast to manual method, the use of automatic thresholing function does not require the adjustment of maximum or minimum of the thresholing function. As shown in Figure 10, an automatic algorithm method utilizes image histogram for the assessment of the threshold value. In this function, the value for the threshold is called k, and from that, the following correlation could be minimized:
Class 1
Class 0
Gray Level Value
k h(i)
i
Figure 10. A histogram picture
( ) (
1)
1( ) (
2)
0 1
i k i N
i i k
h i i
µ
h i
i
µ
= = −
= = +
−
=
−
∑
∑
(1)In this equation,
µ
1 is the average light intensity on allpixels in the range of 0 to k and
µ
2 the average value ofall pixels in the range of k+1 to 255. Furthermore,
h
( )
i
is the number of pixels having the intensity of i and k designates the value of the gray level which have been allocated from the threshold function.
4.4. Binary Morphology
stages are impossible. Furthermore, owing to the dissimilar effects of previous algorithms on the image structure, undesired features such as noises, dendrites and contact of bubbles on the image edge would be generated. Morphological functions could have an immense significance on the reduction or elimination of these undesired features on the image and hence modifying the images and the size of bubbles. The process of binary morphology can include the elementary process of pixel erosion and dilation or a combination of an advanced process. These functions could be manipulated and executed with the aid of structuring elements on the image and bubble edges which are allocated for these filters. By modifying the size of structuring matrices and allocation of appropriate values to the structuring elements of these matrices, the configurations of the bubbles and the way in which they could be separated might be manipulated and modified. In each of the structuring elements, three parameters are described which could identify how a pixel in the operation of morphology is processed. These parameters are: the size of the structuring elements of the matrices, the magnitude of these matrices and the way in which the neighboring pixels to the central one have been processed are selected. A typical of this is a 3×3 matrices of magnitude one. Due to the light intensity of these pixels, the selection of the structure for the neighboring pixels has an immense effect on the performance of the functions on the central one. The performance of a 3×3 matrices on the image (by considering the type of structures) are shown in Figure 11. In some of these functions, it is also required that the parameter of connectivity to be considered. The selection of this item could help the operator to identify a certain number of the neighboring pixels and be classified as a single image. In Figure 12, the performance of this function on the image processing is illustrated.
3 p 2 p 1 p 5 p 0 p 4 p 8 p 7 p 6 p 0 1 0 1 1 1 0 1 0
× p0′=T(p0,p2,p4,p5,p7) S tru ctur ing
E lem en t Im ag e
2 p 1 p 4 p 0 p 3 p 6 p 5 p 0 1 0 1 1 1 0 1 0
× p0′=T(p0,p2,p3,p4,p6) Im ag e
Stru ctu rin g E lem en t
Sq u are Pix el Fr am e
H ex ag on al Pix el Fr ame (a)
( b)
Figure 11. The operation of transforming the function with the help of structuring elements and the structure that have been chosen for the image for a) square and b) hexagonal elements
(a)
(b)
Figure 12. The effect of a) elementary and b) advanced morphology functions on the image processing
4.5. Determination of Geometric Parameters for Bubbles
The most important parameters that extracted from the bubble image geometry are: the number of bubbles in the specified zone, the average bubble size (i.e., equivalent diameter), the distribution of the bubble sizes (i.e., the standard deviation the bubble sizes), circularity factor, bubbles elongation (i.e., equivalent ellipse diameter) and the orientation of bubbles with respect to the cell edge. Table 2 illustrates the geometric parameters of typical image froth.
Table 2. List of parameters and their values according to a typical image
Equivalent
diameter 2.915 mm
Circularity
factor 1.191
Ellipse
major axis 4.552 mm
STDEV of the bubble sizes 2.239 mm Mean Hue color component 29.008 STDEV bubble colors 21.198
4.6. Color Analysis
features of HSL coordinate have caused it to be chosen for the majority of image processing applications.
In the pixels color environment, H, S and L are features that distinguish one color from another. Hue coordinate corresponds to wavelength range for a color, therefore it signifies a color. The S component signifies the relative saturation of a color. A color other than white has one hundred percent saturation. L component signifies the rate of luminance of the image. The color of an image depends on the combination of H component and degree of its impurity. The relation between these two signifies the degree of the brightness of the color.
In analyzing the colors, initially the histogram of image must be constructed in HSL coordinates. In these graphs, the values of color pixel element are plotted against the available pixels in the image. With the help of these graphs, statistical facts about the colors as a set of pixels could be extracted (as demonstrated in Table 2). Therefore, the utilization of color analysis could be employed as simple technique in different flotation processes and consequently for the evaluation of different ores in the froth.
5. Conclusions
In this research different type of filters, edge functions, thresholding functions and mathematical morphology have been employed for a series of images. Furthermore, the proper algorithm for these cases was evaluated. It was also attempted to utilize the proper functions in each stage. Furthermore, by considering the froth texture, the proper type of filters for the elementary and final image processing stages has been employed. The findings of this work reveal that by applying an appropriate filter on the image in the elementary processing stages, a better outcome for the edge detection stages could be resulted.
On the other hands, thresholding functions are very sensitive. Hence, by scrutinizing the performance of the previous stages, one could establish and implement a proper function. The selection and hence computation of the upper and lower value for threshold limit could be carried out by hand. However, this is not feasible on the continuous image processing stages. Therefore, for the preceding case, it is recommended to adopt automatic threshold functions. Generally speaking, morphology functions could be employed for the following cases: improving pictures and bubble edges, separation of coalesced bubbles, filtering noises and unnecessary features of the images. In all stages of image processing, the froth texture could appreciably affect the employments of the appropriate kernels in filters, the structuring elements and the type of pixels connectivity in morphology functions.
quantitatively and qualitatively. Hence, from the above relation, the operating conditions and the performance of the cell could be studied. The findings of this research could also be implemented towards the training of the operators.
Acknowledgements
We gratefully acknowledge the support of the department of research and development of Sarcheshmeh Copper Plant for this research and Dr. Rahimi, Dr. Shirazi and Dr. Amiri for their cooperation and helpful suggestions.
Nomenclature
BP Back propagation
( )
i
h
Number of pixels having the intensity of iHIS Hue, saturation and intensity
HSL Hue, saturation and luminance
HSV Hue, saturation and variety
k Value of the gray level
MLP Multilayer perceptron
Total data input to jth neuron from the lth layer
RGB Red, green and blue
ROI Region of interest
SSE Sum of square errors
Vector related to connection weights of neurons in
the ith layer
Greek Letters
1
µ
Average light intensity on all pixels in the range of 0 to k2
µ
Average value of all pixels in the range of k+1 to 255 Error ratio of to jth neuron from the lth layerReferences
[1] N. Saghatoleslami, H. Karimi, R. Rahimi and H.H.A. Shirazi, “Modeling of Texture and Color Froth Characteristics for Evaluation of Flotation Performance in Sarcheshmeh Copper Plant, Using Image Analysis and Neural Networks,” Int. J. of Engineering, pp. 1-10, 2002.
[3] P. Pelletier, J. Tessier and C. Duchesne, “Application of Numerical Image Analysis to Process Diagnosis and Physical Parameter Measurement in Mineral Processes Part I: Flotation Control Based on Froth Textural Characteristics,” Centenary of Flotation Symposium, p. 12, 2005.
[4] S.R. Grano, “Selecting Frothers for the Flotation of Specific Ores by Means of Batch Scale Foaming Tests,” Metallurgical Plant Design and Operating Strategies , AUSIMM, 2006.
[5] R.H. Estrada-Ruiz, “Neural Networks to Estimate Bubble Diameter and Bubble Size Distribution of Flotation Froth Surfaces - Synopsis” The Journal of The Southern African Institute of Mining and Metallurgy, vol. 9, p. 9, 2009.
[6] C. Aldrich,“Development of Fuzzy Rule-Based Systems for Industrial Flotation Plants by Use of Inductive Techniques and Genetic Algorithms
,”
JSAIMM, p. 6, 2009.[7] E.T. Woodburn, J.B. Stockton and D.J. Robbins,” Vision-Based Characterization of Three Phase Froths,” International Colloquium Developments in Froth Flotation, vol. 1, pp. 1-30, 1989.
[8] G. Bonifazi, P. Massascci, A. Meloni, “3D Froth Modeling by Image Analysis,” Proc. XXI Int. Min. Proc. Cong., B8a-178-B8a-189, 2001.
[9] H.H.A. Shirazi, “Application of froth image analysis in mineral industry,” PhD Thesis, 1997.
[10] V.A. Glembotski, “Flotation Primary Sources,” New York, 1972.
[11] D.W. Moolman, J.J. Ekesteen, C. Aldrich and J.S.J. van Deventer, “The Significance of Flotation Froth Appearance for Machine Vision Control,” Int. J. Miner. Process, vol. 48, pp. 135-158,1996.
[12] J.M. Hargrave, N.J. Miles and S.T. Hall, “The Use of Gray Level Measurement in Predicting Coal Flotation Performance,” Mineral Eng., vol. 9,pp. 667-674,1996.
![Figure 2. Network decision making BP algorithm with MLP structure adopted by Saghatoleslami et al., 2002 for modeling and characterization of flotation froth color and texture [1]](https://thumb-us.123doks.com/thumbv2/123dok_us/8027776.2126080/3.892.294.642.119.662/network-decision-algorithm-structure-saghatoleslami-modeling-characterization-flotation.webp)