Published online May 30, 2014 (http://www.sciencepublishinggroup.com/j/ajche) doi: 10.11648/j.ajche.20140202.11
Determination effects of process parameters on CO
2
reactive absorption system by mathematical modeling
Adeyinka Sikiru Yusuff, Charles Uliukhifo Omohimoria, Kayode Augustine Idowu
Department of Chemical & Petroleum Engineering, Afe Babalola University, Km 8.5 AfeBabalola Way Ado-Ekiti,Ekiti State, Nigeria
Email address:
[email protected] (A. S. Yusuff), [email protected] (C. U. Omohimoria), [email protected] (K. A. Idowu)
To cite this article:
Adeyinka Sikiru Yusuff, Charles Uliukhifo Omohimoria, Kayode Augustine Idowu. Determination Effects of Process Parameters on CO2 Reactive absorption System by Mathematical Modeling. American Journal of Chemical Engineering. Vol. 2, No. 2, 2014, pp. 8-13. doi: 10.11648/j.ajche.20140202.11
Abstract:
A steady state model for CO2- reactive absorption system was developed based on principle of mass transferand chemical reaction. The pseudo-first order model is assumed and reversibility of chemical reaction was also neglected.
The continuity model equation in term of material balance with chemical reaction across an elemental stage K on CO2 was
developed. The model consists of system of linear simultaneous equations, and the equations representing the composition
of CO2 in both liquid and gas phases were solved. The simulation studies were performed to investigate the effect of
changing various process variables such as number of plate, gas flow rate, and CO2 composition in the feed vapor.
Keywords:
Carbon dioxide, Reactive Absorption Column, Process Variables, Modeling1. Introduction
Carbon dioxide has been identified as one of the major causes of greenhouse effect which results to global warming. It is produced in significant amount from various industrial processes, including fossil fuel firing electric power generation, steel production, chemical and petrochemical manufacturing, coal gasification, etc. As a
mean of mitigating the global warming, removal of CO2
from industrial flue gas is considered important (Park et al,
2004). The method of removing CO2 gas mixture include
absorption (physical or chemical), cryogenic separation, membrane separation, adsorption and so on. Among these
methods, CO2 absorption by amine aqueous solution has
been considered as the most efficient way and various research activities were conducted by this method and most
commercial processes for the bulk removal of CO2 from
gaseous streams involved the use of amines (Mimura et al,
1998; Sartori et al, 1983; Paiton et al, 1996).
Methyldiethanolamine (MDEA) is a tertiary amine used
extensively as solvent for removing CO2 and H2S from
process gases [Astarita et al, 1983]. The addition of a
primary or secondary amine to a tertiary amine has found widespread application in the absorption and removal of carbon dioxide from process gases. The success of these solvents is due to the high rate of reaction of primary or
secondary amine with CO2 combined with the low heat of
reaction of tertiary amine (Bishnoi et al, 2000). The
equilibrium solubility of CO2 in aqueous MDEA solutions
has been experimentally studied by several researchers (Jou, Mather & Otto, 1982, 1984; Jou, Caroll, Mather & Otto, 1993; Bhair, 1984; Ho and Eguren, 1988; Austgen, Rochelle & Chen, 1991).
Many researchers had also recognized the importance of using a fundamental rate-based approach for modeling the heat and mass transfer processes present in separation
systems (Pacheco et al, 1998; Darton 1992).
Tomcej et al, [1987] implemented an efficiency model
based on the solution of the differential mass balance on a tray of a given contactor. In the application to the removal
of CO2 using alkanolamines were made to estimate the
enhancement factor.
2. Mathematical Model
In order to develop a model able to represent chemical absorption of carbon dioxide in process gases, the following assumptions are made:
(1) Gas and liquid flow rates in each of the plate are equal
i.e.
1 = 2= − − − − − − − − N = F
G G G G
1= 2 = − − − − − − − − − N = F
L L L L
(2) Every stage is in equilibrium stage or perfect stage.i.e.
=
k k
y Mx ∀k.
(3) The absorption process is assumed to be steady state
and counter-current.
(4) There is negligible heat effect in the column, thus the
column operates with constant temperature.
(5) Liquid holdup is uniform throughout the column.
(6) The absorbent is of dilute concentration.
(7) A pseudo-first order model is assumed and the
reversibility of the chemical reaction is neglected
(Tomcej et al, 1987).
2.1. Kinetics of Reaction
In the absorption process model, the stoichiometry
equation of reaction between trace component (CO2) and
absorbent [Aqueous amine (MDEA)] is written as:
1 2
2 2 3
+ −
→
+ + ←k +
k
CO H O MDEA MDEAH HCO (1)
The rate of reaction of CO2 with MDEA is represented as:
2
1 2 + −
= −
MDEA CO MDEA MDEAH HCO
R k C C k C C (2)
3 9
1( . )=2.576 10 exp( 6027− )
k m kmol s x T (Pacheco et al,
1998) (3)
2.2. The Material Balance
Considering an elemental volume K in a reactive absorption column
The mathematical model is based on the continuity equation:
Rate of material in – Rate of material out + Rate of material generated by reaction + Rate of Accumulation
Subject to those aforementioned assumptions and continuity equation
Material balance across the K on CO2 stage,
1 1 1 1
k k k k k k k k R k L
L
−x
−+
G
+y
+=
L x
+
G y
+
K x h
(4)All the terms are expressed in kmol/CO2 per hour.
The liquid holdup per tray (hL) is approximated by using
correlation found by Miyahara and Takahashi (1979 & 1992).
2
0.75 0.35
4 1.2 5 0.66 1.2 1 0.8 0.16
1.53 10 1.42 10 4.11 10
−
− − − −
= + +
G
L
L p p a r
H O p
z
h x d x d x C M F
d
µ
ε
µ
(5)Every stage is an equilibrium stage or perfect stage
k k
y
=
mx
∀
k
(6)Put equation (6) into equation (4), we obtained
1 ( ) 1 0
+ − + + + − =
F k F F R L k F k
mG x L mG k h x L x (7)
Equation (7) above can be written as follows:
1 1
0
k k k
x
x
γ
++
β
+
α
−=
(8)Where:
F
mG
γ
=
(9)(
L
FmG
Fk h
R L)
β
= −
+
+
(10)F
L
α
=
(11)Equation (8) is a second order linear, constant coefficient difference equation. Since it is second order, two boundary conditions are required for a specific solution. Here they are:
0 F
x
=
x
(12)1 1 1
F
N N F N
y
y
mx
y
x
m
Equation (8) has an analytical solution; however, it can be expanded as follows:
1:
k
=
γ
x
2+
β
x
1+
α
x
F=
0
(14)3 2 1
2 :
0
k
=
γ
x
+
β
x
+
α
x
=
(15)4 3 2
3 :
0
k
=
γ
x
+
β
x
+
α
x
=
(16)1 2
1:
N N N0
k
= −
N
γ
x
+
β
x
−+
α
x
−=
(17)1 1
:
N N N0
k
=
N
γ
x
++
β
x
+
α
x
−=
(18)This is the system of linear equations;
Ax
=
b
(19)In the n-unknowns
x
whereThis is N N* tri-diagonal matrix.
Computing the degree of absorption
η
a attainable by thecolumn, mathematical expression written below is employed:
0
FEED EXITa
FEED
y
y
y
η
−≤
≜
≤
1
(20)3. Method of Numerical Solution
The method adopted for the solution of system of linear simultaneous equations, which resulted to tri-diagonal matrix for the model of chemical absorption of carbon
dioxide (CO2) in methyldiethanolamine solution is the
Gaussian elimination method. A mathematical algorithm to solve these systems of linear simultaneous equations was developed and implemented into program using Microsoft Excel. The parameters reported by Pacheco et al; 1998, Muhammad et al; 2008 and literature were used for simulation in this study, which are given below.
3.1. CO2- Reactive Absorption System
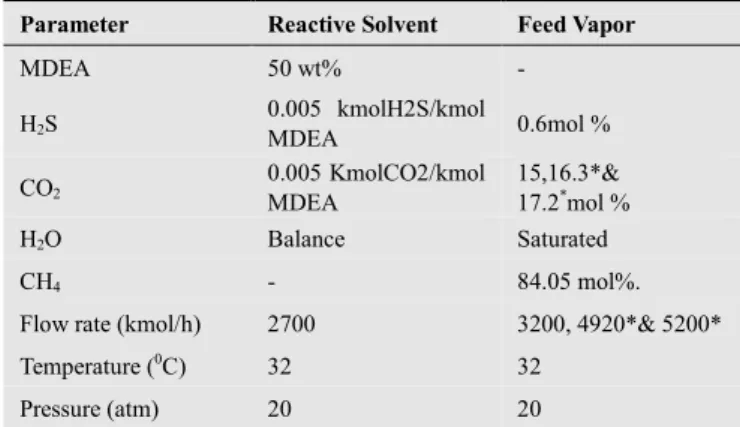
The used parameters in simulating the developed model are summarized in Tab 1, 2 & 3.
Table 1: Used parameters in simulation of CO2-Reactive Absorption
System.
Parameter Reactive Solvent Feed Vapor
MDEA 50 wt% -
H2S
0.005 kmolH2S/kmol
MDEA 0.6mol %
CO2
0.005 KmolCO2/kmol MDEA
15,16.3*& 17.2*mol %
H2O Balance Saturated
CH4 - 84.05 mol%.
Flow rate (kmol/h) 2700 3200, 4920*& 5200* Temperature (0C) 32 32
Pressure (atm) 20 20
Source: Pacheco et al, 1998.
Table 2: Characteristics of the Packed Column
Characteristics Corresponding Parameter
Column diameter (d) 1.68m Column height (h) and Parking height (z)
8.0m and 0.533/segment respectively
Number of Plate (N) 4*, 5* & 6
Type of contactor Pall rings, 0.0381m (dp)
Surface Tension of packing (dyne/cm) 75.0 Void fraction (
ε
) of the packing 0.95Source: Pacheco et al, 1998.
Table 3: Physical properties of the MDEA and Feed Vapor
Property MDEA (Absorbent) Feed Vapor
Density (ρ ) (kg/m3) 1041 0.4246 Dynamic Viscosity(µ )
(mPa.s) 6.14 -
Surface Tension (η )
(mN/m) 47.56 0.03689
Molecular Mass (M) 119.16 20.315 Superficial Velocity (u)
(m/s) 0.387 1.1*
4. Simulation Results and Discussion
Reactive absorption of CO2 in an absorption column was
studied and a model equation which described the mass transfer and chemical reaction processes in the column was developed based on continuity equation.
In the modeling process, various assumptions had to be made in order to simplify the model equation. A pseudo-first order model was assumed and the reversibility of the chemical reaction was as well neglected. A material balance equation was obtained which result into system of linear equations, which describe the concentration (mole fraction)
of CO2 in both gas and liquid phases.
The first step taken in the solution of these systemsof
linear equation was the determination of the initial and boundary conditions of the system. The final equations obtained were then solved using Excel software. The results of the analytical solution of the model are presented in Tables 4 to 8.
Since no experimental studies were carried out, the input data used for the model simulation were obtained from
Pacheco et al, (1998); Muhammad et al, (2008) work and
literature, however few parameters were assumed and changed to suit the purpose of this work. The simulation of
the model gives concentrations (mole fractions) of CO2 in
liquid phase and corresponding mole fractions of CO2 in
gas phase were determined for different operating conditions. The degree of adsorption was also obtained using equation (20).
Table 4: Compositions of CO2 in Liquid and Gas Phases at
3200
= F
G kmol hr LF=2700kmol hr,yF =15mol%,m=1.215 and
4 =
N
Composition of CO2 in Liquid
phase (x)
Composition of CO2 in Gas
Phase (y)
5.52 * 10-5
1.11 * 10-6
3.12 * 10-5
1.96 * 10-3
6.70 *10-5
1.34 * 10-6
3.79 * 10-5
2.38 * 10-3
Table 5: Composition of CO2 in Liquid and Gas Phase at 3200
=
F
G kmol hr LF =2700kmol hr,yF =15mol%,
1.215
=
m
andN
=
5
Composition of CO2 in Liquid
Phase (x)
Composition of CO2 in Gas
Phase (y)
5.52 * 10-5
6.17 * 10-7
5.02 * 10-7
3.12 * 10-5
1.96 * 10-3
6.71 * 10-5
7.50 *10-7
6.10 *10-7
3.80 * 10-5
2.38 *10-3
Table 6: Composition of CO2 in Liquid and Gas Phases at 3200
=
F
G kmol hr
,
2700 =
F
L kmol hr
, 15 % = F y mol ,
1.215
=
m
andN
=
6
.Composition of CO2 in Liquid
Phase (x)
Composition of CO2 in Gas
Phase (y)
5.52 * 10-5
6.09 * 10-7
1.46 * 10-8
4.95 * 10-7
3.12 * 10-5
1.96 * 10-3
6.70 *10-5
7.40 * 10-7
1.77 * 10-8
6.02 * 10-7
3.79 * 10-5
2.38 * 10-3
4.1. Effect of Number of Plate on the Absorption Process
Table 4, 5 and 6 show the effect of number of plate on
reactive absorption of CO2 at constant gas flow rate, liquid
flow rate, CO2 concentration (mole fraction) in feed vapor
and equilibrium slope. Three different numbers of plates (N), which are 4, 5 and 6, were considered, it was observed
that the concentration of CO2 in the exit gas stream was
constant. The degree of absorption was then determined using equation 20 and was obtained to be 98.4%. This phenomenon is due to the fact that gas and liquid flow rate are large, which result in a low value of x (mole fraction of
CO2 in liquid phase) for the liquid leaving at the bottom.
Table 7: Composition of CO2 in Liquid and Gas Phases at
4920
=
F
G kmol hr
,
2700 =
F
L kmol hr
, 16.3 % = F y mol ,
1.215
=
m
andN
=
5
Composition of CO2 in Liquid
Phase (x)
Composition of CO2 in Gas
Phase (y) 5.47*10-5 6.45*10-7 1.91*10-6 7.87*10-5 3.25*10-3 6.65*10-5 7.84*10-7 2.32*10-6 9.56*10-5 3.95*10-3
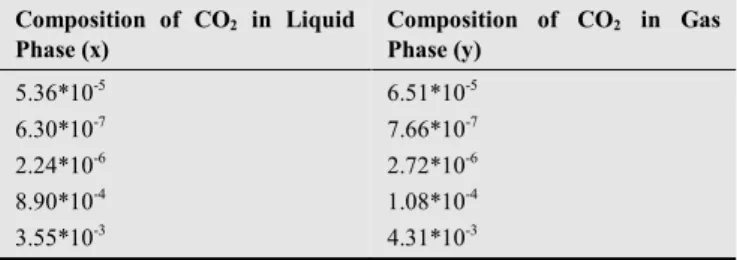
Table 8: Composition of CO2 in Liquid and Gas Phases at 5200
=
F
G kmol hr , =2700
F
L kmol hr , =17.2 %
F
y mol ,
1.215
=
m
andN
=
5
Composition of CO2 in Liquid
Phase (x)
Composition of CO2 in Gas
Phase (y) 5.36*10-5 6.30*10-7 2.24*10-6 8.90*10-4 3.55*10-3 6.51*10-5 7.66*10-7 2.72*10-6 1.08*10-4 4.31*10-3
4.2. Effect of Gas Flow Rate and Mole Fraction of CO2
on Absorption Process
Tables 5, 7 and 8 show the effect of gas flow rate and
mole fraction of the trace component (CO2) on absorption
values of inlet mole fraction of CO2 (15, 16.3 and 17.2
mol%) respectively holding other parameters constant, the degree of absorption decreases. When 3200kmol/hr of gas flow rate and mole fraction of 15mol% were considered, the degree of absorption was obtained to be 98.4%, at 4920kmol/hr and 16.3mol%, it was 97.8% and also, it was 97.5% at gas flow rate and mole fraction of 5200kmol/hr and 17.2mol% respectively. This phenomenon was due to the fact that liquid flow rate remained unchanged when gas
flow rate and mole fraction of trace component (CO2)
increased. This problem could be solved to some extent by increasing the liquid flow rate or recirculating the liquid over the tower.
5. Conclusion
In this present study, a mathematical model able to represent both mass transfer and chemical reaction processes at a given operating conditions for the reactive
absorption of CO2 in an absorption tower was developed
and solved analytically by Matrix method via Excel. Parametric study carried out on the model shown that the
concentration of CO2 in the exit gas stream was constant
using different numbers of plate; this was due to large values of gas and liquid flow rates, which result in a low
value of mole fraction of CO2 in liquid phase. Also, the
degree of absorption decreases as gas flow rate and trace
component’s composition increases holding other
parameters constant.
Notation
G gas flow rate, kmol/hr.
L liquid flow rate, kmol/hr
y mole fraction (composition) of CO2 in gas phase.
x mole fraction (composition) of CO2 in liquid
phase.
RMDEA rate of reaction of methyldiethanolamine, mol/m
3
s
C concentration of specie, mol/m3
T temperature, K
hL liquid hold up per tray, kmol.m3/m3
m equilibrium slope
N number of plate
d column diameter, m
h column height, m
P pressure, atm
z parking height, m
4
3
= L
L L
g
M
µ
ρ σ
, Morton number of liquid= L L
a L U
C µ
σ , Capillary number of liquid
2
= G
RG U F
gd , Froude number of gas
L
U
superficial velocity of liquid, m/sG
U
superficial velocity of gas, m/sg acceleration due to gravity, m/s2
Greek Letter
ε
void fraction of the parkingρ
density, kg/m3µ
viscosity, Ns/m2η
surface tension, mN/ma
η
degree of AbsorptionF
L
α
=
liquid flow rate, kmol/hr.(
L
FmG
Fk h
R L)
β
= −
+
+
, kmol/hr.F
G
γ
=
, gas flow rate, kmol/hr.Subscript
a absorption
F feed
N number of plate
G gas
L liquid
K stage
P parking
R reaction
0 initial values
Superscript
*(Asterisk) assumed Value
References
[1] Astarita, G., Savage, D.W., Bisio, A. (1983). Gas Treating with Chemical Solvents; John Wiley & Sons: New York. [2] Austgen, D.M., Rochelle, G.T., &Chen, C.C (1991). A
Model of Vapor-Liquid Equilibrium for Aqueous Acid gas- alkanolamine Systems. Industrial and Engineering Chemistry Research, 30, 543-555.
[3] Bhan, A. (1984). Experimental equilibrium between acid gases and ethanolamine solutions. Ph.D dissertation, Oklahoma State University.
[4] Darton, R.C. (1992). Distillation and Absorption Technology: Current Market and New Developments, Trans. Inst. Chem. Eng., 70 (Part A), 435.
[5] Ho, B., and Eguren, R. (1988). Solubility of Acidic Gases in Aqueous DEA and MDEA solutions. Presented at the 1988 AICHE Spring National Meeting, March 6-10.
[6] Jou, F.Y, Caroll, J.J., Mather, A.E., & Otto, F.D (1993). The solubility of Carbon dioxide and Hydrogen Sulphide in a 35 wt% Aqueous Solution of Methyldiethanolamine. The Canadian Journal of Chemical Engr, 71, 264-268.
[8] Jou, F.Y, Mather, A.E &Otto, F.D (1984). Vapor-Liquid Equilibrium of Carbon dioxide in Aqueous Mixture of Monoethanolamine and Methyldiethanolamine. Industrial Engineering Chemistry and Engineering Data, 29, 309. [9] Mimura T., Suda T., Iwaki I., Honda A., Kmazawa. H (1998).
Chemical Engineering Comm. 170, 245-260.
[10] Miyahara T., Ogawa, K., Hirade, A., Takahashi, T. (1992). Fluid Dynamics in Low Height Packed Columns Having Large Fractional Void Space. Chemical Engineering Science, 47 (13/14), 3323-3330.
[11] Muhammad, A., Abdul Mutalib M.I., Wilfred C.D, Murugesan T., and Shafeeq, A (2008). Viscosity, Refractive Index, Surface Tension and Thermal Decomposition of Aqueous N-methyl diethanolamine solutions from (298.15 to 338.15) K. Journal of Chemical Engineering Data, 53, 2226-2229.
[12] Pacheco, M.A and Rochelle G.T. (1998). Rate- Based Modeling of Reactive Absorption of CO2 and H2S into Aqueous Methyldiethanolamine. Industrial and Engineering Chemistry Research, 37, 4107-4117.
[13] Pacheco, M.A., Kagainoi, S. and Rochelle, G.T. (2000). CO2 Absorption into Aqueous mixtures of Diglycolamine and Methyl-diethaolamine, Chemical Engineering Sciences, 55(21), 4789-4825.
[14] Sanjay B, and Rochelle G.T (2000). Absorption of carbon dioxide into aqueous piperazine: Reaction Kinetics, Mass Transfer and Solubility. Chemical Engineering Science, 55, 5531- 5543.
[15] Sartori G., Savage D.W. (1983). Ind. Eng. Chem. Fundam., 22, 239-249.
[16] Sung Y.P, Byoung M.M., Jong S.L& Sung C.N (2004). Absorption Characteristic of Continuous CO2 Absorption Process. Prepr. Pap-Am. Chem. Soc., Div. Fuel Chem, 49(1), 249-250.
[17] Takahashi, T., Akagi, Y., Ueyema, K., (1979). A New Correlation for Pressure Drop in Packed Columns. Journal of Chemical Engineering of Japan, 12(5), 341-346.