DETERMINATION OF THE EFFECT OF TEMPERATURE CHANGES ON POWER OUTPUT OF SOLAR
PANEL
Ilo Frederick .U
Department of Electrical and Electronic Engineering, Faculty of Engineering
Enugu State University of Science and Technology (ESUT)
ABSTRACT
It is importance to state that the main limit of photovoltaic power output systems is low conversion
efficiency of photovoltaic panels, which is strongly influenced by their operating temperature.
Negligence in considering the photovoltaic panel temperature increases the financial risk of system
installation. This present study investigates the effects of operating temperature on solar panel
power output at Enugu State Nigeria. Experimental approach was adopted in the implementation of
the work. Solar panel was positioned outside the Department of Electrical/Electronic Engineering
workshop where it will not experience any obstacle from solar radiation intensity. The changes in
power output of the solar panel with respect to temperature was measured and recorded. The
results show that the power output of the solar panel varies as temperature changes.
KEYWORDS: Photovoltaic, temperature, renewable, Sunlight, Depletion-region
1. INTRODUCTION
It is very common in the recent days that people are now seeking for renewable energy in order to
replace the current fossil fuels. This is due to the extinction of fossil fuel in the beneath surface of the
earth and people cannot depend on it forever. One of the most potential renewable energy found is
solar energy (Henry S, 2014). Solar energy is the radiant heat and light from the sun that has been
used by humans since ancient times using a wide range of technologies. One of the wide applications
of solar energy is photovoltaic (PV). PV is the field of technology and research related to the
application of solar cells for energy by converting sunlight directly into electricity by the photovoltaic
performance of photovoltaic systems so that the system can be deployed at a large scale. However,
PV solar cells are semiconductor devices which directly convert energy into electricity (Pradhan. A,
2013). Solar cells operate as a quantum device exchanging photons for electrons. Photons from the
sun with sufficient energy near the depletion region of a p-n junction produce electron-hole pairs. If
these electrons have enough energy, they will move to the conduction band, leaving holes in the
valence band. The potential difference across the depletion region provides an electric field that pulls
the electron to the n-region and hole to the p-region (Hart .G and Raghuuraman P, 2010) . The newly
free electron can then flow from the n-region to the p-region and recombines with the newly created
holes. In this way the energy of the incident photon is converted. The PV solar cells output
performance varies with atmospheric factors. Since sunlight is intermittent, solar cells cannot
produce energy at a constant rate and the power delivered at a certain instant is still very much a
function of climatological factors (Abhishek.k.T and Aruna, 2017).
1.2 HOW SOLAR CELL WORK
When light shines on solar panel it generated electron-hole pairs across the whole device. If the
device is open circuited, the electron hole pairs generated near the depletion region tend to
recombine with the charge in the depletion region, thus reducing the depletion region charge and
eventually reducing the depletion region. The reduction in depletion region is equivalent of applying
a forward bias to the device i.e. this reduction in depletion region tends to develop a potential across
the open terminals of the device. The maximum voltage that can be developed is the maximum
forward drop across the device which theoretically is possible with the complete elimination of the
depletion region (Green. A and Martin, 1982). This maximum voltage that can be developed across
the open circuited device is called the open circuit voltage. If the device is short circuited, the
generated holes and electrons produce a current corresponding to the incoming photons. This
current is called the short circuit current Solar panels work best in certain weather conditions, but
since the weather is always changing and as engineers are installing solar panels all over the world in
different climate regions, most panels do not operating under ideal conditions. That is why it is
important for engineers to understand how panels react to different weather conditions. With this
knowledge, they can design ways to improve the efficiency of solar panels that operate in
certain temperatures. For example, solar power plants in extremely hot climates may pass a cool
liquid behind the panels to pull away heat and keep the panels cool.
1.3 MODELING OF SOLAR CELL
To understand the electronic behavior of a solar cell, it is useful to create a model which is
electrically equivalent whose behavior is well defined. A solar cell was modelled by a current
source in parallel with a diode. In practice no solar panel is ideal, so a shunt resistance and a series
resistance component are added to the model Krauter. S, 2004. The circuit model of a solar cell is
drawn in Figure 1(a)
Figure 1(a): Solar cell model
From the circuit model in Figure 1(a), it is evident that the current produced by the solar cell is equal
to that produced by the current source, minus that which flows through the diode, minus that which
flows through the shunt resistor such that:
SH D
L I I
I
I (1)
Where
I = output current of a solar panel (ampere)
IL = photogenerated current (ampere)
ID = diode current (ampere)
ISH = shunt current (ampere).
The current through the circuit is governed by the voltage across them:
IRs V
VJ (2)
Where
Vj = voltage across both diode and resistor
(volt)
I = output current (ampere)
RS = series resistance (Ω).
From the Shockley diode equation, the current diverted through the diode Ike.C.U, (2013) is
exp 1
T j O D nV V I I (3) where
I0 = reverse saturation current (ampere)
n = diode ideality factor (1 for an ideal diode)
VT = KT/q: the thermal voltage. At 25 °C,
From Ohm's law, the current diverted through the shunt resistor is:
SH j SH
R
V
I
(4)Substituting equations (2), (3) and (4) into equation (1) produces the characteristic model equation of
a solar cell, which relates solar cell parameters to the output current and voltage.
SH T O L R IRs V nV IRs V I I
I
exp 1 (5)
1.4 OPEN-CIRCUIT VOLTAGE AND SHORT-CIRCUIT CURRENT
When solar cell is operated at open circuit, I = 0 and the voltage across the output terminals is
defined as the open-circuit voltage. Assuming the shunt resistance is high enough to neglect the
final term of the characteristic equation, the open-circuit voltage VOC is:
ln
1
O L oc
I
I
q
nKT
V
(6) Where,q = charges
k = Boltzmann's constant
T = absolute temperature
Similarly, when solar panel is operated at short circuit, V = 0 and the current I through the terminals
is defined as the short-circuit current (Jafari V.F, 2011). It can be shown that for a high-quality solar
L SC I
I (7)
It is not possible to extract any power from solar cell when operating at either open circuit or short
circuit conditions.
1.5 TYPES OF PHOTOVOLTAIC SOLAR CELLS
The main types of solar cells in use today are crystalline silicon, both single and multi-crystalline, and
they are known as thin film solar cells, which include amorphous silicon, cadmium telluride, copper
indium gallium diselenide (CIGS), and copper indium diselenide (CIS) Mahfoud .A etal (2015). Organic
photovoltaic cells and dye-sensitized cells have been discovered. It is the connection of two or more
cells either in series or parallel makes photovoltaic panel.
1.6 MATERIALS AND METHODS
Experimental method was used to generate the result of these practical results in table 1. Three flat
plate photovoltaic solar modules of the same material were used for the study. Each solar module
containing seventy two amorphous silicon solar cells, rated 30W peak, 21V, model G100, ARCO.
SOLAR INC, active area of 30cm2 and manufactured by BP solar system LTD. A 6.1kΩ variable resistor
was used as a load in the study. A low resistance ammeter, high resistance voltmeter, and five in one
Auto Raging Digital Multi-meter (serial number M58209) were used for monitoring and measuring
the output current, voltage and ambient temperature, respectively. The product of voltage and
current was done to obtain power.
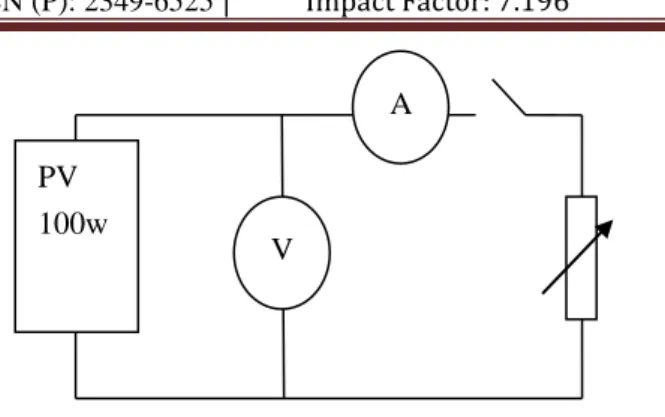
1.7 EXPERIMENTAL SET-UP
The photovoltaic panel includes three flat amorphous silicon solar modules connected in parallel
configuration. They were mounted horizontally on a metal plate frame, which was raised above the
roof-top using an iron steel pole at the back of the Department of Electrical and Electronic
Engineering workshop at Enugu State University of Science and Technology. The photovoltaic solar
electricity array was capable of operating in the range of 80W – 100W, 12V – 20V. To the PV solar
array, a low resistance voltmeter was connected in series while a high resistance voltmeter was
connected in parallel to the 6.1kΩ variable resistor using as a load. Figure 1 shows the circuit model
Figure 1: Shows the circuit model of Experimental set-up
Table1: The average monthly values of Temp. And power output of a solar panel for year 2014
MONTHS Temp. (OC) PV Power Output(W)
January 34.20 70.20
February 33.10 68.60
March 35.00 72.10
April 32.40 68.20
May 30.10 67.40
June 29.20 67.20
July 28.00 66.80
Aug 28.60 67.00
September 29.00 67.60
October 30.10 68.00
November 32.00 67.80
December 33.20 68.40
A
V PV
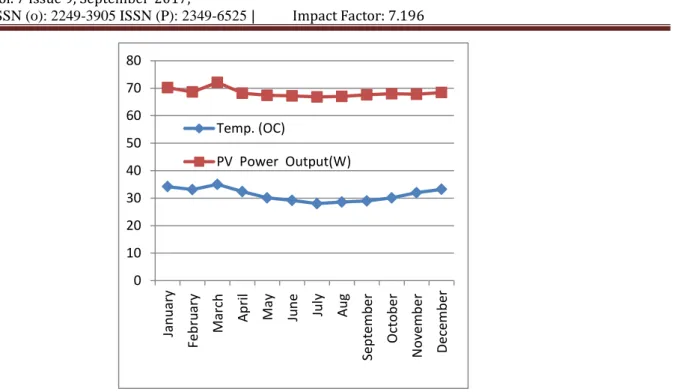
Figure 2: Shows the graph of temp. Vs power output of a solar panel for year 2014
Table2: The average monthly values of Temp. And power output of a solar panel for year 2015
MONTHS Temp.(OC) PV Power Output(W)
January 34.30 70.00
February 33.60 69.40
March 34.60 71.10
April 33.10 68.30
May 32.00 67.8
June 30.20 67.20
July 29.40 67.00
Aug 29.60 67.20
September 29.00 67.40
October 31.20 68.60
November 33.30 69.00
December 33.60 69.80
0 10 20 30 40 50 60 70 80 Jan u ar y Fe b ru ar y Ma rch Ap ril Ma y Ju n e Ju ly Au g Se p te m b e r Octo b e r N o ve m b e r De ce m b er Temp. (OC)
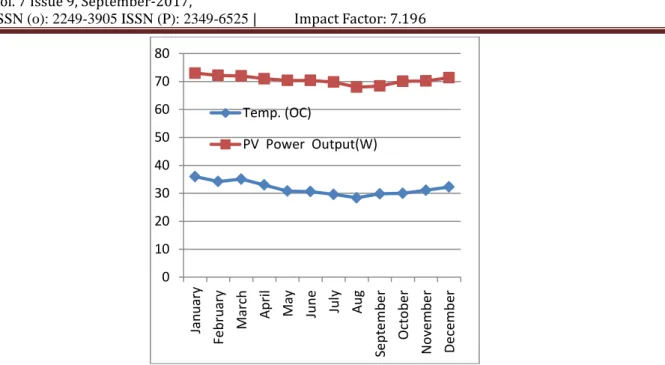
Figure3: Shows the graph of temp. Vs power output of a solar panel for year 2015
Table3: The average monthly values of Temp. And power output of a solar Panel for year 2016
MONTHS Temp. (OC) PV Power Output(W)
January 36.00 73.00
February 34.20 72.20
March 35.10 72.00
April 33.00 71.00
May 30.80 70.40
June 30.60 70.40
July 29.60 69.80
Aug 28.40 68.00
September 29.80 68.40
October 30.00 70.10
November 31.10 70.20
December 32.30 71.40
0 10 20 30 40 50 60 70 80 Jan u ar y Fe b ru ar y Ma rch Ap ril Ma y Ju n e Ju ly Au g Se p te m b e r Octo b e r N o ve m b e r De ce m b er Temp. (OC)
Figure 4: Shows the graph of temp. Vs power output of a solar panel for year 2016
RESULTS ANALYSIS
The results obtained from the experiment were presented in both tabular and graphical forms in
other to bring out the detailed results. From Table 1, the monthly values of average Temperature and
power output of a solar panel obtained in the year 2014 was presented. In Figure 2, the graph of
table 1 was presented. It was observed that the power output of solar panel varies with temperature
changes. Again in the year 2014, it was observed that the highest power output of a solar panel
recorded was on match and the value was 72.10W at a temperature of 35oC. Table 2 shows the
average monthly values of data obtained in the year 2015. Figure 3 was the graphical representation
of table 2. From the results, it was observed that the highest values of power outputs obtained in the
year 2015 were in the months of November, December, January, February and March. The maximum
values of power output in these months of the year were attributed to the high solar radiation
intensity received, a period when the atmosphere is relatively clean and clear, as a result of little or
no cloud, dust free and low humidity. Table 3 shows the average monthly values of temperature and
power output of a solar panel in the year 2016 while figure 4 shows the graph of table 3. From the
results, it is observed that, the power output of a solar panel changes with temperature.
0 10 20 30 40 50 60 70 80 Jan u ar y Fe b ru ar y Ma rch Ap ril Ma y Ju n e Ju ly Au g Se p te m b e r Octo b e r N ov e m b e r De ce m b er Temp. (OC)
CONCLUSION
Based on the results obtained, it is clearly shown that Temperature has great effect on the power
output of a Solar panel. So it is advisable that when installing Solar panel on a roof, a space of few
inches should be provided to allow air flow to cool the panel. Again the manufacture of solar panel
should produce it with light cooled material to reduce heat absorption.
REFERENCE
Abhishek.k.T and Aruna (2017): Output power loss of photovoltaic panel due to dust and
temperature .International Journal of Renewable Energy Research.
Green. A and Martin (1982): Solar cells: Operating Principles, Technology and system Applications,
Prentice-Hall: Englewood cliffs, NJ.
Hart. G and Raghuraman. P (2010): Simulation of thermal aspects of residential Photovoltaic systems,
MIT Report.
Henry .S(2014): Maximum Power tracking for photovoltaic power system Development and
Experimental comparison of two algorithms. Renewable Energy, Pg 2381-2487.
http://www.pvpowerway.com/en/knowledge/photovoltaic.html.
Ike .C.U (2013): The effect of temperature on the performance of a photovoltaic solar system in
Eastern Nigeria. International Journal of Engineering and Science Pg 10-14.
Jafari V.F. (2011): Effect of Temperature on photovoltaic cell efficiency. International Conference on
Emerging Trends in Energy conservation-ETEC.
Krauter. S. (2004): Increased electrical yield via water flow over the front of photovoltaic panels. Solar
Energy materials and solar cells.
Mahfoud .A, Mekhilef.S and Djahli .F (2015): Effect of Temperature on the GaInP/GaAs Tandem solar
cell. International Journal of Renewable Energy Research (IJRER) Pg 629-634.
Pradhan Arjyahara and Ali .S.M (2013): Analysis of solar PV cell performance with changing Irradiance