Analysis of HIV DNA polymerase chain reaction (PCR) results obtained from children <6 months old at primary health care clinics in the Western Cape has suggested that the HIV vertical transmission rate in the province declined to 4.8% during 2007 (95% confidence interval 4.4 - 5.3%).1 Consequently, there should have been an appreciable decline in the number of HIV-infected children who access care at hospitals in the province. The general impression at Red Cross War Memorial Children’s Hospital (RCH) is that there has not been a substantial drop in the HIV-related workload – a view supported by results of HIV DNA PCR tests performed at hospitals in the province. Of 1 722 tests performed in 2007 on children aged <6 months, 24.7% were positive.1 Young children (<6 months old) constitute a sizeable proportion of the inpatient HIV workload at RCH. The majority of these children presented with advanced HIV disease, and their associated inpatient mortality approached 30%.2
Several publications have described HIV-related workload in paediatric wards at public sector hospitals in South Africa.3-9 Five of the 7 studies described in Table I were conducted prospectively. Six of the 7 studies were completed before antiretroviral therapy (ART) became widely available within the public sector, from the beginning of 2004 onwards, the exception being a cross-sectional study by Schneider et al., completed in early 2005.6 The 3 Gauteng studies were all completed at Chris Hani Baragwanath Hospital and, although different study designs were used, the results documented the change in HIV prevalence at a single hospital over an extended period.4-6 Because few reports have assessed
HIV prevalence rates among hospitalised children in the antiretroviral era, the present study was completed. The specific objectives were to document the HIV, tuberculosis (TB) and HIV-TB co-infection prevalence rates in hospitalised children; to determine the proportion of hospitalised HIV-infected children who required high care; to describe the proportion of deaths associated with HIV and/or TB; and to relate workload to the level of nursing cover in a general paediatric ward over a 1-year period in a setting with an established prevention of mother-to-child transmission (PMTCT) intervention programme and relatively high ART coverage.
Methods
Study setting
This prospective study was conducted throughout 2007 in ward B1, a general paediatric ward at RCH. The Research Ethics Committee of the University of Cape Town approved the study (Reference: 124/2008). The hospital has two general 28-bed paediatric wards in which the majority of children with HIV infection and/or TB who require inpatient care at the hospital are currently admitted. Both general wards manage a similar patient mix, experience similar patient volumes, and have comparable staff complements. Therefore, the study focused on evaluating HIV and TB workload in one of the two general wards.
M Weakley,
RN
A Vries,
RN
Department of Nursing, Red Cross War Memorial Children’s Hospital, Cape Town
K L Reichmuth,
MB ChB, Dip HIV Man
V Pillay,
MB ChB, DCH, Dip HIV Man
B S Eley,
MB ChB, FCPaed (SA), BSc (Hons)
Paediatric Infectious Diseases Unit, Red Cross War Memorial Children’s Hospital and School of Child and Adolescent Health, University of Cape Town
Corresponding author: B Eley ([email protected])
HIV infection, tuberculosis and
workload in a general paediatric ward
S
A
Jo
ea
lth
S
A
Jo
ur
nal
of Child
H
ea
lth
S
A
Jo
ur
nal
of Child
H
ea
lth
Aim. To describe the impact of HIV infection and tuberculosis on the workload of a general paediatric ward at Red Cross War
Memorial Children’s Hospital in 2007.
Methods. Prospective descriptive surveillance of the patient composition of a general paediatric ward over a 1-year period.
Results. Median bed occupancy was 96.4%, and 66.7% of all patients hospitalised to the ward were less than 12 months old. Of all the admitted children, 27.6% had HIV infection, and 16.7% had tuberculosis (TB). Dual HIV and TB infection was present in
10.3% of all patients. Of all the children requiring high care, 23.1% were HIV infected. Approximately 50% of all children with HIV infection were on antiretroviral therapy. The annualised nurse-to-patient ratios were 1 registered nurse per 2.7 patients, and 1 professional nurse per 5.0 high-care patients. Fifty-six children died while in hospital, of whom 34 (60.7%) were HIV infected. Pneumonia was the main cause of death in both HIV-infected and uninfected children.
Conclusion. Despite prevention of mother-to-child-transmission intervention and paediatric antiretroviral treatment programmes, HIV infection and TB contribute substantially to the general paediatric workload at the hospital. Work associated with specific nursing functions should be quantified so that patient/nurse ratios may be optimised.
SAJCH JULY 2009 VOL. 3 NO. 2
55
Data collection
Information describing the patient composition and nursing cover in ward B1 was collected prospectively between
08h00 and 09h00 on 347 days throughout 2007 by one of two professional nurses. General indicators of the patient profile
included total patient number, number <4 months old, number
<12 months old, and number requiring high-care monitoring or intervention. Indicators of HIV and TB workload included total number of patients with HIV infection, number of
HIV-infected children requiring high care, number of patients on
ART, number with TB, and number with HIV-TB co-infection.
Nursing cover in the ward was determined by the total number of registered nurses and the total number of professional nurses on duty.
Case definitions
At each data collection point, each patient in the ward was
classified using the following definitions for HIV infection, TB, HIV-TB co-infection and high care.
HIV infection
A child <18 months old with a positive HIV DNA PCR result, or a child >18 months old with 2 positive serological test
results (HIV enzyme-linked immunosorbent assay (ELISA)
and/or HIV rapid test) or a positive HIV DNA PCR result.
Tuberculosis
Any child who had been started on anti-TB medication was
regarded as having TB. Children on isoniazid prophylaxis were not included.
HIV-TB co-infection
All children who fulfilled the case definition of HIV infection and in addition were receiving anti-TB medication.
High-care monitoring or intervention
‘High care’ is a level of clinical care between standard paediatric care and intensive (or critical) care. The following patient categories were considered in need of high care: all neonates, all children requiring respiratory support with supplemental
oxygen (saturation monitoring), children requiring monitoring of one or more organ systems (including level of consciousness, seizure frequency, and vital signs monitoring at a frequency
<2-hourly), monitoring the administration of total parenteral
nutrition, and the care of children with tracheostomies,
haemofiltration and/or continuous peritoneal dialysis.
Information on children who died was extracted from the hospital case records using a standardised data collection sheet.
Statistical analysis
Weight-for-age z-scores (WAZ) were calculated using EpiInfo
2008, version 3.5.1 (Division of Surveillance and Epidemiology, Centers for Disease Control, Atlanta, Georgia). Moderate and severe underweight were defined as a WAZ of >–3.0 to <–2.0, and <–3.0, respectively. The data were analysed using STATA, release 9, College Station, Texas, USA. The 95% confidence
interval for binomial proportions was used to estimate the frequency of positive HIV DNA PCR results. Conventional
descriptive statistical methods were used. The Shapiro-Wilk
test of normality was employed to assess the distribution of
continuous variables. The two-sample Wilcoxon rank sum test
was used to compare continuous variables. A p-value <0.05 was regarded as significant.
Results
Inpatient workload
During 2007, 907 children were hospitalised in ward B1, a mean ± standard deviation (SD) of 75.5±10.7 children per
month; 810 children were either discharged or transferred out
of the ward, i.e. a mean ± SD of 67.5±10.2 per month. During the year, 59 children who had been inpatients in the ward
died – 56 while in hospital and 3 after hospital discharge. The median bed occupancy rate of this 28-bed ward throughout 2007 was 27 patients or 96.4%, interquartile range (IQR) 93 -
100%. Of all the children admitted to ward B1, 66.7% (IQR 59
- 76%) were <12 months old and 21.8% (IQR 18 - 27%) were <4
months old. Median monthly variations are shown in Fig. 1.
Table I. PublISHeD HIV PReValence RaTeS aMong cHIlDRen HoSPITalISeD In SouTH afRIcan InSTITuTIonS
Reference Study and year of completion Institution type HIV prevalence
Roux3 Paediatric inpatients sampled at one
time point (1999) 18 facilities, Cape Town 8.3% (106/1 264)
Zwi4 Hospitalised children during a 5-year
period (1992 - 1996) Tertiary hospital, Gauteng 1992: 7.5% (120/1 592)1993: 14.5% (228/1 574)
1994: 23.3% (304/1 307) 1995: 30.9% (449/1 455) 1996: 42.3% (870/2 057)
Meyers5 Hospitalised children during a 6-month
period (2000) Tertiary hospital, Gauteng 29.2% (144/493)
Schneider6 Hospitalised children during a 28-day
period (2005) Tertiary hospital, Gauteng 31.5% (of 554)
Yeung7 Hospitalised children over a 4-month
period (1996 – 1997) District hospital, KwaZulu-Natal 26% (72/281)
Pillay8 Hospitalised children over a 4-week
period (1998) Tertiary hospital, KwaZulu-Natal 62.5% (100/160)
van Deventer9 Hospitalised children during a 1-year
period (2001) Secondary hospital, Free State 16.8% (of 1 836)
Furthermore, 57.1% (IQR 54 - 62%) of all hospitalised children required high-care monitoring or interventions.
A median of 27.6% (IQR 24.6 - 29.9) of all children in ward B1 had confirmed HIV infection. The median percentage of all children with TB was 16.7% (IQR 14.2 - 20.6%). Furthermore, 10.3% (IQR 6.9 - 13.8%) of all children had dual HIV and TB infection (Fig. 2). Of all children requiring high care, 23.1% (IQR 17 - 29%) were HIV-infected (Fig. 3). A median of 4 children (50%) of all HIV-infected children hospitalised to the
ward were on highly active antiretroviral therapy (HAART) at any one time point. This percentage remained fairly constant throughout the study period (data not shown).
nurse/patient ratios
Total registered nursing complements comprised all professional, staff and auxiliary nurses. Median monthly ratios of total patients to total number of registered nurses, and children requiring high care to total number of professional nurses, are presented in Fig. 4. The median ratios for the entire
year were 1 registered nurse per 2.7 patients and 1 professional
nurse per 5.0 high-care patients.
Deaths during hospitalisation
Three children died at home. Each had an underlying
potentially terminal condition: 1 had primary T-cell immune deficiency and had been discharged for palliation at home, 1
had Down syndrome with congenital cardiac defects, and 1 was HIV infected.
Characteristics of the 56 children who died during hospitalisation are presented in Table II. The majority were male (66.1%), <12 months old (82.1%) and moderately or severely underweight (60.7%). Of the 6 children with
peripheral oedema, 1 had a normal WAZ, 4 were moderately
underweight, and 1 was severely underweight. There were
11 HIV-uninfected children; 6 participated in the PMTCT intervention programme: 3 mothers had tested HIV negative and therefore received no further intervention, while 3 mothers
tested positive and were given prophylaxis with a satisfactory
outcome. Thirty-four children were HIV infected; 19 had participated in the PMTCT programme – 14 failed PMTCT
Table II. cHaRacTeRISTIcS of cHIlDRen wHo DIeD In HoSPITal (n=56)
Gender (%) Female 19 (33.9)
Median age in months (IQR) 4.50 (2.55 - 8.45)
Number <12 months old (%) 46 (82.1)
Nutrition
Median weight-for-age
z-score (IQR) –2.40 (–3.44 to –1.49)
Number moderately
underweight (%) 12 (21.4)
Number severely
underweight (%) 22 (39.3)
Number with peripheral
oedema (%) 6 (10.7)
HIV status
Infected 34 (60.7)
Exposed but uninfected 3 (5.4)
Uninfected 8 (14.3)
Unknown 11 (19.6)
IQR = interquartile range. 0 5 10 15 20 25 30 35 Ja n Fe b M ar A pr M ay Ju n Ju l A ug S ep O ct N ov D ec A nn ua l N um be r
Total number of patients Number < 12 months old
Number < 4 months old
Fig. 1. Median numbers (total number, number <4 months old, and number <12 months old) of children admitted to ward B1 in 2007.
0 5 10 15 20 25 30 35 Ja n F
eb Mar
A
pr
M
ay Jun Jul Aug Sep Oct Nov
D ec A nn ua l P er ce nt ag e
HIV-infected children Children w ith active TB Children w ith HIV-TB co-infection
Fig. 2. Proportions of patients with HIV infection, tuberculosis and HIV-TB co-infection. 0 5 10 15 20 25 30 35 N u m b e r
Total number of patients Number <12 months old Number <4 months old
0 5 10 15 20 25 30 35 Ja n F
eb Mar
A
pr
M
ay Jun Jul Aug Sep Oct Nov
D ec A nn ua l P er ce nt ag e
HIV-infected children Children w ith active TB Children w ith HIV-TB co-infection
Fig. 3. The percentage of patients requiring high care, including the proportion in high care who were HIV-infected.
Fig. 3. The percentage of patients requiring high care, including the proportion in high care who were HIV-infected.
Fig. 4. Ratios of total number of patients to total number of nurses on duty and number of patients in high care to number of registered nurses on duty.
0.0 1.0 2.0 3.0 4.0 5.0 6.0 7.0 8.0 Ja n F e b M a r A p r M a y Ju n J u l A u g S e p O c t N o v D e c A n n u a l
Total patient-to-nurse ratio High care patient-to-registered nurse ratio 0.0 10.0 20.0 30.0 40.0 50.0 60.0 70.0 J
an Feb Mar
Apr May Jun Jul Aug Se
p Oc t N ov D ec An nu al Perc ent a ge
Patients in the ward requiring high care Patients requiring high care who are HIV-infected 0 5 10 15 20 25 30 35 Ja n F
eb Mar
A
pr
M
ay Jun Jul Aug Sep Oct Nov
D ec A nn ua l P er ce nt ag e
HIV-infected children Children w ith active TB Children w ith HIV-TB co-infection 0 5 10 15 20 25 30 35 Ja n F
eb Mar
A
pr
M
ay Jun Jul Aug Sep Oct
N ov D ec A nn ua l P er ce nt ag e
HIV-infected children Children w ith active TB Children w ith HIV-TB co-infection 0 5 10 15 20 25 30 35 Ja n F
eb Mar
A
pr
M
ay Jun Jul Aug Sep Oct
N ov D ec A nn ua l P er ce nt ag e
HIV-infected children Children w ith active TB Children w ith HIV-TB co-infection 0 5 10 15 20 25 30 35 Ja n F
eb Mar
A
pr
M
ay Jun Jul Aug Sep Oct Nov
D ec A nn ua l P er ce nt ag e
HIV-infected children Children w ith active TB Children w ith HIV-TB co-infection 0 5 10 15 20 25 30 35 Ja n F
eb Mar
A
pr
M
ay Jun Jul Aug Sep Oct Nov
D ec A nn ua l P er ce nt ag e
HIV-infected children Children w ith active TB Children w ith HIV-TB co-infection 0 5 10 15 20 25 30 35 Ja n F
eb Mar
A
pr
M
ay Jun Jul Aug Sep Oct Nov
D ec A nn ua l P er ce nt ag e
HIV-infected children Children w ith active TB Children w ith HIV-TB co-infection 0 5 10 15 20 25 30 35 Ja n F
eb Mar
A
pr
M
ay Jun Jul Aug Sep Oct
N ov D ec A nn ua l P er ce nt ag e
HIV-infected children Children w ith active TB Children w ith HIV-TB co-infection 0 5 10 15 20 25 30 35 Ja n F
eb Mar
A
pr
M
ay Jun Jul Aug Sep Oct Nov
D ec A nn ua l P er ce nt ag e
HIV-infected children Children w ith active TB Children w ith HIV-TB co-infection 0 5 10 15 20 25 30 35 Ja n F
eb Mar
A
pr
M
ay Jun Jul Aug Sep Oct Nov
D ec A nn ua l P er ce nt ag e
HIV-infected children Children w ith active TB Children w ith HIV-TB co-infection 0 5 10 15 20 25 30 35 Ja n F
eb Mar
A
pr
M
ay Jun Jul Aug Sep Oct Nov
D ec A nn ua l P er ce nt ag e
HIV-infected children Children w ith active TB Children w ith HIV-TB co-infection
0.0 1.0 2.0 3.0 4.0 5.0 6.0 7.0 8.0 Ja n Fe b M ar A pr M
ay Jun Jul Aug Sep Oct Nov
D ec A nn ua l
Total patient-to-nurse ratio High care patient-to-registered nurse ratio
Fig. 4. Ratios of total number of patients to total number of nurses on duty and number of patients in high care to number of registered nurses on duty.
intervention, while 5 did not receive PMTCT intervention because their mothers had tested HIV negative by the rapid test antenatally.
There were 9 children on HAART at the time of death.
Seven had been started on treatment 32.3±24.5 days prior to
hospitalisation. The other 2 children were started on HAART during admission. Both were severely immunosuppressed,
with baseline CD4 percentages of 9.0% and 14.3%. The 9 children on HAART were older than the remaining 25
HIV-infected children who were not yet on HAART at the time
of death; median age 8.2 (IQR 7.0 - 12.6) v. 3.3 (IQR 2.7 - 5.0)
months, p=0.0235. The median WAZ was significantly lower in the HAART group, i.e. –3.97 (IQR –3.97 to –3.06) v. –1.52
(IQR –2.7 to –0.94), p=0.0010.
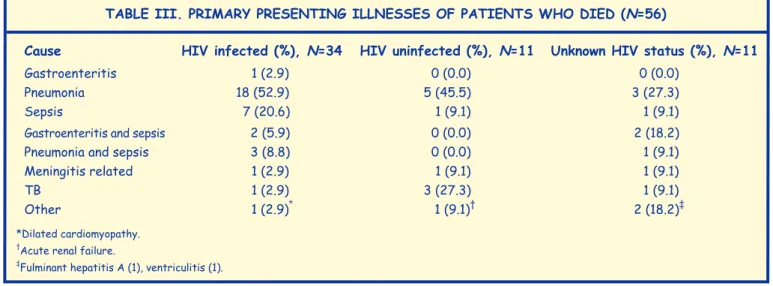
Pneumonia was the primary presenting illness in patients who died (Table III). Of the 18 HIV infected children who died of pneumonia, 5 (27.8%) had proven Pneumocystis jirovecii pneumonia, only one of whom was on co-trimoxazole
prophylaxis at the time of hospitalisation. TB was considered
the cause of death in 4 children – 1 HIV infected and 3 uninfected. An additional 6 (17.6%) of the 34 HIV-infected children were co-infected with TB. However, TB was not
considered the primary cause of their deaths. Factors possibly
contributing to death in the HIV-uninfected group included congenital heart disease (2 children), cystic fibrosis (1),
congenital syphilis (1) and severely underweight with oedema
(1). Eleven children had unknown HIV status at death. Factors
possibly contributing to their deaths included congenital rubella (1 child), congenital hydrocephalus (2, one with an associated meningomyelocele), congenital heart disease (2) and severely underweight with oedema (1).
Discussion
In this study, we documented high rates of HIV infection and TB among hospitalised children in a general paediatric ward during 2007. HIV infection was the dominant disease, diagnosed in 27.6% of hospitalised patients. The study was not designed to gauge the success of recently introduced interventions in the Western Cape, such as the implementation of the public sector ART rollout and the introduction of dual zidovudine and nevirapine prophylaxis for PMTCT since April
- May 2004.10,11 The prevalence of HIV infection recorded in the
present study is high for a single disease. Contributing factors probably include high HIV prevalence (estimated at 12.6% in
2007) among women of child-bearing age in the Western Cape,
gaps in the PMTCT intervention programme, and inadequate
care for HIV-infected infants.11-13 Furthermore, migration
of patients to the Western Cape from provinces with
less-developed PMTCT intervention and treatment programmes probably contributed to the high HIV prevalence.
The care of HIV-infected infants should be aligned with
recently updated World Health Organization (WHO) treatment
recommendations. In particular, all HIV-infected infants
must be fast-tracked for HAART soon after diagnosis.14 This
programmatic change should reduce the rate of hospitalisation
of HIV-infected children, particularly the high proportion of
young infants with advanced disease;2 this requires urgent
consideration by national and provincial policymakers, because the increasing under-5 mortality rate in South Africa is directly linked to the paediatric HIV epidemic, which can be
ameliorated with effective intervention.13,15
Several features of current general paediatric practice at RCH
are described in the present study; these include the high
proportion of children <12 months old among hospitalised patients, that approximately 25% of children who required
high-care monitoring or intervention were HIV infected, and the relatively high HAART coverage among HIV-infected
inpatients. A study completed in 2006 showed that young
children constituted a sizeable proportion of the HIV workload at RCH. In that study, more than 40% of HIV-infected inpatients were <6 months old; and more than 90% of young children who were HIV-infected but not on HAART had advanced HIV
infection.2 The findings of the present study complement the previous findings. Furthermore, at the end of 2006, a policy was implemented whereby all HIV-infected infants were
commenced on HAART before hospital discharge, which may account for the relatively high proportion of inpatients receiving HAART.
Overall, 16.7% of hospitalised patients had TB. Of these, more
than 60% (or 10.3% of all hospitalised children) had HIV-TB co-infection. A recurring observation made by nurses in the
general paediatric wards is that the administration of both
antiretroviral agents and anti-TB medication to co-infected
children requires considerable nursing time. The present study
did not measure this aspect of the nursing workload. Instead, we confined our analysis to measuring patient/nurse ratios.
While the total patient/registered nurse ratio was acceptable,
the ratio of high-care patients to professional nurses was
Table III. PRIMaRy PReSenTIng IllneSSeS of PaTIenTS wHo DIeD (n=56)
cause HIV infected (%), n=34 HIV uninfected (%), n=11 unknown HIV status (%), n=11
Gastroenteritis 1 (2.9) 0 (0.0) 0 (0.0)
Pneumonia 18 (52.9) 5 (45.5) 3 (27.3)
Sepsis 7 (20.6) 1 (9.1) 1 (9.1)
Gastroenteritis and sepsis 2 (5.9) 0 (0.0) 2 (18.2)
Pneumonia and sepsis 3 (8.8) 0 (0.0) 1 (9.1)
Meningitis related 1 (2.9) 1 (9.1) 1 (9.1)
TB 1 (2.9) 3 (27.3) 1 (9.1)
Other 1 (2.9)* 1 (9.1)† 2 (18.2)‡
*Dilated cardiomyopathy. †Acute renal failure.
‡Fulminant hepatitis A (1), ventriculitis (1).
relatively high. The nurse/patient ratio and the proportion of
care provided by professional nurses are known to influence
quality of care, nosocomial infection rates and patient outcome.16-19 In contrast, inadequate staffing is associated with
job dissatisfaction, burnout, and increased staff turnover.19,20 In a study conducted in Massachusetts hospitals, the mean
(± SD) patient-to-registered nurse ratios for paediatric and paediatric critical care settings were 2.99 (± 0.6) and 1.39 (± 0.21)
respectively.21 Although optimal patient/nurse ratios remain unclear, these published ratios suggest that general paediatric wards in South Africa, with a large proportion of patients
requiring high-care monitoring or interventions, should be
staffed by a higher proportion of professional nurses. Further research is required to optimise patient/nurse ratios. In
particular, the workload associated with common HIV-related
activities, such as the provision of optimal palliative care and
the administration of HAART to infants, should be quantified.
These inpatient functions will assume greater importance as the response to the paediatric HIV epidemic in South Africa improves.22,14
Pneumonia was the common diagnosis among children who
died. Although confirmed HIV infection was present in 60.7%
of children who died during hospitalisation, several children
had other risk factors, including congenital heart disease and malnutrition. These findings are similar to a recent analysis of 6 839 child deaths at South African institutions using the Child Healthcare Problem Identification Programme. In that
analysis, 48% of all children who died had WHO clinical stage
3 or 4 HIV infection, and 35% of deaths were associated with
pneumonia.23 The extent to which palliative care interventions
were administered to dying patients was not evaluated in the present study. Effective palliative care, including adequate
pain control, requires significant nursing and medical time.22
The data for the present study were primarily collected by two
professional nurses during working hours, which limited the number of information fields that were collected. Despite this constraint, data were collected on 347 days of 2007, provided a detailed description of HIV- and TB-related workload in a
general paediatric ward, and generated further questions
about specific aspects of nursing functions.
In conclusion, HIV and TB remain dominant paediatric
diseases managed at RCH. The findings of this study may serve
as a basis for evaluating the impact of future interventions on paediatric practice, including the anticipated introduction of
HAART for all HIV-infected infants immediately following confirmation of their status.
We thank Dr M Coetzee (RCH and the University of Cape Town) for the case definition of ‘high care monitoring or intervention’, and the Records Department at RCH for retrieval of patient case files.
References
1. Boulle A, Osler M. Roundtable discussion on progress in the Western Cape Province in addressing paediatric HIV needs: What does our data tell us? Minutes from a meeting convened by the HIV/AIDS Directorate of the Western Cape Department of Health, 23 June 2008.
2. Finlayson H, Eley B. Treatment and outcome of hospitalised, very young, HIV-infected children. S Afr J Child Health 2007; 1(4): 140-144.
3. Roux P, Henley L, Cotton M, et al. Burden and cost of inpatient care for HIV-positive paediatric patients – status in the Cape Town Metropole during the second week of March 1999. S Afr Med J 2000; 90: 1008-1011. 4. Zwi K, Pettifor J, Soderlund N, Meyers T. HIV infection and in-hospital
mortality at an academic hospital in South Africa. Arch Dis Child 2000; 83: 227-230.
5. Meyers T, Pettifor JM, Gray GE, Crewe-Brown H, Galpin JS. Pediatric admissions with human immunodeficiency virus infection at a regional hospital in Soweto, South Africa. J Trop Pediatr 2000; 46: 224-230. 6. Schneider H, Moore D, Dlamini N. Paediatric admissions for HIV in
an era of PMTCT: evidence from Chris Hani Baragwanath Hospital, presented at the 3rd Public Health Conference, 2006 (abstract). S Afr J Epidemiol Infect 2006; 21(3): 109-110.
7. Yeung S, Wilkinson D, Escott S, Gilks CF. Paediatric HIV infection in a rural South African district hospital. J Trop Pediatr 2000; 46: 107-110. 8. Pillay K, Colvin M, Williams R, Coovadia HM. Short report: Impact of
HIV-1 infection in South Africa. Arch Dis Child 2001; 85: 50-51. 9. van Deventer JD, Carter CL, Schoeman CJ, Joubert G. The impact of
HIV on the profile of paediatric admissions and deaths at Pelonomi Hospital, Bloemfontein, South Africa. J Trop Pediatr 2005; 51: 391-392. 10. Eley B. Addressing the paediatric HIV epidemic: a perspective from
the Western Cape region of South Africa. Trans Roy Soc Trop Med Hyg 2006; 100: 19-23.
11. Draper B, Abdullah F. A review of the prevention of mother-to-child transmission programme of the Western Cape provincial government, 2003-2004. S Afr Med J 2008; 98: 431-434.
12. Department of Health. The National HIV and Syphilis Antenatal Sero-Prevalence Survey in South Africa 2007. Pretoria: Directorate Health Systems Research, Research Coordination and Epidemiology, Department of Health, 2008. http://www.doh.gov.za/docs/antenatal-f.html (accessed 19 January 2008).
13. Violari A, Cotton MF, Gibb DM, et al. Early antiretroviral therapy and mortality among HIV-infected infants. N Engl J Med 2008; 359: 2233-2244.
14. World Health Organization. Report of the WHO technical reference group. Paediatric HIV/ART care guideline group meeting. Geneva, Switzerland: World Health Organization, April 2008. http://www. who.int/hiv/pub/paediatric/WHO_Paediatric_ART_guideline_rev_ mreport_2008.pdf (accessed 20 April 2008).
15. Countdown coverage writing group on behalf of the Countdown to 2015 Core Group. Countdown to 2015 for maternal, newborn, and child survival: the 2008 report on tracking coverage of interventions. Lancet 2008; 371: 1247-1258.
16. Needleman J, Buerhaus P, Mattke S, Stewart M, Zelevinsky K. Nurse staffing levels and the quality of care in hospitals. N Engl J Med 2002; 346: 1715-1722.
17. Mark BA, Harless DW, Berman WF. Nurse staffing and adverse events in hospitalised children. Policy Polit Nurs Pract 2007; 8(2): 82-92. 18. Stratton KM. Pediatric nurse staffing and quality of care in the hospital
setting. J Nurs Care Qual 2008; 23(2): 105-114.
19. Aiken LH, Clarke SP, Slone DM, et al. Hospital nurse staffing and patient mortality, nurse burnout, and job dissatisfaction. J Am Med Assoc 2002; 288: 1987-1993.
20. King LA, McInerney PA. Hospital workplace experiences of registered nurses that have contributed to their resignation in the Durban metropolitan area. Curationis 2006; 29(4): 70-81.
21. Welton JM, Unruh L, Halloran EJ. Nurse staffing, nursing intensity, staff mix, and direct nursing care costs across Massachusetts hospitals. J Nurs Adm 2006; 36: 416-425.
22. Harding R, Gwyther L, Powell FM. Treating HIV/AIDS patients until the end of life. J Acquir Defic Syndr 2007; 44: 364-365.
23. Patrick ME, Stephen CR. Child PIP: Making mortality meaningful by using a structured mortality review process to improve the quality of care that children receive in the South African health system. S Afr J Child Health 2008; 2(2): 38-42.