Eanes Independent School District
Facility Condition
Assessment
FINAL REPORT:
June 5, 2013
Date:
June 5, 2013
TABLE OF CONTENTS
NOMENCLATURE ... 12
EXECUTIVE SUMMARY ... 13
Background ... 13
Acknowledgements ... 14
Condition Indices ... 14
System States ... 15
Overview of Findings ... 16
Cost Assumptions ... 20
Renewal Forecast ... 24
Forecasted Needs Table ... 24
Recommendations ... 26
APPENDIX A – Building Systems Descriptions and Expected Life Cycles ... 27
Systems Descriptions ... 27
Systems Life Cycles ... 28
APPENDIX B – Building Cost Models ... 29
Cost Models ... 29
EISD PD Cost Models ... 30
APPENDIX C – Campus Assessment Reports ... 33
BARTON CREEK ELEMENTARY SCHOOL ... 34
Assessment Findings ... 34
Condition Summary ... 34
EXTERIORS ... 34
INTERIORS ... 34
MECHANICAL ... 35
ELECTRICAL ... 35
PLUMBING ... 35
Cost Summary ... 35
Renewal Forecast ... 39
BRIDGE POINT ELEMENTARY SCHOOL ... 44
Assessment Findings ... 44
Condition Summary ... 44
EXTERIORS ... 44
INTERIORS ... 45
MECHANICAL ... 45
ELECTRICAL ... 45
PLUMBING ... 45
Cost Summary ... 46
Renewal Forecast ... 49
CEDAR CREEK ELEMENTARY SCHOOL ... 61
Assessment Findings ... 61
Condition Summary ... 61
EXTERIORS ... 61
INTERIORS ... 61
MECHANICAL ... 62
ELECTRICAL ... 62
PLUMBING ... 62
Cost Summary ... 62
Renewal Forecast ... 66
EANES ELEMENTARY SCHOOL ... 74
Assessment Findings ... 74
Condition Summary ... 74
Buildings A, B, C, I, F, G, H: 1960-1964 Building K 1985 ... 74
EXTERIORS ... 74
INTERIORS ... 75
MECHANICAL ... 75
ELECTRICAL ... 75
PLUMBING ... 75
Building M 1993 ... 75
Building L and J ... 75
Cost Summary ... 76
Renewal Forecast ... 79
FOREST TRAIL ELEMENTARY SCHOOL ... 105
Assessment Findings ... 105
Condition Summary ... 105
EXTERIORS ... 105
INTERIORS ... 105
MECHANICAL ... 106
ELECTRICAL ... 106
PLUMBING ... 106
Cost Summary ... 107
Renewal Forecast ... 110
VALLEY VIEW ELEMENTARY SCHOOL ... 117
Condition Summary ... 117
EXTERIORS ... 117
INTERIORS ... 118
MECHANICAL ... 118
Renewal Forecast ... 122
Hill Country Middle School ... 129
Assessment Findings ... 129
Condition Summary ... 129
EXTERIORS ... 129
INTERIORS ... 130
MECHANICAL ... 130
ELECTRICAL ... 130
PLUMBING ... 130
Cost Summary ... 131
Renewal Forecast ... 134
WEST RIDGE MIDDLE SCHOOL ... 141
Condition Summary ... 141
EXTERIORS ... 141
INTERIORS ... 142
MECHANICAL ... 142
ELECTRICAL ... 142
PLUMBING ... 142
Cost Summary ... 143
Renewal Forecast ... 146
WESTLAKE HIGH SCHOOL ... 156
Condition Summary ... 156
2001 Addition Ninth Grade Center ... 157
EXTERIORS ... 157
INTERIORS ... 157
MECHANICAL ... 157
ELECTRICAL ... 157
PLUMBING ... 157
Original Building ... 158
EXTERIORS ... 158
INTERIORS ... 158
MECHANICAL ... 158
ELECTRICAL ... 158
PLUMBING ... 158
2004 Additions ... 159
EXTERIORS ... 159
INTERIORS ... 159
MECHANICAL ... 159
ELECTRICAL ... 159
PLUMBING ... 159
EXTERIORS ... 160
INTERIORS ... 160
MECHANICAL ... 160
ELECTRICAL ... 160
PLUMBING ... 160
The Learning Center ... 161
Cost Summary ... 162
Renewal Forecast ... 165
ADMINISTRATION BUILDING ... 176
Assessment Findings ... 176
Condition Summary ... 176
EXTERIORS ... 176
INTERIORS ... 176
MECHANICAL ... 177
ELECTRICAL ... 177
PLUMBING ... 177
Cost Summary ... 178
Renewal Forecast ... 181
Forecasted Needs Table ... 182
ROCKHOUSE ... 187
Assessment Findings ... 187
Condition Summary ... 187
EXTERIORS ... 187
INTERIORS ... 187
MECHANICAL ... 188
ELECTRICAL ... 188
PLUMBING ... 188
Cost Summary ... 189
Renewal Forecast ... 192
DISTRICT WAREHOUSE ... 198
Assessment Findings ... 198
Condition Summary ... 198
EXTERIORS ... 198
INTERIORS ... 199
MECHANICAL ... 199
ELECTRICAL ... 199
PLUMBING ... 199
Cost Summary ... 200
Renewal Forecast ... 203
LIST OF TABLES
Table 1.Q-rating Descriptions ... 15
Table 2.Summary of Assessment Findings by Campus ... 18
Table 3. Forecasted Needs Table ... 25
Table 4. Elementary Schools, CRV $160/Sqft ... 30
Table 5. PAC or Gymnasium, CRV $197/Sqft ... 31
Table 6. Middle School and High School Classrooms, CRV $191/Sqft ... 32
Table 7. Barton Creek Elementary School Summary of Assessment Findings. ... 35
Table 8. Forecasted Needs Table Barton Creek Elementary School ... 40
Table 9. Barton Creek Elementary School Expired Systems – 10 Year look ahead ... 41
Table 10. Bridge Point Elementary School Summary of Assessment Findings. ... 46
Table 11. Forecasted Needs Table ... 51
Table 12. Bridge Point Elementary School Expired Systems – 10 Year look ahead ... 52
Table 13. Cedar Creek Elementary School Summary of Assessment Findings. ... 62
Table 14. Forecasted Needs Table Cedar Creek Elementary School ... 67
Table 15. Cedar Creek Elementary School Expired Systems – 10 Year look ahead ... 68
Table 16. Eanes Elementary School Summary of Assessment Findings. ... 76
Table 17. Forecasted Needs Table Eanes Elementary School ... 81
Table 18. Eanes Elementary School Expired Systems – 10 Year look ahead ... 81
Table 19. Forest Trail Elementary School Summary of Assessment Findings. ... 107
Table 20. Forecasted Needs Table Forest Trail Elementary School ... 112
Table 21. Forest Trail Elementary School Expired Systems – 10 Year look ahead ... 113
Table 22. Valley View Elementary School Summary of Assessment Findings. ... 119
Table 23. Forecasted Needs Table Valley View Elementary School ... 124
Table 24. Valley View Elementary School Expired Systems – 10 Year look ahead ... 125
Table 25. Hill Country Middle School Summary of Assessment Findings. ... 131
Table 26. Forecasted Needs Table Hill Country Middle School ... 136
Table 27. Hill Country Middle School Expired Systems – 10 Year look ahead ... 137
Table 28. West Ridge Middle School Summary of Assessment Findings. ... 143
Table 29. Forecasted Needs Table West Ridge Middle School ... 148
Table 30. West Ridge Middle School Expired Systems – 10 Year look ahead ... 149
Table 31. Westlake High School Summary of Assessment Findings. ... 162
Table 32. Forecasted Needs Table Westlake High School ... 167
Table 33. Westlake High School Expired Systems – 10 Year look ahead ... 168
Table 35. Forecasted Needs Table ... 183
Table 36. Administration Building Expired Systems – 10 year look ahead ... 184
Table 37. Rockhouse Summary of Assessment Findings. ... 189
Table 38. Forecasted Needs Table Rockhouse ... 194
Table 39. Rockhouse Expired Systems – 10 Year look ahead ... 195
Table 40. District Warehouse Summary of Assessment Findings. ... 200
Table 41. Forecasted Needs Table District Warehouse ... 205
LIST OF FIGURES
Figure 1. System or Component Lifecycle Curve ... 16
Figure 2. Facility Condition vs. Facility Age ... 19
Figure 3. Current Needs (2013) ... 21
Figure 4. Extended Cumulative Needs 5-year forecast (2018) ... 21
Figure 5. Extended Cumulative Needs 10-year forecast (2023) ... 22
Figure 6. Current (2013) Needs by Priority ... 22
Figure 7. Extended 5-year (2018) Needs by Priority ... 23
Figure 8. Extended 10-year forecast (2023) Needs by Priority ... 23
Figure 9. Renewal Forecast ... 24
Figure 10. Current Needs (2013) – Barton Creek Elementary School ... 36
Figure 11. Cumulative projected Cost of Expired Systems (2018) – Barton Creek Elementary
School ... 36
Figure 12. Cumulative projected Cost of Expired Systems (2023) – Barton Creek Elementary
School ... 37
Figure 13. Current (2013) Needs By Priority –
Barton Creek Elementary School
... 37
Figure 14. Extended (2018) Needs By Priority –
Barton Creek Elementary School
... 38
Figure 15. Extended (2023) Needs By Priority –
Barton Creek Elementary School
... 38
Figure 16. Renewal Forecast – Barton Creek Elementary School ... 39
Figure 17. Current Needs (2013) – Cedar Creek Elementary School ... 46
Figure 18. Cumulative projected Cost of Expired Systems (2018) – Cedar Creek Elementary
School ... 47
Figure 19. Cumulative projected Cost of Expired Systems (2023) – Cedar Creek Elementary
School ... 47
Figure 20. Current (2013) Needs By Priority –
Cedar Creek Elementary School
... 48
Figure 21. Extended (2018) Needs By Priority –
Cedar Creek Elementary School
... 48
Figure 22. Extended (2023) Needs By Priority –
Cedar Creek Elementary School
... 49
Figure 23. Renewal Forecast – Bridge Point Elementary School ... 49
Figure 24. Current Needs (2013) – Cedar Creek Elementary School ... 63
Figure 25. Cumulative projected Cost of Expired Systems (2018) – Cedar Creek Elementary
School ... 63
Figure 26. Cumulative projected Cost of Expired Systems (2023) – Cedar Creek Elementary
School ... 64
Figure 27. Current (2013) Needs By Priority –
Cedar Creek Elementary School
... 64
Figure 28. Extended (2018) Needs By Priority –
Cedar Creek Elementary School
... 65
Figure 30. Renewal Forecast – Cedar Creek Elementary School ... 66
Figure 31. Current Needs (2013) – Eanes Elementary School ... 76
Figure 32. Cumulative projected Cost of Expired Systems (2018) – Eanes Elementary School 77
Figure 33. Cumulative projected Cost of Expired Systems (2023) – Eanes Elementary School 77
Figure 34. Current (2013) Needs By Priority –
Eanes Elementary School
... 78
Figure 35. Extended (2018) Needs By Priority –
Eanes Elementary School
... 78
Figure 36. Extended (2023) Needs By Priority –
Eanes Elementary School
... 79
Figure 37. Renewal Forecast – Eanes Elementary School ... 79
Figure 38. Current Needs (2013) – Forest Trail Elementary School ... 107
Figure 39. Cumulative projected Cost of Expired Systems (2018) – Forest Trail Elementary
School ... 108
Figure 40. Cumulative projected Cost of Expired Systems (2023) – Forest Trail Elementary
School ... 108
Figure 41. Current (2013) Needs By Priority –
Forest Trail Elementary School
... 109
Figure 42. Extended (2018) Needs By Priority –
Forest Trail Elementary School
... 109
Figure 43. Extended (2023) Needs By Priority –
Forest Trail Elementary School
... 110
Figure 44. Renewal Forecast – Forest Trail Elementary School ... 110
Figure 45. Current Needs (2013) – Valley View Elementary School ... 119
Figure 46. Cumulative projected Cost of Expired Systems (2018) – Valley View Elementary
School ... 120
Figure 47. Cumulative projected Cost of Expired Systems (2023) – Valley View Elementary
School ... 120
Figure 48. Current (2013) Needs By Priority –
Valley View Elementary School
... 121
Figure 49. Extended (2018) Needs By Priority –
Valley View Elementary School
... 121
Figure 50. Extended (2023) Needs By Priority –
Valley View Elementary School
... 122
Figure 51. Renewal Forecast – Valley View Elementary School ... 122
Figure 52. Current Needs (2013) – Hill Country Middle School ... 131
Figure 53. Cumulative projected Cost of Expired Systems (2018) – Hill Country Middle School
... 132
Figure 54. Cumulative projected Cost of Expired Systems (2023) – Hill Country Middle School
... 132
Figure 55. Current (2013) Needs By Priority –
Hill Country Middle School
... 133
Figure 56. Extended (2018) Needs By Priority –
Hill Country Middle School
... 133
Figure 57. Extended (2023) Needs By Priority –
Hill Country Middle School
... 134
Figure 60. Cumulative projected Cost of Expired Systems (2018) – West Ridge Middle School
... 144
Figure 61. Cumulative projected Cost of Expired Systems (2023) – West Ridge Middle School
... 144
Figure 62. Current (2013) Needs By Priority –
West Ridge Middle School
... 145
Figure 63. Extended (2018) Needs By Priority –
West Ridge Middle School
... 145
Figure 64. Extended (2023) Needs By Priority –
West Ridge Middle School
... 146
Figure 65. Renewal Forecast – West Ridge Middle School ... 146
Figure 66. Current Needs (2013) – Westlake High School ... 162
Figure 67. Cumulative projected Cost of Expired Systems (2018) – Westlake High School .... 163
Figure 68. Cumulative projected Cost of Expired Systems (2023) – Westlake High School .... 163
Figure 69. Current (2013) Needs By Priority –
Westlake High School
... 164
Figure 70. Extended (2018) Needs By Priority –
Westlake High School
... 164
Figure 71. Extended (2023) Needs By Priority –
Westlake High School
... 165
Figure 72. Renewal Forecast – Westlake High School ... 165
Figure 73. Current Needs (2013) ... 178
Figure 74. Cumulative Projected Cost of Expired Systems (2018) ... 179
Figure 75. Cumulative Projected Cost of Expired Systems (2023) ... 179
Figure 76. Current (2013) Needs By Priority ... 180
Figure 77. Extended (2018) Needs By Priority ... 180
Figure 78. Extended 10-year forecast (2023) Needs By Priority ... 181
Figure 79. Renewal Forecast ... 181
Figure 80. Current Needs (2013) – Rockhouse ... 189
Figure 81. Cumulative projected Cost of Expired Systems (2018) – Rockhouse ... 190
Figure 82. Cumulative projected Cost of Expired Systems (2023) – Rockhouse ... 190
Figure 83. Current (2013) Needs By Priority –
Rockhouse
... 191
Figure 84. Extended (2018) Needs By Priority –
Rockhouse
... 191
Figure 85. Extended (2023) Needs By Priority –
Rockhouse
... 192
Figure 86. Renewal Forecast – Rockhouse ... 192
Figure 87. Current Needs (2013) – District Warehouse ... 200
Figure 88. Cumulative projected Cost of Expired Systems (2018) – District Warehouse ... 201
Figure 89. Cumulative projected Cost of Expired Systems (2023) – District Warehouse ... 201
Figure 90. Current (2013) Needs By Priority –
District Warehouse
... 202
Figure 91. Extended (2018) Needs By Priority –
District Warehouse
... 202
Figure 92. Extended (2023) Needs By Priority –
District Warehouse
... 203
NOMENCLATURE
ADA
Americans with Disabilities Act
ACBM
Asbestos Containing Building Material
AHERA
Asbestos Hazard Emergency Response Act
ALPHA
ALPHA Facilities Solutions, LLC
ASHRAE
American Society of Heating, Refrigerating and Air Conditioning Engineers
ASTM
American Society for Testing and Materials
BOMA
Building Owners and Managers Association
CO2
Carbon dioxide
CPSC
U.S. Consumer Product Safety Commission
CRV
Current Replacement Value
DDC
Direct digital control
DX
Direct-expansion
FCA
Facility Condition Assessment
FCI
Facility Condition Index
FPE
Federal Pacific Electric
GSF
Gross Square Feet
HVAC
Heating, Ventilation and Air Conditioning
IAQ
Indoor air quality
K-12
Kindergarten Through Twelfth Grade
LBP
Lead-based Paint
MEP
Mechanical, Electrical and Plumbing
NFPA
National Fire Protection Association
O&M
Operations and Maintenance
PCB
Polychlorinated Biphenyls
PVC
Polyvinyl chloride
Q-RATING
Quality Rating
ROM
Rough Order of Magnitude
SAMPLE
SAMPLE School District
EXECUTIVE SUMMARY
Background
Eanes Independent School District executed a contract with ALPHA Facilities Solutions, LLC
(ALPHA), in December 2012, to help determine current and future capital renewal needs and to
help ensure that levels of investment in the District are aligned with performance requirements.
The scope of work included in ALPHA’s assessment effort included:
1. Performing a Facility Condition Assessment (FCA) to document physical conditions
•
Conducting a system-levelevaluationof major building systems that included
visual observations and validation of system life-cycles on facilities that are older
than 25 years at the time of this report:
§
Eanes Elementary School
§
Cedar Creek Elementary School
§
Valley View Elementary School
§
Forest Trail Elementary School
And the portions of the following facilities that are newer than 25 years old at the
time of this report:
§
Westlake High School
§
Hill Country Middle School
•
Conducting a component-level evaluationto determine condition based on visual
observations and validation of system life-cycles and identification of major
mechanical, electrical, plumbing, and limited architectural components needs on
facilities newer than 25 years old:
§
West Ridge Middle School
§
Barton Creek Elementary School
§
Bridge Point Elementary School
§
Administration Building
§
Eanes Bus Garage
2. Developing a facility condition index (FCI) for each facility using SchoolDude’s
commercial off-the-shelf PlanningDirect Application
Note: Exterior features such as pavements and site utilities, athletic facilities and roof covering systems were not included in ALPHA’s scope of work.
A project kick-off meeting was conducted on Eanes ISD Maintenance and Operations offices on
January 10, 2013,to discuss project standards, procedures, and timelines. A four-person
assessment team from ALPHA was deployed to Austin on January 21, 2013, to perform the
assessment.
Acknowledgements
ALPHA would like to thank the custodial, maintenance, and administrative staff located at each
school for their support.
Condition Indices
Major building systems were evaluated during the assessment to determine current and
predicted conditions based on expected service life. The expected service life for major systems
was determined using statistical methods developed by the Building Owners and Managers
Association (BOMA); a few system life cycles were adjusted based on local conditions. Refer to
Appendix A for detail information on Life Cycles used for this project. Data obtained during the
assessment was entered into PlanningDirect, a powerful capital-planning tool that simplifies
planning for future capital needs.
As part of the project analysis, a facility condition index (FCI) was calculated for each facility.
The FCI was used to quantify a facility’s physical condition at a specific point in time by creating
a ratio of the estimated “total cost of maintenance and repair requirements” over a facility’s
“current replacement value” (CRV).
Example:
Total cost of maintenance & repair requirements= $3,000,000
Facility’s current replacement value = $10,000,000
𝐹𝐶𝐼
=
1
−
$3
,
000
,
000
𝑅𝑒𝑞𝑢𝑖𝑟𝑒𝑚𝑒𝑛𝑡𝑠
$10
,
000
,
000
𝐶𝑅𝑉
𝑋
100
=
70%
Maintenance and repair requirements consist of work that is necessary to restore the facility to a
condition substantially equivalent to its original capability.
The FCI is utilized to assign the condition of a facility with a Quality Rating (Q-rating) of one
through four - see Table 1. Q-ratings were developed by the Department of Defense to group
FCIs into bands to provide a clear picture of where each facility is within the portfolio. Q-ratings
also provide the baseline necessary to develop future facility investment strategies.
Table 1.Q-rating Descriptions
Rating Band Calculated Rating (FCI) General Description
Q-1 100% to 90% Facility is new or in good condition
Q-2 <90% to 80% Facility is in satisfactory condition
Q-3 <80% to 60% Facility is in poor condition
Q-4 <60% to 0% Facility should be considered for replacement
It is important to note that poor Q-ratings are seldom the result of a single factorsuch as poor
maintenance practices, but are frequently the result of a combination of factors including facility
age, the environment, and operations and maintenance (O&M) funding.
A survey of 69 K-12 schools in the eastern United States yielded an average FCI of 73%, while
the average FCI in five years is estimated to be 59% assuming current facility sustainment
funding levels.
System States
The design life of a building system or component describes the manufacturers anticipated
duration for which a system is expected to perform within expected operational parameters. The
design life may be shortened for a variety of reasons including, neglect, inadequate
maintenance, overburdened, or vandalism.
The useful life of a building system or component describes the duration for which the system or
component operates from its optimum (100%) level of performance from installation down to its
minimally accepted level of performance at which time it would fail or be replaced. Useful life
may extend significantly beyond design life for a variety of reasons including, irregular use or a
comprehensive preventative maintenance program.
As illustrated in the figure below, a facility condition assessment will make an appraisal of
systems and components and recommend one of a series of actions necessary to maintain the
building in functional use:
•
Extended:
The lifecycle of a system or component may be extended beyond its
anticipated design life if the element is deemed to be performing adequately. This
extension beyond design life is described as a system or component’s useful life.
•
Expired:
A system or component may be recommended for replacement (at any time) if
the element is deemed to be performing inadequately. To prevent double-counting costs,
if a deficient component is part of an expired system, only system-level costs are used in
the FCI calculation.
•
Missing:
A system or component may be deemed missing if the element absent, but is
required for the operation f a facility (ADA requirements for accessible ramps).
•
Not applicable:
A system or component that is neither present, nor required for the
operation f a facility (An elevator in a single story building).
Figure 1. System or Component Lifecycle Curve
Overview of Findings
During the course of the FCA ALPHA Facilities Solutions, evaluated 36 buildings, totaling 1.4
million square feet. The average FCI for the facilities evaluated is 86% while the average FCI in
five years is estimated to be 66%, and the 10 year average FCI is expected to be 57%,
assuming that no capital investment is made within the 10 year reporting period. The median
FCI for the facilities evaluated is 92%, while the median FCI in five years is estimated to be 69%
and the 10 year median FCI is expected to be 59%, assuming that no capital investment is
made within the 10 year reporting period. It is important to note, that the roofing systems were
not included in the scope of this project and roofing need may affect the FCI of the portfolio.
1. Activities such as routine maintenance and painting appear to be conducted in an
effective and consistent manner throughout the District. It is for this reason that building
components have, at times, exceeded their expected design life and continue to
perform at the intended service level.
2. Although only a sample of emergency wall-packs and exit signs were observed, a large
percentage of the sample failed.
3. Large portions of the District’s exterior doors are in fair condition or are at the end of
their design life.
4. Fire detection and alarm systems have a 10-year designed life but many of the systems
are in a good condition and have been extended for capital planning.
5. Facilities classified for individual needs assessment have MEP building systems expiring
due to age. Those systems have been placed in a renewal status for capital planning
rather than creation of individual needs.
A summary of physical condition assessment findings by campus is provided in Table 2.
Table 2.Summary of Assessment Findings by Campus
Age (Years)
Administration Building 1989 24 28,690 75% Q3 50% Q4 44% Q4
Barton Creek Elementary 1991 22 88,712 95% Q1 87% Q2 74% Q3
Bridge Point Elementary 1997 16 94,230 91% Q1 76% Q3 72% Q3
Cedar Creek Elementary 1978 35 75,990 88% Q2 69% Q3 59% Q4
Eanes Elementary 1937 76 67,350 94% Q1 78% Q3 70% Q3
Forest Trail Elementary 1985 28 79,431 95% Q1 52% Q4 43% Q4
Hill Country Middle School 1975 38 142,458 98% Q1 78% Q3 67% Q3
Maintenance &
Tranportation Offices 1970 43 5,000 92% Q1 75% Q3 75% Q3
Rockhouse 1960 53 2,400 37% Q4 34% Q4 26% Q4
Valley View Elementary 1982 31 72,916 97% Q1 58% Q4 51% Q4
Warehouse 1970 43 6,350 78% Q3 46% Q4 40% Q4
Westlake High School 1969 44 573,776 95% Q1 88% Q2 72% Q3
Westridge Middle School 1986 27 178,570 90% Q1 62% Q3 55% Q4
86%
Q2
66%
Q3
57%
Q4
92%
Q1
69%
Q3
59%
Q4
Forecast Composite Rating (2023)
FCI Q-rating
Eanes ISD
(Median)
Eanes ISD
(Average)
Current Composite Rating
Forecast Composite Rating (2018)
Campus Year
Built Area (SF) FCI Q-rating FCI Q-rating
Note: Potential cost associated with hazardous material inspection, evaluation, and mitigation, including asbestos abatement, is not included in FCI calculations. It should also be noted that major renovations might trigger mandated requirements for compliance with provisions of the Americans with Disabilities Act (ADA) and other building codes.
It can be useful to view facility conditions in a graphic manner in order to clearly demonstrate
the relationship between a facility’s age and it’s physical condition. The diamond data points
shown in Figure 1 below depicts current (2013) physical condition in relationship to age for each
building, while the square data points show the predicted physical condition for each building by
the year 2018 and the triangle data points show the predicted physical condition for each
building by the year 2023.
Cost Assumptions
Although building systems judged to be beyond useful service life (also referred to as expired
systems) are often marginally functional, they should be considered for replacement for reasons
such as:
6. Electrical systems with obsolete components or inadequate capacity to meet technology
needs should be replaced in order to handle demands of 21
stcentury school facilities
7. Galvanized domestic water piping that has deteriorated or copper piping installed prior to
the prohibition of lead solder should be replaced to mitigate risk of contaminated drinking
water.
8. Cast iron and galvanized wastewater piping that leaks or has become increasingly
difficult to maintain should be replaced at the time of next major renovation or
replacement of fixtures.
9. Mechanical Systems that have reached the end of their expected useful life are
important energy conservation opportunities, and should be considered for system
replacement with modern energy efficient systems in lieu of constant component repairs.
Each system judged to be beyond useful service life or requiring replacement was given a rough
order of magnitude Rough Order of Magnitude (ROM) cost estimate. Cost estimates were
developed using data contained in PlanningDirect’s cost modeling software, which is based on
construction cost data from multiple sources. Cost estimates were also adjusted using regional
area cost factors. Additional information regarding cost models is contained in Appendix B.
The figures below depict the distribution of costs for systems in all facilities assessed that are
currently beyond useful service life and systems that are projected to be beyond useful service
life by the years 2018 and 2023 respectively. Assessed systems have been grouped as follows:
•
Interiors
•
Exteriors
•
Electrical
•
Mechanical
•
Plumbing
•
Built-in Specialties
•
Individual Needs
Figure 3. Current Needs (2013)
Figure 4. Extended Cumulative Needs 5-year forecast (2018)
Exteriors, $6,231,350 Interiors, $23,400,787 Electrical, $13,701,456 Mechanical, $4,695,739 Plumbing, $8,936,268 Special Needs, $716,301
TOTAL: $57,681,901
Figure 5. Extended Cumulative Needs 10-year forecast (2023)
PlanningDirect allows the grouping of needs by their level of urgency. In order to group needs, a
priority of High, Medium or Low is assigned. the following figures show the District’s needs
grouped by priority on a current (2013), 5-year (2018) and 10-year forecast (2023).
Figure 6. Current (2013) Needs by Priority
Exteriors, $7,940,896 Interiors, $44,091,614 Electrical, $17,707,964 Mechanical, $6,563,746 Plumbing, $11,004,831 Special Needs, $716,301
TOTAL: $88,025,352
$6,272,538 $10,303,816 $159,882 $0 $2,000,000 $4,000,000 $6,000,000 $8,000,000 $10,000,000 $12,000,000Figure 7. Extended 5-year (2018) Needs by Priority
Figure 8. Extended 10-year forecast (2023) Needs by Priority
$21,559,485 $18,616,178 $770,002 $0 $5,000,000 $10,000,000 $15,000,000 $20,000,000 $25,000,000
Low Medium High
$19,912,329 $10,431,123 $0 0 5,000,000 10,000,000 15,000,000 20,000,000 25,000,000
Renewal Forecast
An important product of this initiative is the development of a renewal forecast. The renewal
forecast describes the current maintenance and repair backlog as well projected facility
sustainment requirements. Please note the renewal forecast does not include potential costs
associated with hazardous material inspection, evaluation and mitigation, including asbestos
abatement; and National Fire Protection Association (NFPA) and ADA upgrades that might be
required. The 10-year renewal forecast for all facilities is illustrated in the following figure.
Figure 9. Renewal Forecast
Forecasted Needs Table
Forecasted needs describes the expiration of an entire system based on the age and condition
of that system, such as an HVAC system that may still be functioning adequately, though it is
beyond its deign life. The table, “Forecasted Needs: Summarized by System”, illustrated in the
figure below, provides renewal costs information for the District organized by building systems
and reporting periods. Please note that any individual need of a non-expired system has been
cataloged under the “Special Needs” category.
$16,736,236 $1,297,990 $6,928,006 $5,866,493 $334,109 $26,519,067 $13,751,415 $6,363,735 $5,734,890 $2,556,961 $1,936,451 $- $5,000,000 $10,000,000 $15,000,000 $20,000,000 $25,000,000 $30,000,000 2013 2014 2015 2016 2017 2018 2019 2020 2021 2022 2023 DOLLARS ($) REPORTING PERIOD
Table 3. Forecasted Needs Table Uniformat System 2013 ($) 2018 ($) 2023 ($) Facility Totals $16,736,236 $40,945,665 $30,343,451 B20 Building Exterior $520,883 $5,710,467 $1,709,546 B2010 Exterior Walls $4,247 $64,182 $1,051,897 B2020 Exterior Windows $451,911 $4,667,154 $632,278 B2030 Exterior Doors $64,725 $979,131 $25,371 B30 Roofing $- $- $- B3010 Roof Coverings $- $- $- C10 Interior Construction $71,985 $6,598,727 $13,061,968 C1020 Interior Doors $43,424 $2,390,971 $1,455,694 C1030 Fittings $28,561 $4,207,756 $11,606,274 C30 Interior Finishes $9,112,338 $7,617,737 $7,628,859 C3010 Wall Finishes $7,380,411 $967,076 $- C3020 Floor Finishes $365,481 $5,670,071 $4,982,939 C3030 Ceiling Finishes $1,366,446 $980,590 $2,645,920 D10 Conveying Systems $- $559,697 $1,442,389
D1010 Elevators & Lifts $- $559,697 $1,442,389
D20 Plumbing $1,816,194 $6,954,667 $1,826,879
D2010 Plumbing Fixtures $14,000 $2,088,841 $638,418
D2020 Plumbing Rough-in $1,802,194 $4,865,826 $1,188,461
D30 HVAC $1,822,492 $2,313,550 $425,618
D3020 Heat Generating Systems $- $- $-
D3030 Cooling Generating Systems $1,080,940 $- $134,288
D3040 Distribution System $741,552 $2,289,878 $22,080
D3060 Controls & Instrumentation $- $23,672 $269,250
D40 Fire Protection $2,240,617 $710,837 $2,545,754
D4010 Fire Alarm & Detection $2,240,617 $545,430 $2,304,070
D4040 Fire Sprinklers $- $165,407 $241,684 D50 Electrical $435,426 $10,479,983 $1,702,438 D5010 Electrical Equipment $39,801 $4,905,931 $181,610 D5020(01) Wiring $381,149 $1,984,352 $89,050 D5090(02) Lighting $14,476 $3,589,700 $1,431,778 D5091 Emergency Lighting $- $- $- D5092 Exit Signage $- $- $-
E10 Built-in Equip/Specialties $- $- $-
E1020 Institutional Equipment $- $- $-
Recommendations
1. Systems that have been expired due to age were a common occurrence in the majority
of the District. It is recommended to place these systems on an extended five-year
replacement or reevaluation cycle due to good condition.
2. Non-operational exit signage and wall-packs should be fully evaluated and placed on a
periodic maintenance or replacement schedule.
3. Refurbishing exterior door components, such as protective coatings, seals, gaskets,
and hardware, rather than replacement, can avoid costly system replacement.
4. Upgrading window systems can offer energy conservation opportunities. Although most
expired window systems are set to a medium priority and renewal extended due to
condition, replacement should be considered over refurbishment. Bridge Point and Hill
Country facilities have been identified to have a higher urgency to replace window
systems because deteriorating locks and seals.
5. The District’s oldest school, Eanes Elementary, has been maintained at a high level of
condition with many renewal projects completed. This campus has two historic
buildings that are still used for classroom instruction. Some of these building’s systems
are in need of renewal. It is important to consider that special pricing considerations
should be designated for historical building upgrades identified during the assessment
in order to maintain the historic appearance of the facility.
6. Most campuses’ Ceiling systems appear to have been renewed as required. It is
recommended that the buildings identified for ceiling tile replacement be scheduled
concurrently with lighting upgrades. Ceiling tiles can be replaced on a scheduled
10-year cycle while the Ceiling grid and tiles replaced every 20 10-years.
APPENDIX A – BUILDING SYSTEMS DESCRIPTIONS AND
EXPECTED LIFE CYCLES
Systems Descriptions
Building System Description
Building Exterior
Exterior Doors Doors at exterior walls
Exterior Walls (Not structural) Brick veneer, stucco, wood siding, etcetera Exterior Windows Windows at exterior walls
Interior Finishes
Interior Doors Doors at interior walls
Ceiling Finishes Painted drywall or plaster; suspended and glued-on acoustical tile Wall Finishes Painted drywall, plaster or masonry; ceramic tile
Floor Finishes Carpet, resilient, wood, concrete Fittings
Fittings
Sometimes referred to as millwork; cabinetry in bathrooms, kitchens and other spaces, as well as signage, bathroom equipment and bathroom partitions
Conveying Systems
Elevators Hydraulic or traction elevators for transporting personnel and freight Plumbing
Plumbing Rough-in (Piping) Piping associated with domestic water, gas and sanitary sewer Plumbing Fixtures Bathroom and kitchen fixtures
Fire Sprinklers Includes riser, piping and sprinkler heads associated with fire suppression system
HVAC
Controls Includes thermostats; pneumatic and direct digital controls
Equip Heating or cooling equipment such as boilers, heat exchangers,
chillers, cooling towers, etcetera Rough-in
(Piping and Ductwork)
Hydronic piping, radiators, circulating pumps, air handling units, ductwork, etcetera
Electrical
Fire Detection Smoke/heat detectors, annunciator panels, and audible/visual notifiers Service and Distribution Main switchgear, transformers, bus ducts, feeders, transfer switches,
etcetera
Wiring Electrical subpanels to include lighting circuits and branch circuits Lighting Lighting within a structure excluding emergency lighting and exit lights
Systems Life Cycles
System Lifecycle Years
Building Exterior
Exterior Doors 25
Exterior Walls (Not structural) 50
Exterior Windows 25 Interior Finishes Interior Doors 25 Ceiling Finishes 10 Wall Finishes 5 Floor Finishes 12 Built-in Equip/Specialties Built-in Equip/Specialties 20 Conveying Systems Elevators 25 Plumbing
Plumbing Rough-in (Piping) 30
Plumbing Fixtures 30
Plumbing Sprinklers 25
HVAC
Controls 20
Equip 30
Rough-in (Piping and Ductwork) 30 Electrical
Fire Detection 10
Service and Distribution 30
Wiring 30
APPENDIX B – BUILDING COST MODELS
Cost Models
Cost models used for the project were developed using traditional life cycle cost analysis
methodology, and are intended to develop a baseline from which to establish an FCI for each
facility. It is not unusual for those new to the life cycle cost analysis process to have
expectations that are not completely in alignment with what the process is intended to yield. For
example, the life cycle cost analysis process generates ROM budgeting-level costs. More
detailed costs are derived during formal preliminary design and final design cost estimating
processes.
Cost Models available within the capabilities of PD are a product of the selections made during
the creation of a building type.
Of the multiple construction types and considerations available within PD ALPHA has selected a
combination that produces the cost models in tables 1, 2 and 3. Costs are for planning purposes
and are not intended to be an exact project estimates. A limited number of line items have been
adjusted manually to adequately estimate a systems renewal cost and life cycle.
In the case of the interior ceiling system the life cycle has been reduced to from 15 to10 years.
This was done to place the system in a renewal cycle of tiles every 10 years and Grid and tiles
every 20 yrs. The cost associated with the system for this cycle is for the tile replacement at the
end of its life cycle.
In the case of the roofing and elevator system the amount will need to be adjusted on a
building-specific need, as PD does not adjust for the number of floors a building has. The amount
entered will be more closely related to true replacement cost rather than a parametric cost per
square foot.
Detailed information on the setup of cost models in PlanningDirect can be found in the
PlaningDirect User Manual attached to this report.
EISD PD Cost Models
Table 4. Elementary Schools, CRV $160/Sqft
Renewable Systems System % Life Cycle Estimated Cost /Sqft
Roofing Roofing (100%) 25 TBD
Exterior Doors Building Exteriors (20%) 30 $0.55
Exterior Walls Building Exteriors (50%) 50 $1.37
Exterior Windows Building Exteriors (30%) 30 $4.50
Interior Doors Interior Finishes (20%) 20 $2.03
Interior Walls Interior Finishes (15%) 5 $4.70
Floor Finishes Interior Finishes (40%) 15 $4.06
Ceiling Finishes Interior Finishes (25%) 10 $2.54
Built-in Equipment/Specialties Built-in Equipment/Specialties (100%) 15 $7.62
Elevators Elevators (100%) 20 TBD
Plumbing Rough-in Plumbing Rough-in (100%) 30 $10.96
Plumbing Fixtures Plumbing Fixtures (100%) 30 $6.60
Plumbing Sprinklers Plumbing Sprinklers (100%) 25 $4.11
HVAC Controls HVAC Controls (100%) 20 $5.08
HVAC Equipment HVAC Equipment (100%) 25 $7.92
HVAC Rough-in HVAC Rough-in (100%) 30 $15.76
Fire Detection Fire Detection (100%) 10 $2.86
Electrical Equipment Electrical Equipment (100%) 30 $13.97
Wiring Wiring (100%) 30 $6.85
Table 5. PAC or Gymnasium, CRV $197/Sqft
System System % Life Cycle Estimated Cost /Sqft
Roofing Roofing (100%) 25 TBD
Exterior Doors Building Exteriors (20%) 30 $0.69
Exterior Walls Building Exteriors (50%) 50 $1.74
Exterior Windows Building Exteriors (30%) 30 $1.04
Interior Doors Interior Finishes (20%) 20 $4.19
Interior Walls Interior Finishes (27%) 5 $5.76
Floor Finishes Interior Finishes (40%) 15 $8.37
Ceiling Finishes Interior Finishes (12%) 10 $2.62
Built-in Equipment/Specialties Built-in Equipment/Specialties (100%) 15 $18.42
Elevators Elevators (100%) 20 TBD
Plumbing Rough-in Plumbing Rough-in (100%) 30 $11.40
Plumbing Fixtures Plumbing Fixtures (100%) 30 $7.13
Plumbing Sprinklers Plumbing Sprinklers (100%) 25 $4.27
HVAC Controls HVAC Controls (100%) 20 $9.62
HVAC Equipment HVAC Equipment (100%) 25 $20.19
HVAC Rough-in HVAC Rough-in (100%) 30 $11.06
Fire Detection Fire Detection (100%) 10 $3.82
Electrical Equipment Electrical Equipment (100%) 30 $23.36
Wiring Wiring (100%) 30 $8.50
Table 6. Middle School and High School Classrooms, CRV $191/Sqft
System System % Life Cycle Estimated Cost /Sqft
Roofing Roofing (100%) 25 TBD
Exterior Doors Building Exteriors (20%) 30 $2.21
Exterior Walls Building Exteriors (35%) 50 $3.86
Exterior Windows Building Exteriors (45%) 30 $4.97
Interior Doors Interior Finishes (20%) 20 $5.37
Interior Walls Interior Finishes (27%) 5 $7.38
Floor Finishes Interior Finishes (40%) 15 $10.73
Ceiling Finishes Interior Finishes (12%) 10 $3.35
Built-in Equipment/Specialties Built-in Equipment/Specialties (100%) 15 $12.35
Elevators Elevators (100%) 20 TBD
Plumbing Rough-in Plumbing Rough-in (100%) 30 $4.47
Plumbing Fixtures Plumbing Fixtures (100%) 30 $2.80
Plumbing Sprinklers Plumbing Sprinklers (100%) 25 $1.68
HVAC Controls HVAC Controls (100%) 20 $19.44
HVAC Equipment HVAC Equipment (100%) 25 $40.82
HVAC Rough-in HVAC Rough-in (100%) 30 $22.36
Fire Detection Fire Detection (100%) 10 $3.39
Electrical Equipment Electrical Equipment (100%) 30 $16.58
Wiring Wiring (100%) 30 $7.54
BARTON CREEK ELEMENTARY SCHOOL
Assessment Findings
Size (SF) 88,712 Date of construction 1991 Type ofConstruction One-Story Masonry Structure
Roof Ballasted Built-up Roof
Ceilings Acoustical Tile
Lighting Surface-Mounted and Lay-In
Fluorescent Fixtures Additions/
Renovations 2012
HVAC Four-pipe Chiller and Boiler System
Condition Summary
Barton Creek Elementary School is in good overall condition and appears to be well maintained.
The campus consists of the original 1991 building and a new 2012 HVAC building.
EXTERIORS
The windows are original single pane and in good condition, this system might possibly be an
energy conservation opportunity when in need of replacement. Exterior doors are original and in
fair condition; refurbishment is recommended for gaskets painting and hardware. All exterior
walls are of original brick veneer and in good condition. The exterior painted finishes are in need
of renewal.
INTERIORS
The interior wall finishes are in in fair condition; however, high traffic areas are in need of
re-painting. Floor finishes are a combination of carpet and VCT flooring, and are in good condition.
The ceiling finishes consist of acoustical tiles, which were replaced in 2012. The interior doors in
Hallway 300 are delaminated, the paint is failing, and it is recommended to replace them.
MECHANICAL
The HVAC system for the building consists of a four-pipe system with a cooling tower and chiller
system; a boiler provides heating. The HVAC system was updated in 2012 with the construction
of the new HVAC building. The campus has DDC controls for all major mechanical systems.
The campus has no elevators.
ELECTRICAL
The electrical system was updated for the needs of the new mechanical equipment. The original
portion of the system is in good condition. The light fixtures were replaced with the ceilings in
2012 and are in good condition. The fire alarm system appears to have been updated and is in
good condition.
PLUMBING
The plumbing fixtures and piping are original and in good condition. No leaks were observed.
Cost Summary
The following table contains information regarding current and forecasted FCI and Q-ratings.
Table 7. Barton Creek Elementary School Summary of Assessment Findings.
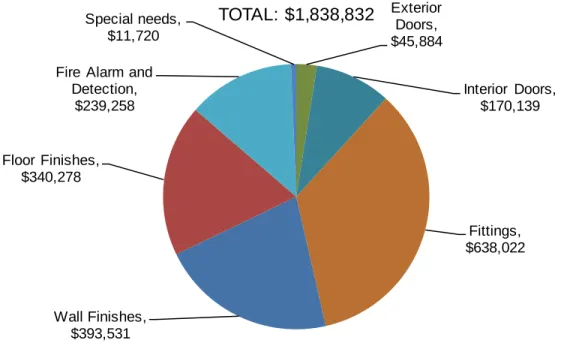
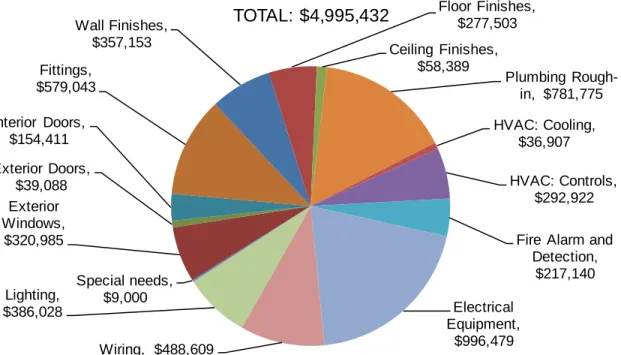
A summary of the physical condition assessment findings at Barton Creek Elementary School is
shown below. The figures below depict the distribution of systems currently beyond useful
service life and systems that are expected to be beyond useful service life by the year 2018 and
2023, respectively.
Barton Creek
Elementary 1991 22 88,712 95 Q1 87 Q2 74 Q3 $13,994,640
Name Year
Built Age Area
2013 FCI % Q-Rating CRV 2018 FCI % 2023 FCI % Q-Rating Q-Rating
Figure 10. Current Needs (2013) – Barton Creek Elementary School
Figure 11. Cumulative projected Cost of Expired Systems (2018) – Barton Creek Elementary School
Wall Finishes, $393,531 Fire Alarm and
Detection, $239,258 Special needs, $11,720
TOTAL: $644,509
Exterior Doors, $45,884 Interior Doors, $170,139 Fittings, $638,022 Wall Finishes, $393,531 Floor Finishes, $340,278Fire Alarm and Detection,
$239,258
Special needs, $11,720
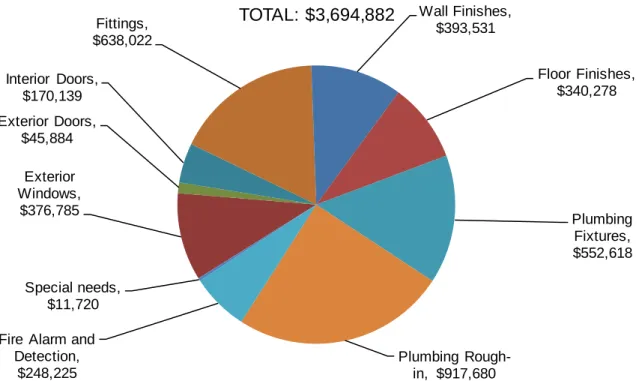
Figure 12. Cumulative projected Cost of Expired Systems (2023) – Barton Creek Elementary School
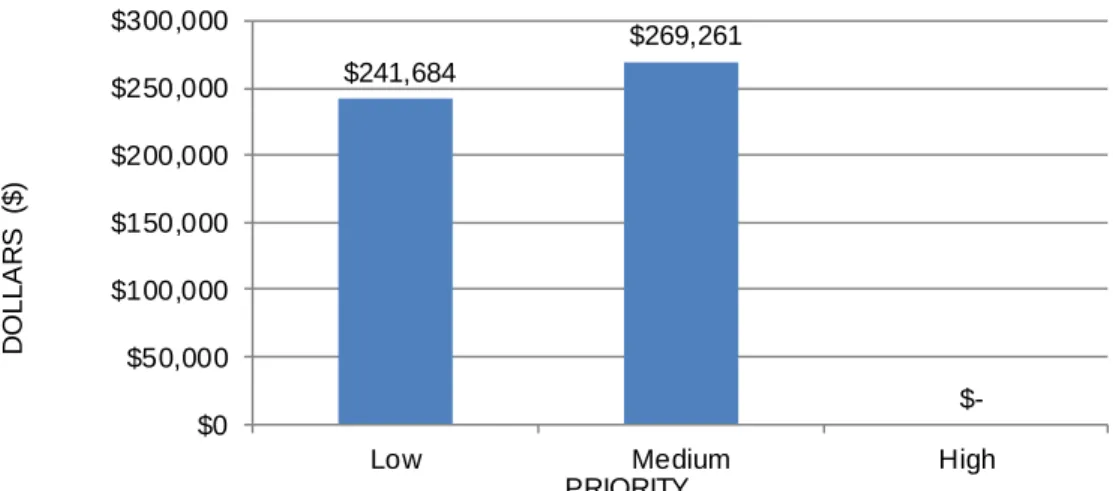
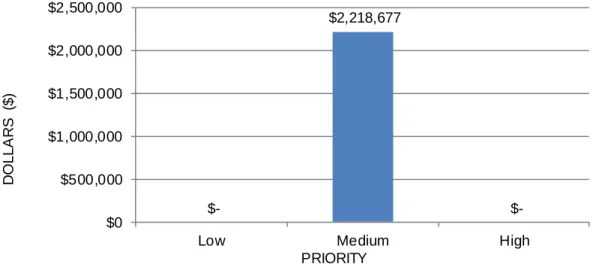
PlanningDirect allows the grouping of needs by their level of urgency. In order to group needs, a
priority of High, Medium or Low is assigned. The figure below shows the facilities needs
grouped by priority on a current (2013), 5 year (2018) and 10-year forecast (2023).
Figure 13. Current (2013) Needs By Priority – Barton Creek Elementary School
Exterior Windows, $376,785 Exterior Doors, $45,884 Interior Doors, $170,139 Fittings, $638,022 Wall Finishes, $393,531 Floor Finishes, $340,278 Plumbing Fixtures, $552,618 Plumbing Rough-in, $917,680 Fire Alarm and
Detection, $248,225 Special needs, $11,720
TOTAL: $3,694,882
$11,570 $632,939 $-$0 $100,000 $200,000 $300,000 $400,000 $500,000 $600,000 $700,000Low Medium High
DO L L A RS ( $ ) PRIORITY
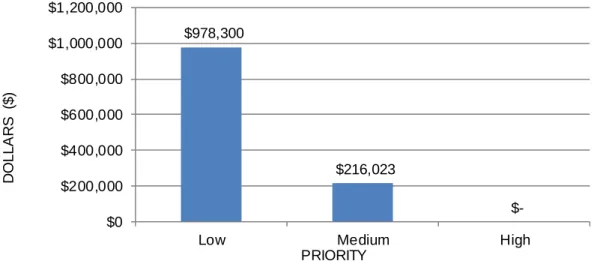
Figure 14. Extended (2018) Needs By Priority – Barton Creek Elementary School
Figure 15. Extended (2023) Needs By Priority – Barton Creek Elementary School
$978,300 $216,023 $-$0 $200,000 $400,000 $600,000 $800,000 $1,000,000 $1,200,000
Low Medium High
DO L L A RS ( $ ) PRIORITY $917,680 $938,370 $-$0 $100,000 $200,000 $300,000 $400,000 $500,000 $600,000 $700,000 $800,000 $900,000 $1,000,000
Low Medium High
DO L L A RS ($ ) PRIORITY
Renewal Forecast
The renewal forecast for Barton Creek Elementary School shown in the following figures
describes the current maintenance, repair backlog, and projected facility sustainment
requirements over the next 10 years. Please note the renewal forecast does not include
potential costs associated with hazardous material inspection, evaluation, and mitigation
including asbestos abatement, NFPA 101, ADA upgrades, or other escalation costs like inflation
or market conditions.
Figure 16. Renewal Forecast – Barton Creek Elementary School
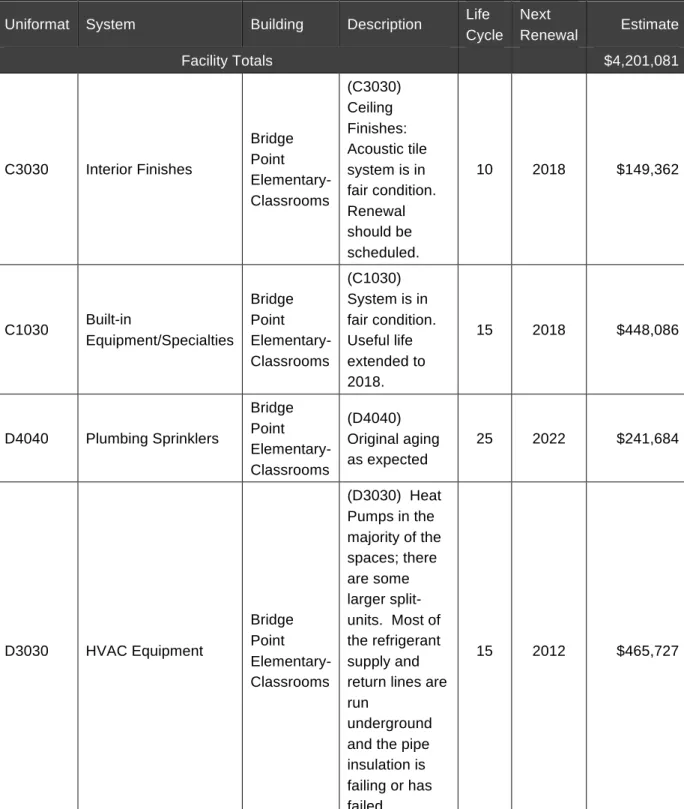
Forecasted Needs Table
Forecasted needs describes the expiration of an entire system based on the age and condition
of that system, such as an HVAC system that may still be functioning adequately, though it is
beyond its deign life. The table, “Forecasted Needs: Summarized by System”, illustrated in the
figure below, provides renewal costs information for the District organized by building systems
and reporting periods.
$644,509 $ - -$ -$ -$ $1,194,323 $ - -$ $1,847,083 $8,967 -$ $200,000 $400,000 $600,000 $800,000 $1,000,000 $1,200,000 $1,400,000 $1,600,000 $1,800,000 $2,000,000 2013 2014 2015 2016 2017 2018 2019 2020 2021 2022 2023 DO L L A RS ( $ ) REPORTING PERIOD
Table 8. Forecasted Needs Table Barton Creek Elementary School Uniformat System 2013 ($) 2018 ($) 2023 ($) Facility Totals $632,789 $1,194,323 $1,856,050 B20 Building Exterior $- $45,884 $376,785 B2010 Exterior Walls $- $- $- B2020 Exterior Windows $- $- $376,785 B2030 Exterior Doors $- $45,884 $- B30 Roofing $- $- $- B3010 Roof Coverings $- $- $- C10 Interior Construction $- $808,161 $- C1020 Interior Doors $- $170,139 $- C1030 Fittings $- $638,022 $- C30 Interior Finishes $393,531 $340,278 $- C3010 Wall Finishes $393,531 $- $- C3020 Floor Finishes $- $340,278 $- C3030 Ceiling Finishes $- $- $- D10 Conveying Systems $- $- $-
D1010 Elevators & Lifts $- $- $-
D20 Plumbing $- $- $1,470,298
D2010 Plumbing Fixtures $- $- $552,618
D2020 Plumbing Rough-in $- $- $917,680
D30 HVAC $- $- $-
D3020 Heat Generating Systems $- $- $-
D3030 Cooling Generating Systems $- $- $-
D3040 Distribution System $- $- $-
D3060 Controls & Instrumentation $- $- $-
D40 Fire Protection $239,258 $- $8,967
D4010 Fire Alarm & Detection $239,258 $- $8,967
D4040 Fire Sprinklers $- $- $- D50 Electrical $- $- $- D5010 Electrical Equipment $- $- $- D5020(01) Wiring $- $- $- D5090(02) Lighting $- $- $- D5091 Emergency Lighting $- $- $- D5092 Exit Signage $- $- $-
The following table shows present and forecasted needs, both systems generated and
individual needs.
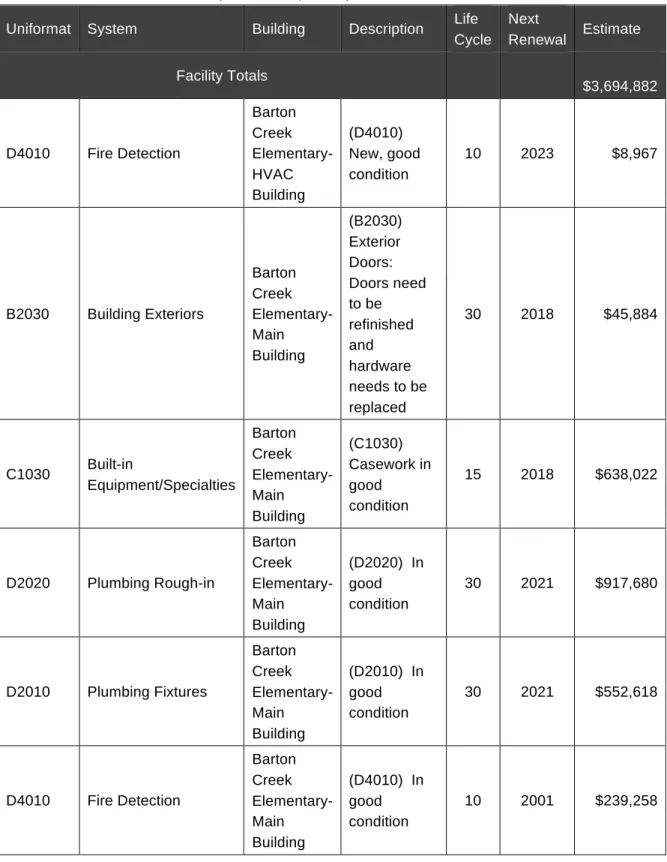
Table 9. Barton Creek Elementary School Expired Systems – 10 Year look ahead
Uniformat System Building Description Life Cycle Next Renewal Estimate Facility Totals $3,694,882 D4010 Fire Detection Barton Creek Elementary-HVAC Building (D4010) New, good condition 10 2023 $8,967 B2030 Building Exteriors Barton Creek Elementary-Main Building (B2030) Exterior Doors: Doors need to be refinished and hardware needs to be replaced 30 2018 $45,884 C1030 Built-in Equipment/Specialties Barton Creek Elementary-Main Building (C1030) Casework in good condition 15 2018 $638,022 D2020 Plumbing Rough-in Barton Creek Elementary-Main Building (D2020) In good condition 30 2021 $917,680 D2010 Plumbing Fixtures Barton Creek Elementary-Main Building (D2010) In good condition 30 2021 $552,618 D4010 Fire Detection Barton Creek Elementary-Main Building (D4010) In good condition 10 2001 $239,258
Uniformat System Building Description Life Cycle Next Renewal Estimate B2020 Building Exteriors Barton Creek Elementary-Main Building (B2020) Exterior Windows: Original, single paned and in good condition. Potential for energy savings 30 2021 $376,785 C1020 Interior Finishes Barton Creek Elementary-Main Building (C1020) Interior Doors: Interior doors in 300 wing are delaminating, need to be refinished. Entire system is expired. 20 2018 $170,139 C3010 Interior Finishes Barton Creek Elementary-Main Building (C3010) Interior Walls: Corridors need paint 5 1996 $393,531 C3020 Interior Finishes Barton Creek Elementary-Main Building (C3020) Floor Finishes: Floors in good condition 15 2018 $340,278 S1000 Special Need Barton Creek Elementary-Main Building (S1000) Room 435 has stained/ worn carpet that need to be replaced. 0 2013 $2,820
Uniformat System Building Description Life Cycle Next Renewal Estimate S1000 Special Need Barton Creek Elementary-Main Building (S1000) Room 116 needs heat sensor installed properly. 0 2013 $150 S1000 Special Need Barton Creek Elementary-Main Building (S1000) Stucco and cinder block portions of the exterior finish need to be repainted. 0 2013 $8,750
BRIDGE POINT ELEMENTARY SCHOOL
Assessment Findings
Size (SF) 94,230 Date of construction 1997 Type of ConstructionOne and Two Story Masonry Structures
Roof Standing Seam and Modified
Bitumen
Ceilings Acoustical Tile
Lighting Surface-Mounted and Lay-In
Fluorescent Fixtures Additions/
Renovations N/A
HVAC Heat pumps and Split Units with Gas Heat
Condition Summary
Bridge Point Elementary campus is overall in fair condition. Multiple major building systems are
nearing the end of their life cycle or have reached the end and are not performing as designed;
replacement is recommended and should be scheduled.
Although upgrades have been observed, a majority of the minor building systems have expired
and are in need of replacement. Many of the systems are on the lower range of commercial
grade and are expiring at an accelerated rate. A fire egress study is recommended due to the
observations of exit lights not operating or incorrectly placed within the campus.
EXTERIORS
The windows are original and in fair-poor condition. Useful Life decreased from 30 years to 20
years. System does not appear to be commercial grade materials. System components such as
springs, slides, and mullions are failing and keeping a majority of the windows from closing or
operating correctly. This is a security concern, as well as an energy conservation concern. A
more energy efficient system should be scheduled for replacement. Refurbishment is
recommended for gaskets, painting on exterior doors, and metal handrails exterior and interior.
Exterior walls are split face CMU, which are original and in good condition. Caulking and
The roofing system was not assessed under this contract, nevertheless it was noted that the
flashings and gutters are in fair condition. A leaf guard system over the gutters is recommended,
due to the amount of trees in the area.
INTERIORS
Overall interior finishes are in good condition and well maintained. The food preparation and
serving area is the most deteriorated and should be scheduled for refurbishment sooner than
the other areas of the campus.
Floor finishes are a combination of carpet and VCT tiles. System is in fair condition with the only
current renewal being in the Gymnasium in 2012 approximately 5000 square feet. The VCT and
carpet flooring is expired and in need of replacement due to condition and age.
The wall and ceiling finishes are in fair-good condition with wall finishes requiring renewal. The
24”x24” acoustic ceiling tiles throughout the campus are nearing the end of their useful life and
should be scheduled for replacement.
Interior doors are in good working condition, but cosmetically are in fair-poor condition. Manual
doors stops have chipped and damaged over 50% of the doors on campus. Metal door sweeps
or magnetic door catches are recommended.
MECHANICAL
The school uses heat pumps for the majority of the systems. Most of the HVAC components
are original; except for the heat pump for the Cafeteria. The supply and return lines from the
condenser have deteriorated insulation and are at the end of their useful life. Staff personnel
report that the temperature in classrooms is very warm even when units are on high cool.
ELECTRICAL
The majority of the lighting is original; however, the fixtures were updated with electronic ballast
and T8 bulbs. New lighting was installed in the gymnasium. Many Exit signs are beyond their
expected useful life.
PLUMBING
Plumbing fixtures and piping are original and are in good condition. No leaks were reported or
observed.
Cost Summary
The following table contains information regarding current and forecasted FCI and Q-ratings.
Table 10. Bridge Point Elementary School Summary of Assessment Findings.
A summary of the physical condition assessment findings at Bridge Point Elementary School is
shown below. The figures below depict the distribution of systems currently beyond useful
service life and systems that are expected to be beyond useful service life by the year 2018 and
2023, respectively.
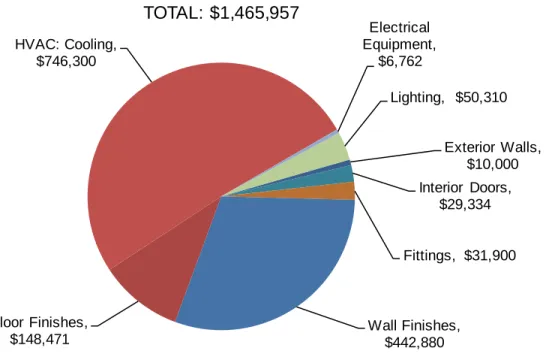
Figure 17. Current Needs (2013) – Cedar Creek Elementary School
Bridge Point Elementary 1997 16 94,230 91 Q1 76 Q3 73 Q3 $15,076,800 CRV 2018 FCI % 2023 FCI % Q-Rating Q-Rating Name Year
Built Age Area
2013 FCI % Q-Rating Exterior Walls, $10,000 Interior Doors, $29,334 Fittings, $31,900 Wall Finishes, $442,880 Floor Finishes, $148,471 HVAC: Cooling, $746,300 Electrical Equipment, $6,762 Lighting, $50,310
TOTAL: $1,465,957
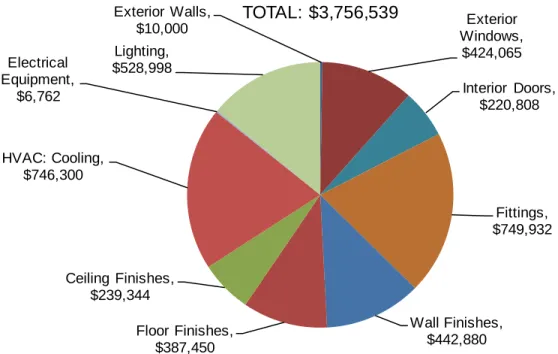
Figure 18. Cumulative projected Cost of Expired Systems (2018) – Cedar Creek Elementary School
Figure 19. Cumulative projected Cost of Expired Systems (2023) – Cedar Creek Elementary School
Exterior Walls, $10,000 Windows, Exterior $424,065 Interior Doors, $220,808 Fittings, $749,932 Wall Finishes, $442,880 Floor Finishes, $387,450 Ceiling Finishes, $239,344 HVAC: Cooling, $746,300 Electrical Equipment, $6,762 Lighting, $528,998
TOTAL: $3,756,539
Exterior Walls, $10,000 Exterior Windows, $424,065 Interior Doors, $220,808 Fittings, $749,932 Wall Finishes, $442,880 Floor Finishes, $387,450 Ceiling Finishes, $239,344 HVAC: Cooling, $746,300Fire Alarm and Detection, $269,261 Fire Sprinklers, $241,684 Electrical Equipment, $6,762 Lighting, $528,998