Very Fast Similarity Queries on
Semi-Structured Data from the Web
Bhavana Dalvi
School of Computer Science
Carnegie Mellon University
[email protected]
William W. Cohen
School of Computer Science
Carnegie Mellon University
[email protected]
Abstract
In this paper, we propose a single low-dimensional represen-tation for entities found in different datasets on the web. Our proposed PIC-D embeddings can represent large D-partite graphs using small number of dimensions enabling fast sim-ilarity queries. Our experiments show that this representation can be constructed in small amount of time (linear in number of dimensions). We demonstrate how it can be used for vari-ety of similarity queries like set expansion, automatic set in-stance acquisition, and column classification. Our approach results in comparable precision with respect to task specific baselines and up to two orders of magnitude improvement in terms of query response time.
1 Introduction
On the web, many entities are mentioned many times, in many contexts. In particular, many entities appear frequently
in hyponym patterns or “Hearst patterns” [8] (e.g., “cities
such as New York”, or more abstractly, “concept such as
entity”) and also in semi-structured web pages that can be easily parsed into tables and lists. In past work, hyponym and table data about entities has been used to address a number of distinct tasks, such as fact extraction (e.g., [5]), semi-supervised learning (e.g., [14, 3]), set expansion (e.g., [19]), determining the type of columns in tables (e.g., [9]), and automatic set instance acquisition (e.g., [18]).
However, existing methods to solve these tasks make quite different use of the underlying data: for instance, SEAL [19] performs set expansion by performing web queries and recognizing “wrappers” for semi-structured pages and merg-ing the results on-the-fly, while WebTables [2] uses a pre-computed collection of tables with header information to perform schema auto-completion. Label propagation meth-ods like MAD [14] can address multiple such tasks using the same graph based representation, but results in huge query response times. Having diverse methods for processing web data, with diverse storage and access requirements, can lead to unnecessary inefficiencies and complexities.
Let us consider a scenario where there is a large set
of entitiesx1, . . . , xn, small numbermof them are labeled
(x1, y1), . . . ,(xm, ym). We haveDdifferent datasets which
has co-occurrence information aboutxi’s. Some examples
of such datasets are co-occurrence of entities in HTML table columns on the Web pages, occurrences of entities in the free text around Hearst patterns [8], occurrences of
entities as Subject-Verb-Object triples etc. Our focus is
on representing this high-dimensional data about entities in a low dimensional representation so that, many similarity queries can be efficiently executed against this presentation. Consider following three tasks:
1. Set Expansion (SE) [19]: Here the query is a set of
seed entities{x1, . . . , xs} of a single classy, and the
task is to return a larger set of entities from the same class (e.g., given a set of three seed baseball teams, find more teams from the same league.)
2. Concept name expansion, or “automatic set instance acquisition” (ASIA) [18]: Here the query is a single class name (e.g., “baseball teams”). The task is to return a set of instances of that concept.
3. Column Classification (COL-CLASS) [9]: Here
again we have a set of seed examples and unlabeled ex-amples. The task is to learn a classifier that can predict
the class labelycfor an unlabeled table columncwhere
cis a set of examplesc={x1, . . . , xc}.
Note thatxi’s mentioned here are entities, and the above
mentioned tasks can be considered as similarity queries because they rely on putting similar entities closer to each
other in the data space. Our hypothesis is that If we can
learn a low dimensional data representation in which entities belonging to the same concept are together, we can solve the above mentioned tasks efficiently operating in this low dimensional space.
Contributions of this paper are as follows : (1) We pro-pose a low-dimensional representation (henceforth referred to as the PIC-D representation) and handle the distinct tasks listed above as similarity queries to be executed against
this representation. (2) Further we demonstrate that the
PIC-D representation can be created very quickly, in time linearly proportional to the total number of dimensions in the dataset. Once this pre-processing is done, queries run much faster in the lower-dimensional space. (3) We compare our proposed approach with baseline approaches like similarity queries over the original high-dimensional space and state of the art label propagation techniques [14].
We are interested in representing the data extracted from the web, hence we consider three representations that can be constructed efficiently for very large datasets. One such scheme is to represent each entity as a sparse vector of all its occurrences in all datasets. Another potential scheme is a graph, in which entities along with all features are nodes and edges represent co-occurrence of entities with features. Finally, we consider our proposed PIC-D representation for this graph, which internally uses an efficient network clustering method called Power Iteration Clustering [11].
To demonstrate our representation, we use hyponym and semi-structured occurrence data from the web, and represent it as a tri-partite graph. Our experiments show that this representation is generally preferable to other methods, especially with respect to performance at query time (12x to 240x faster than the sparse representation and 65x to 300x faster when compared to state of the art label propagation technique [14]) at the expense of modest pre-processing time (around 365 msec. for a graph with half a million edges).
Below, Section 2 describes our low-dimensional repre-sentation named PIC-D reprerepre-sentation. Then Section 3 dis-cusses how can we make sure that the PIC-D is a reason-able representation of the underlying data. Section 4 demon-strates the use of this representation for the previously men-tioned similarity queries. Experimental results on various semi-structured datasets are described in Section 5, Section 6 discusses previous work in this research area, and finally we present our conclusions in Section 7.
2 ThePIC-DRepresentation
We propose a low-dimensional representation for entities based on the embedding internally used by the PIC algorithm [11]. Briefly, PIC assigns each node in a graph an initial random numeric value, and then performs an iterative update which brings together the values assigned to nearby nodes, thus producing a one-dimensional embedding of a graph.
Algorithm 1 describes the procedure of creating the
PIC-D representation for a(D+ 1)-partite graph containing
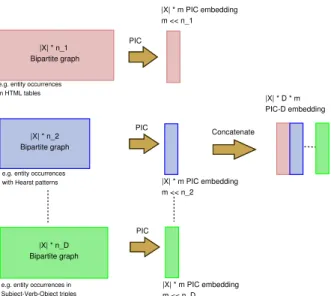
entity occurrences in D different datasets. Figure 1 shows
the schematic diagram of intermediate matrices while
cre-ating this embedding. Specifically, we start with m
ran-dom vectors to generatem-dimensional PIC embedding for
each bi-partite graph corresponding to each dataset. Since
we haveDsuch bipartite graphs, we create embeddings for
each of them separately and final PIC-D embedding is the concatenation of these individual embeddings. (See Section
1: functionCreate PIC-D Embedding(m,X, X1, X2,... XD): XPIC-D
2: Input:m: Number of PIC dimensions per dataset
X: Set of all entities,
X1: Co-occurrence ofXindataset1,
X2: Co-occurrence ofXindataset2, ....
XD: Co-occurrence ofXindatasetD,
3: Output:XPIC-D:(|X|, D∗m)dim. embedding ofX.
4: XPIC-D =φ
5: t= a small positive integer
6: fori = 1: Ddo
7: forj = 1: mdo
8: V0= randomly initialized vector of size|X| ∗1
9: Vt=PIC Embedding(Xi,V0,t)
10: AppendVtas a new columnXPIC-D
11: end for
12: end for
13: end function
Algorithm 1:Create PIC-D embedding
5.2 gives some insights on how to choose a right value ofm).
We have experimented with a version of this algorithm in which we create PIC embeddings of the data by con-catenating the dimensions first instead of computing sepa-rate embeddings and later concatenating them. We observed that the version showed in Algorithm 1 performs as good as or better than its variant. Further, PIC is proved to be equivalent to computing diffusion maps followed by random projection of points in a one dimensional space ([10] Sec-tion 3.6). Instead PIC-D representaSec-tion can be considered
as random projection inm∗Ddimensional space.
We use Algorithm 1 to produce a low-dimensional em-bedding of a tripartite graph, in particular the data graph of Figure 2 (a). This tri-partite graph is populated using entity-tableColumn co-occurrence dataset and Hyponym Concept dataset published by Dalvi et al.[5]. Each edge derived from the entity-tableColumn dataset links an entity name with an identifier for a table column in which the entity name appeared. Each edge derived from the Hyponym Concept Dataset links an entity X and a concept Y with which it ap-peared in the context of a Hearst pattern (weighted by fre-quency in a large web corpus). We combine these edges to form a tripartite graph, as shown in Figure 2 (a). Oc-currences of entities with hyponym (or “such as”) concepts form a bipartite graph on the left, and occurrences of enti-ties in various table-columns form the bipartite graph on the right. Our hypothesis is that entities co-occurring in multi-ple table columns and/or with similar suchas concepts might belong to the same class label.
Here we have two bipartite graphs, entity-tableColumn and entity-suchasConcept. We create bipartite PIC embed-dings for each of these in turn (retaining only the part of the embedding relevant to the entities). The embedding for
(a) Example Tri-partite Graph (b) Example PIC-D representation (m=2) Figure 2: Example PIC-D embeddings
|X| * n_1 Bipartite graph |X| * n_2 Bipartite graph PIC PIC |X| * m PIC embedding m << n_1 |X| * m PIC embedding m << n_2 Concatenate |X| * D * m PIC-D embedding |X| * n_D Bipartite graph PIC |X| * m PIC embedding m << n_D
e.g. entity occurrences in HTML tables
e.g. entity occurrences with Hearst patterns
e.g. entity occurrences in Subject-Verb-Object triples
Figure 1: Schematic diagram of intermediate matrices,
where|X|: number of entities, ni: number of dimensions
inDataseti, n: total number of dimensions (n = Pini),
and m: number of PIC dimensions per bipartite graph.
ties is then the concatenation of these separate embeddings. Our hypothesis is that these embeddings will cluster similar entities together. Figure 2 (b) shows an example
PIC-D embedding of the tri-partite graph withd = 2 and
m = 2. Columns X1 and X2 denote the PIC
embed-dings corresponding to entity-tableColumn bipartite graph, while Y1 and Y2 represent the embeddings corresponding to entity-suchas bipartite graph. In the next section, we will discuss how to evaluate whether the PIC-D embeddings are reasonable.
3 Is thePIC-Drepresentation reasonable?
We would like the PIC-D representation to capture the prop-erties of the underlying dataset, so that similar entities (be-longing to the same concept) are put closer to each other in the new low-dimensional space. In this section we will dis-cuss how to tune the parameters of Algorithm 1 to generate a reasonable PIC-D representation.
Parameter Tuning There are two parameters in
Algo-rithm 1 (1) t: number of iterations of PIC algorithm and
(2) m: number of dimensions of the PIC-D embedding.
We set t to a small number (say 5) to generate
indepen-dent embeddings starting with different random
initializa-tion vectors. We then note that the effectiveness of the
PIC-D representation depends on parameterm.
We use semi-supervised learning task to measure the ef-fectiveness of the PIC-D representation. Here the query is a
small set of labeled “seed” examples(x1, y1), . . . ,(xm, ym)
and many unlabeled instancesxm+1, . . . , xn. The task is to
label the unlabeled instances accurately with labelsy (i.e.,
we assume a transductive setting [14].)
To use the PIC-D representation for this task, we sim-ply learn a linear classifier in the embedded space. In Sec-tion 5.2, we experiment with various datasets to find the
relation between ideal value of mfor a given dataset with
n number of dimensions. We also note that SSL task is
much more effective (precision on test data) with the use of PIC-D representation than applying graph-based iterative semi-supervised learning methods [14].
4 Similarity Queries onPIC-D
In this section we will see how the PIC-D representation
for entities can be used for different tasks. In general,
our algorithms exploit the property that semantically similar entities are nearby (with respect to Euclidean distance) in the PIC-D space. In the experimental section, we will also discuss baseline approaches to solving each of these tasks using the other representations.
4.1 Set Expansion Set expansion refers to the problem of expanding a set of “seed” entities into a larger set of entities of the same type. Algorithm 2 formally describes how to perform set expansion with the PIC-D representation. Given a set of query entities, the algorithm computes their centroid
in PIC-D space. k nearest neighbors are then found by
measuring distances from the centroid using a KD-tree. At the end we apply Otsu’s threshold the ranked list of entities to get optimal set expansion for a given set of seed entities.
In some prior set expansion papers, the result of set expansion was evaluated as a ranked list [17]; however, here we apply Otsu’s thresholding algorithm [13] to select the correct number of results for each query from a large ranked list, following He and Xin [7]. In our experiments we
threshold an ranked initial list ofk=200 entities. Again, this
approach is quite efficient at query time; prior approaches such as SEAL [19] ranked nodes using random-walk-with-restart methods within a graph it built on-the-fly at set expansion time using queries to the web.
1: functionExpand Set(Q,XP IC):Q0
2: Input:Q: seed entities for set expansion,
XP IC: low dimensional PIC-D embedding ofE
3: Output:Q0: Expanded entity set
4: xQ=XP IC(row,:),row∈Q
5: xcentroid=centroid(xQ)
6: k= a large positive number
7: [Qk, Scorek]= Find-K-NearestNbr(xcentroid,XP IC,k)
8: Q0= Apply-Otsu-Threshold(Qk,Scorek)
9: end function
Algorithm 2:Set Expansion with K-NN on PIC-D
4.2 Automatic Set Instance Acquisition (ASIA) This
task takes as input the name of a semantic class (e.g.,“countries”) and automatically outputs its instances (e.g., “USA”, “India”, “China” etc.). As described in Al-gorithm 3, we look up instances of the given class in the hyponym dataset, and then perform set expansion on these -a process -an-alogous to th-at used in -a prior work [18]. Here, however, we again use Algorithm 2 for set expansion in the PIC space created using only entity-tableColumn bipartite graph. The entity-suchasConcept data is used only to find
seeds for a particular classY. Again this method requires
minimal resources at query time.
1: functionSet Instance Acquisition(ys,XP IC):Xys
2: Input:ys: class name (one of suchas concepts), XP IC: low dimensional PIC-D embedding ofE
3: Output:Xys: Entity set belonging to conceptys
4: numSeeds= a small positive number
5: seeds= topnumSeedsentities that occur withysin Hyponym
Concept Dataset
6: Xys=Expand Set(seeds,XP IC)
7: end function
Algorithm 3:ASIA on PIC-D
4.3 Column Classification Column classification is sim-ilar to using SSL for entity classification, except that our sys-tem is tested by finding a class label for an entire column of a table—a column which contains entities of the same (un-known) type. This operation is useful in many contexts— e.g., in schema integration, or in indexing semi-structured web pages with relevant terms for retrieval.
Algorithm 4 describes our approach. SVM classifiers are learned as in the SSL learning case for each class
of interest. Given a novel column c = {x1, . . . , xk},
the PIC-D representation is retrieved for each entity xi.
Note that some entities may not correspond to nodes in the original tripartite graph; these entities are simply ignored.
To classify column c, we find the centroid of all the xi’s
that are represented in the PIC-D space, and classify that centroid with the SVM classifier. This is a very inexpensive operation, since SVM uses linear classifier.
In the experiments we compare this approach to per-forming SVM classification in the original space. In addition to classifying the centroid of the examples, we also consider taking the majority classification.
1: functionClassify Table Column(c,XP IC,svm model):Yc
2: Input:c: Query Table Column (Set of entities),
XP IC: Low dimensional PIC-D embedding ofE, svm model: SVM classifier trained on a fraction ofXP IC
3: Output:Yc: Class label ofc
4: xc=XP IC(row,:),row∈c
5: xcentroid=centroid(xc)
6: Yc= predict(svm model,xcentroid)
7: end function
Algorithm 4:Column Classification using PIC-D Table 1 shows the summary of all tasks
be-ing represented as a set of simple operations on
PIC-D representation:
5 Experiments
In this section we evaluate the performance of the PIC-D representation on publicly available and extensively labeled datasets described in Section 5.1. Then in Section 5.2 we will evaluate whether the PIC-D representation is
Task Training Testing
SE PIC-D Centroid(entity-set) + K-NN(centroid)
ASIA
PIC-D + Index HCD
seeds = top-k-entities( lookup concept in HCD) + SE(seeds)
COL-CLASS
PIC-D +
Train SVM centroid(column) + Predict SVM(centroid)
Table 1: Summary of tasks
Dataset Toy Delicious ASIA Clueweb
Apple Sports INT Sports
# HTML pages 574 21K 121K 918K |X|: # entities 14,996 438 14,906 30,382 |C|: # table-columns 156 925 8,087 78,423 |(x, c)|: #(x, c)edges 70,551 5,546 90,902 566,080 |Ys|: # suchas concepts 2348 1649 3,868 21,454 |(x, Ys)|: #(x, Ys)edges 7683 4799 18,345 107,810 |Yn|: # NELL Classes 11 3 23 23 |(x, Yn)|: #(x, Yn)pairs 419 39 691 977
|Yc|: # manual column labels 31 30 -
-(c, Yc): #(c, Yc)pairs 156 925 -
-Table 2: Datasets Statistics
scalable in terms of pre-processing time and is it a reason-able representation of the original dataset. Next we will go through evaluation of similarity queries like Set expansion, ASIA and column classification in Sections 5.3, 5.4 and 5.5 resp. executed on the PIC-D representation.
5.1 Datasets We use the Toy Apple, Delicious Sports, ASIA INT, Clueweb Sports and Hyponym Concept datasets made publicly available by [5]. Table 2 shows the statistics of
these datasets. Numbers for|Ys|and|(x, Ys)|are derived
us-ing the Hyponym Concept Dataset. Further we use an exist-ing knowledge base NELL [3] for retrievexist-ing seed examples for a set of concepts to be used in semi-supervised
learn-ing. Statistics regarding this data are represented as|Yn|and
|(x, Yn)|. To do a quantitative evaluation on multiple tasks,
we manually labeled the table columns from Toy Apple and
Delicious Sports datasets, denoted by|Yc|and|(c, Yc)|.
5.2 PIC-Dembeddings Here we will first go through the
pre-processing times for creating PIC-D embeddings. Next we will see how to tune the number of dimensions in
PIC-D (parametermfrom the Algorithm 1). Finally we will
evaluate whether PIC-D embeddings are reasonable based on their performance on a semi-supervised learning task.
Dataset Toy Delicious ASIA Clueweb Apple Sports INT Sports # edges 78,234 10,345 109,247 673,890
n: # total dimensions 2,504 2,574 11,955 99,877
m=√n 51 51 110 317
Total time to create
PIC-D embedding (msec) 49.7 53 69.7630 365.2 Avg. time per
PIC embedding (msec) 0.487 0.0520 0.3171 0.0576 Table 3: Time statistics for PIC-D embeddings
0 2 4 6 8 10 x 104 0 50 100 150 200 250 300 350 400
Total number of dimensions (n)
Time to create
PIC−D embedding (msec)
Toy_Apple Delicious_Sports
ASIA_INT
Clueweb_Sports
Figure 3: Time to create PIC-D for various dataset sizes
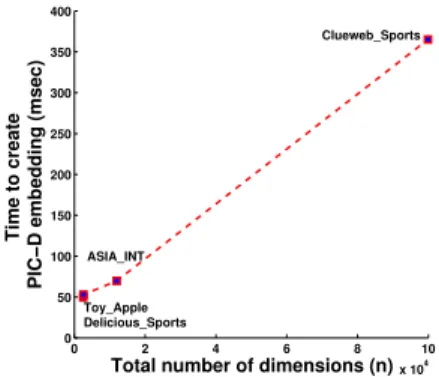
Scalability Here we evaluate the scalability of our data representation by recording the time taken to create the
PIC-D embeddings of four varying sized datasets.
Ta-ble 3 shows the statistics of all four datasets in terms of number of edges, number of dimensions, number
of PIC-D dimensions(m) and total time taken to create
PIC-D embeddings. The plot in Figure 3 shows that total time required to create PIC-D embeddings grows linearly with number of dimensions of the dataset.
How many dimensions (m) in PIC-D? We use
Semi-supervised learning (SSL) task as a way to evaluate the the effectiveness of the PIC-D representation. Carlson et al de-scribe NELL, a semi-supervised information extraction sys-tem for web data that works by using SSL to classify entity names found on the web [3]. We used a version of the NELL knowledge base to provide labels for entities in our datasets. To evaluate the PIC embeddings in terms of predicting these classes, we compared the performance of an SVM classi-fier on the PIC embeddings (named SVM+PIC-D) vs. the original high-dimensional dataset (named SVM-baseline); in SVM-baseline the hyponyms and table-columns associated with an entity are simply used as features. The number of
iterationstfor PIC were set tot= 5in these experiments.
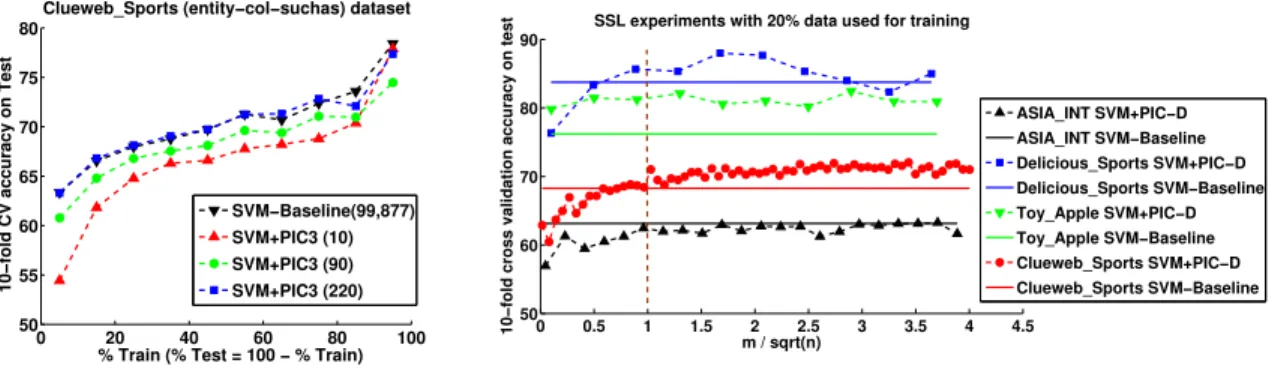
Algorithm 2 internally uses a parametermi.e. number
of PIC dimensions per bipartite graph. We study the SSL performance varying number of PIC dimensions on all four datasets. Figure 4 (a) shows the results on Delicious Sports dataset. We can see that as the number of PIC dimensions increase, performance of the classifier improves for various
values of training percentage and whenm = 110implying
total number of dimensions in the PIC-D representation are 220, the performance is very similar to SVM-Baseline.
Since SSL data is not always available, we performed
some experiments to determine how quicklymgrows with
the total number of dimensions n. Figure 4 (b) shows the
effect of varying m on all four datasets with 20% of the
training data available (and the remaining 80% as test). On
these datasets, whenm=√n, SVM+PIC-D performs
0 20 40 60 80 100 50 55 60 65 70 75 80
% Train (% Test = 100 − % Train)
10−fold CV accuracy on Test
Clueweb_Sports (entity−col−suchas) dataset
SVM−Baseline(99,877) SVM+PIC3 (10) SVM+PIC3 (90) SVM+PIC3 (220)
(a) Clueweb Sports: Varying #PIC dimensions
0 0.5 1 1.5 2 2.5 3 3.5 4 4.5 50 60 70 80 90 m / sqrt(n)
10−fold cross validation accuracy on test
SSL experiments with 20% data used for training
ASIA_INT SVM+PIC−D ASIA_INT SVM−Baseline Delicious_Sports SVM+PIC−D Delicious_Sports SVM−Baseline Toy_Apple SVM+PIC−D Toy_Apple SVM−Baseline Clueweb_Sports SVM+PIC−D Clueweb_Sports SVM−Baseline
(b) Choosing #PIC dimensions given a dataset Figure 4: SSL Task: PIC-D embeddings of varying sizes
0 20 40 60 80 100 0 20 40 60 80 100
% Train (% Test = 100 − % Train)
10−fold CV accuracy on Test
Toy_Apple (entity−col−suchas) dataset
SVM−Baseline (2504) SVM+PIC−D (102) MAD
(a) Toy Apple dataset
0 20 40 60 80 100 20 40 60 80 100
% Train (% Test = 100 − % Train)
10−fold CV accuracy on Test
Clueweb_Sports (entity−col−suchas) dataset
SVM−Baseline (99,877) SVM+PIC−D (634) MAD
(b) Clueweb Sports dataset
Figure 5: SSL Task: Comparison of all 3 methods parable to or better than SVM-Baseline. In all further
ex-periments, therefore, we set m = √n. To make sure that
the embeddings are distinct from each other, we computed the rank of the PIC-D embeddings and compared it against maximum possible rank of the embeddings. We found that
for embeddings of size m = √n, rank of the embedding
equals the maximum possible rank, hence ensuring the dis-tinct values in the embeddings.
Semi-Supervised Learning with tuned parameter (m)
Henceforth we always pick m = √n, where n is the
total number of dimensions in the dataset. Now let
us see with this fixed value of m, how effective the
PIC-D representation is on the task of Semi-Supervised Learning. Figure 5 shows the plot of accuracy vs.
train-ing size for Toy Apple and Clueweb Sports datasets. We can see that SVM+PIC-D performs better than baseline with less training data, hence is better in SSL scenarios. Both these methods perform better than MAD for small training size. We observed very similar results for ASIA INT and Delicious Sports datasets, SVM+PIC-D method being com-parable or better than SVM-Baseline, and better than MAD (plots omitted due to space constraints).
Also note that the PIC-D embedding reduces the num-ber of dimensions to square root of actual numnum-ber of dimen-sions. In these experiments, we use 10-fold cross validation
for all training set sizes by randomly samplingx% of
train-ing data in each fold. Note that when we say traintrain-ing
per-centage =x, we samplex% of data per class label. Hence
we can say that the PIC-D representation is reasonable for these datasets and it can represent the underlying class-label distribution in small number of dimensions.
5.3 Set Expansion We manually labeled every table col-umn from Delicious Sports and Toy Apple datasets. These
labels are referred to asYcin Table 2. This also gives us
la-bels for the entities residing in these table-columns. For this task we construct queries which contain all entities from a
single table columnc, and use labelycassigned to columnc
to evaluate correctness. (All columnscof Delicious Sports
and Toy Apple datasets are manually labeled.)
One baseline approach runs K-Nearest Neighbor on the original high-dimensional dataset (referred to as K-NN-Baseline). We also consider a use of MAD for this task, which is described below.
5.3.1 Unsupervised Modified Adsorption (MAD) for Set Expansion SEAL [19] performs set expansion by perform-ing web queries, recognizperform-ing “wrappers” for semi-structured pages, building a graph similar to the entity-tableColumn portion of our graph, and then ranking nodes in the graph using a simple label propagation technique. Inspired by this approach, we adapted the MAD algorithm [14], a state-of-the art semi-supervised learning method, to state-of-the set expansion
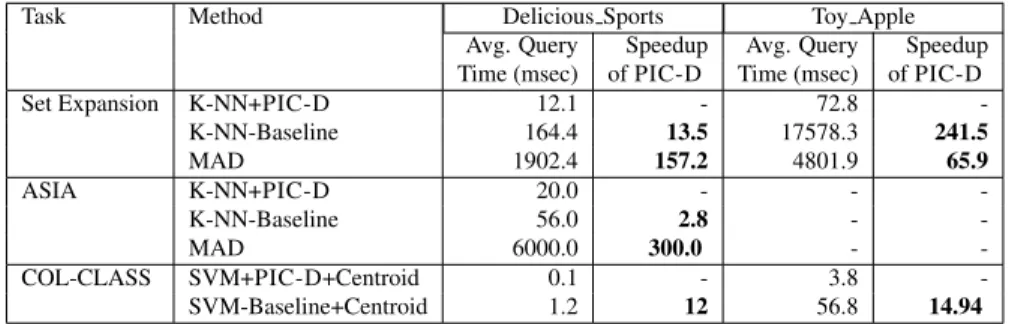
Task Method Delicious Sports Toy Apple Avg. Query Speedup Avg. Query Speedup Time (msec) of PIC-D Time (msec) of PIC-D
Set Expansion K-NN+PIC-D 12.1 - 72.8
-K-NN-Baseline 164.4 13.5 17578.3 241.5 MAD 1902.4 157.2 4801.9 65.9 ASIA K-NN+PIC-D 20.0 - - -K-NN-Baseline 56.0 2.8 - -MAD 6000.0 300.0 - -COL-CLASS SVM+PIC-D+Centroid 0.1 - 3.8 -SVM-Baseline+Centroid 1.2 12 56.8 14.94
Table 4: Comparison of query times
task. Following Talukdar et al. [15], we adapt MAD for un-supervised learning by associating each table-column node with its own id as a label, and propagating these labels to other table-columns. MAD also includes a “dummy label”,
so after propagation every table-columnTq will be labeled
with a weighted set of table-column idsTs1, ...Tsn
(includ-ing its own id), and a weight for the “dummy label”. We denote MAD’s weight for associating table-column
idTs with table columnTq as P(Ts|Tq), and consider the
idsTs1, ...Tskwith a weight higher than the dummy label’s
weight. We consider e1, e2, ... en, the union of entities
present in columnsTs1...Tsk, and rank them in descending
order score, wherescore(ei, Tq) =Pj:ei∈Tsj P(Tsj|Tq).
5.3.2 Comparison of Various Methods Table 4 presents the running time results for all three methods on 272 set expansion queries from Delicious Sports dataset and 152 queries on Toy Apple dataset. K-NN+PIC-D method incurs a small amount of pre-processing time (0.053 and 0.487 sec.) to create embeddings and compared to other two methods it is very fast at the query time. The numbers show average query times for both the datasets. Note the speedup numbers for K-NN+PIC-D method, indicating the speedup of 13x to 240x over K-NN-Baseline and 65x to 150x over MAD. Thus the PIC-D representation results in very fast execution of similarity queries.
Next we compare the three methods in terms of preci-sion and recall of set expanpreci-sion. Figure 6(a) shows the ag-gregate Precision-Recall curves for all 3 methods on the Set Expansion task on Delicious Sports dataset. The 272 queries that we executed belong to 12 different column-labels. We first aggregate the precision values of all queries in a single class, and Figure 6(a) shows the plots of macro-averaging these precision recall curves across 12 classes. We can see that MAD algorithm performs the best in terms of preci-sion recall curve, at the expense of drastic increase in run time of queries (Table 4). K-NN+PIC-D produce compara-ble results to K-NN-Baseline along with the speedup at query time. Table 5 shows some example queries and results pro-duced by K-NN+PIC-D method on Clueweb Sports dataset.
Seed Entities: Expanded entity set by K-NN+PIC-D method
Arsenal, Liverpool, Manchester United: Middlesbrough, Man United, Blackburn Rovers, Manchester City, Tottenham, West Brom, Tottenham Hotspur, Bolton Wanderers, Newcastle United, Blackburn, Bolton, Birming-ham City, Aston Villa, Chelsea Fc, Sunderland, Sheffield United, Leicester City, Everton, Chelsea, Harlequins, ...
France, UK, Denmark: Brazil, Malaysia, Indonesia, Norway, Switzerland, Great Britain, Thailand, Finland, Argentina, Belgium, Romania, Korea, Germany, Austria, Chile, Lithuania, Senegal, ...
MSN, Google, Yahoo: Qas, Mitre, Cosco, Cerberus, Cdt, Garrett, Sporting-bet, Excelsior, Genzyme, Gt, Broad, Ge, Bruno, Nortel, Level 3, Nec, Foster, Renault, Ricardo, Persepolis, Coca Cola, Nike, ...
Penn State, Michigan, Princeton: Oklahoma State, Clemson, USC, Columbia, Michigan State, LSU, Dartmouth, Ohio State, Cambridge, Florida State, Wake Forest, Auburn, Vanderbilt, Duke, Hampshire, UCLA, Syracuse, Oxford, Pitt, North Carolina State, Mississippi State, ...
San Francisco, Seattle, Houston: Detroit, Philadelphia, Denver, Boston, Atlanta, Nashville, Minneapolis, New Orleans, San Diego, Dallas, Miami, Pittsburgh, Cincinnati, Los Angeles, Chicago, Oakland, Tampa, Cleveland, Portland, Tokyo, Des Moines, Kansas City, Charlotte, ...
Table 5:Set Expansion on Clueweb Sports Dataset
5.4 Automatic Set Instance Acquisition For the auto-matic set instance acquisition (ASIA) task, we use
concept-names from Hyponym Concept Dataset (Ys) as queries.
Sim-ilar to the Set Expansion task, we compare K-NN+PIC-D to the K-NN-Baseline and MAD methods.
5.4.1 MAD used for ASIA task To use MAD for this
task, the concept name Ys is injected as label for the ten
entities that co-occur most withYs, and the label propagation
algorithm is run. Each entityei that scores higher than the
dummy label is then ranked based on the probability of the
labelYsfor that entity.
Table 4 shows that K-NN+PIC-D takes on average only 20 msec. to run a ASIA query as compared to 56 msec. by K-NN-Baseline and 6000 msec. by MAD. These query times are averaged over a set of 25 ASIA queries from
Delicious Sports dataset. Figure 6 (b) shows the
com-parison of all three methods on the ASIA task in terms of macro-averaged precision recall curves (following the
same procedure for averaging as in set expansion).
K-NN+PIC-D generally outperforms K-NN-Baseline. MAD
0 0.2 0.4 0.6 0.8 1 0 0.1 0.2 0.3 0.4 0.5 0.6 0.7 0.8 0.9 1 Recall Interpolated precision K−NN+PIC−D K−NN−Baseline MAD
(a) Task: Set Expansion
0 0.2 0.4 0.6 0.8 1 0 0.1 0.2 0.3 0.4 0.5 0.6 0.7 Recall
Interpolated precision K−NN+PIC−D
K−NN−Baseline MAD (b) Task: ASIA 0 0.2 0.4 0.6 0.8 1 50 55 60 65 70 75 80 85 90 95 100 %Train entities
%Accuracy of predicted labels for all table columns
Performance based on labeling of table−columns
SVM+PIC−D+Centroid (156) SVM−Baseline+Centroid (6023)
(c) Task: COL-CLASS Figure 6: Results on Delicious Sports dataset
Concept Name
Seed
Enti-ties K-NN +PIC-D: Expanded entity set
Sports
Football, Basketball, Soccer
Softball, Ice Hockey, Volleyball, Skating, Martial Arts, Windsurfing, Hunting, Strength Sports, Lacrosse, Dodgeball, Curling, ...
City
New York, London, Los Angeles
Tokyo, Grand Rapids, San Jose, Memphis, Long Beach, Ft Lauderdale, Southern New England, Minnesota, Washington, ...
Country
United States, Canada, India
Australia, Dr Congo, Argentina, Colombia, North Korea, China, Malaysia, Pakistan, Nor-way , Philippines, Iceland, Egypt, Ecuador, In-donesia, Vietnam, South Africa, Brasil, ...
Outdoor Recreation
Hunting, Fishing, Skiing
Cross Country, Martial Arts, Ice Hockey, Cro-quet, Curling, Climbing, Lacrosse, Softball, Basketball, Golf, Windsurfing, Baseball, ... Major
European Countries
France, Ger-many, UK
Slovakia, Thailand, Israel, Czech Republic, United States, Brazil, Iceland, Belgium, Hong Kong, Canada, Serbia, Uruguay, ...
Leagues NFL, Premier League, NBA
NHL, NASCAR, NHRA, NCCA, PGA, Sports Illustrated, ....
Table 6:ASIA task on Clueweb Sports dataset
is slightly batter than K-NN+PIC-D at the expense of
much longer query times. These results show that
K-NN+PIC-D achieves comparable quality results w.r.t MAD by reducing the query time by a factor of 300 (Table 4). Table 6 shows some example ASIA queries and output produced by K-NN+PIC-D method on Clueweb Sports dataset.
5.5 Column Classification For this task we use the
man-ual labels (Yc) assigned to all table columns of
Deli-cious Sports and Toy Apple datasets. These labels are fur-ther extended to entities appearing in those table columns.
Column Classification (COL-CLASS) task is to predict Yc
for a given table columnc, using a classifier trained on few
example entities for eachYc.
We refer to our method described in Algorithm 4 as
SVM+PIC-D+Centroid. Similar to SSL task, we
cre-ate a version of this method which trains SVM clas-sifier and predicts class label of the column in
origi-nal data space. This method is referred to as
SVM-Baseline+Centroid. Figure 6 (c) shows the performance
of all these two methods on Delicious Sports dataset. It can be seen that SVM+PIC-D+Centroid gives a com-parable or better performance when compared to SVM-Baseline+Centroid. Note that along with the superior qual-ity results, SVM+PIC-D+Centroid achieves a query-time speedup of 12x to 14x as shown in Table 4.
We also tried a variant of both these methods where prediction of the label of a table column is the
major-ity of labels predicted for each of its entities. These
methods are referred to as SVM+PIC-D+Majority and
SVM-Baseline+Majority resp. We observed in our
ex-periments that there is no significant difference between SVM+PIC-D+Centroid and SVM+PIC-D+Majority, while Baseline+Majority performs slightly better than SVM-Baseline+Centroid. The performance of these methods on Toy Apple dataset followed very similar trends (plots omit-ted due to space constraints). Overall, PIC-D based methods performed better than baseline methods for both the datasets in terms of query-time and prediction accuracy.
6 Related Work
This work uses the Power Iteration Clustering (PIC) algo-rithm by Lin and Cohen [11]. We propose a low-dimensional representation for entities based on the embedding used in-ternally by the PIC algorithm. Briefly, PIC assigns nearby values to similar nodes, thus producing a one-dimensional
embedding of a graph. Clustering is then performed in
this one-dimensional space. Extension of PIC for bipartite graphs is demonstrated by Lin and Cohen [12].
PIC is very scalable, and in past experiments it has shown to be comparable to spectral clustering methods for
certain network datasets, and superior to traditionalk-means
clustering on certain text-clustering tasks (where a text cor-pus is represented as a bipartite graph with nodes that are terms or documents.) It has also been previously shown that the performance of PIC can be improved by using multiple random starting points, thus producing a low-dimensional (but not one-dimensional) embedding of a graph [1]. This paper considers D-partite graphs, and evaluates new
ations (other than clustering) on the embedded space. We note that many of the tasks considered here are quite differ-ent from cases where PIC was previously used, in that there are many small clusters rather than a few large ones. We also showed that similarity queries can be executed extremely fast on the PIC-D embedding.
Another line of related work concerns information ex-traction from semi-structured web data sources. WebTables [2] demonstrated the utility of large corpora of HTML tables, and such data has been used for various inference tasks by several other researchers [19, 9, 6, 16], including several of the individual tasks discussed above, notably set expansion using semi-structured data [19]. Set expansion has been used for tasks such as answering entity-list completion queries [4], and the semi-structured data used in set expansion has been extended with other sources, such as web search logs [7]. Wang and Cohen also used semi-structured data in an ex-tended set-expansion system, in conjunction with hyponym data collected at query time, for the automatic set instance acquisition task [18].
The combination of tables and hyponym data was also
used by [14] to learn class-instance factsof the form
“en-tityxis a member of conceptc”, using a label propagation
method called Modified Adsorption (MAD). Here we use the same representation as one of our baselines, and consider us-ing MAD on this graph to propagate labels, but consider a broader set of tasks, and compare to other representations as well. WebSets [5] also demonstrated unsupervised class-instance fact extraction using HTML tables and Hearst pat-terns [8], and the data we use for evaluation is taken from the WebSets project [5]. Here again we consider using simi-lar underlying data, but consider a different set of tasks.
7 Conclusions
In this paper, we propose a single low-dimensional represen-tation for entities found in semi-structured data on the web. Further we show that a single, efficiently-constructible rep-resentation, the PIC-D reprep-resentation, can be used for an-swering similarity queries like set expansion, automatic set instance acquisition, and column classification.
We present experiments on large collections of tables and hyponym data published by [5]. Our proposed approach gives comparable precision values with respect to the task specific baselines. Additionally, it gives up to two orders of magnitude improvement in query response time. The exper-imental success of our approach is especially encouraging given that there are very few parameters to tune in
build-ing the representation (only the number of iterations t for
PIC and the number of PIC dimensionsm, set tot = 5and
m=√nin the experiments).
These initial results raise a number of interesting
questions. A plausible research direction would be to
use the PIC-D representation with many more “views” of
entity data (for instance, features describing the content of an entity name, or properties derived from large broad-coverage knowledge bases such as FreeBase). One could also investigate class-instance fact acquisition using the PIC-D representation.
Acknowledgments This work is supported in part by the Intelligence Advanced Research Projects Activity (IARPA) via Air Force Research Laboratory (AFRL) contract number FA8650-10-C-7058. The U.S. Government is authorized to reproduce and distribute reprints for Governmental purposes
notwithstanding any copyright annotation thereon. This
work is also partially supported by the Google Research Grant. The views and conclusions contained herein are those of the authors and should not be interpreted as necessarily representing the official policies or endorsements, either expressed or implied, of Google, IARPA, AFRL, or the U.S. Government.
References
[1] R. Balasubramanyan, F. Lin, and W. W. Cohen. Node clustering in graphs:
An empirical study. Workshop on Networks Across Disciplines in Theory and Applications, NIPS, 2010.
[2] M. J. Cafarella, E. Wu, A. Halevy, Y. Zhang, and D. Z. Wang. Webtables:
Exploring the power of tables on the web.PVLDB, 2008.
[3] A. Carlson, J. Betteridge, R. C. Wang, E. R. Hruschka, Jr., and T. M. Mitchell.
Coupled semi-supervised learning for information extraction. InWSDM, 2010.
[4] B. Dalvi, J. Callan, and W. Cohen. Entity list completion using set expansion
techniques. InTREC, 2010.
[5] B. Dalvi, W. Cohen, and J. Callan. Websets: Extracting sets of entities from the
web using unsupervised information extraction. InWSDM, 2012.
[6] R. Gupta and S. Sarawagi. Joint training for open-domain extraction on the web:
exploiting overlap when supervision is limited. InWSDM, 2011.
[7] Y. He and D. Xin. Seisa: set expansion by iterative similarity aggregation. WWW, 2011.
[8] M. A. Hearst. Automatic acquisition of hyponyms from large text corpora. In
ACL, 1992.
[9] G. Limaye, S. Sarawagi, and S. Chakrabarti. Annotating and searching web tables
using entities, types and relationships.PVLDB, 2010.
[10] F. Lin. Scalable methods for graph-based unsupervised and semi-supervised
learning. In PhD thesis, 2012. http://www.lti.cs.cmu.edu/
research/thesis/2012/frank_lin.pdf.
[11] F. Lin and W. W. Cohen. Power iteration clustering. ICML, 2010.
[12] F. Lin and W. W. Cohen. A very fast method for clustering big text datasets. ECAI, 2010.
[13] N. Otsu. A threshold selection method from gray-level histograms. InIEEE
Transactions on Systems, Man and Cybernetics, 1979.
[14] P. Talukdar and K. Crammer. New regularized algorithms for transductive
learning. InECML-PKDD. 2009.
[15] P. P. Talukdar, Z. G. Ives, and F. Pereira. Automatically incorporating new
sources in keyword search-based data integration. SIGMOD, 2010.
[16] P. Venetis, A. Halevy, J. Madhavan, M. Pas¸ca, W. Shen, F. Wu, G. Miao, and
C. Wu. Recovering semantics of tables on the web.VLDB, 2011.
[17] R. C. Wang and W. W. Cohen. Language-independent set expansion of named
entities using the web. InICDM, 2007.
[18] R. C. Wang and W. W. Cohen. Automatic set instance extraction using the web. InACL/AFNLP, 2009.
[19] R. C. Wang and W. W. Cohen. Character-level analysis of semi-structured
documents for set expansion. InEMNLP, 2009.