CANADIAN MASTERS OF ECONOMIC PROGRAMS:
HAVE THEY CHANGED OVER THE LAST DECADE
Martin Milkman, Murray State University
James McCoy, Murray State University
Riza Marjadi, Murray State University
ABSTRACTThis paper presents the results of a survey of directors of Masters of Economics programs to determine the missions, inputs, and outcomes of these degree programs throughout the United States and Canada. The survey asks respondents to provide information on program admission requirements, curriculum, faculty characteristics, enrollment, graduation rates, student financial support, and placement. The results of degree programs in the United States are compared to those in Canada. Current characteristics of Canadian degree programs are also compared to our previous survey conducted 10 years ago. Similarities and differences between programs in the United States and Canada are highlighted.
INTRODUCTION AND BRIEF REVIEW OF THE LITERATURE
This paper first presents data from terminal economics degree programs in Canada and then compares these programs to terminal economics master’s degree programs in the United States. The data are from a survey of all terminal master’s programs in Canada and the United States that was conducted by Survey Monkey in 2012. We then compare the results from this survey of Canadian schools to the results of a previous survey of Canadian terminal master’s programs based on a survey conducted in 2002.
The first study to look at master’s of economics programs was by Barr, Aby, and Willhite in 1991. They reported the results of a survey of departments offering both Ph.D.’s and master’s degrees in economics. The survey focused upon the differences in the degree structures and graduate degree placement. Another study by Thornton and Inees (1988) looked at master’s degrees in economics and focused on admissions requirements, curriculum requirements, and time needed to earn a degree and graduate placement into careers and doctoral programs. As noted by McCoy and Milkman (1995) “neither of these studies attempted to ascertain significant differences in programs that may be associated with different intuitional characteristics or different program goals. (p.157)” As far as we can tell the only other research in this area has been conducted in various manuscripts by McCoy and Milkman.
McCoy and Milkman published the results of an initial survey of terminal master’s programs in economics in United States universities in 1995, and the results of a second survey in 2006. Both of the studies were published in the Journal of Economic Education. While the study published in 1995 only included programs in the United States, the survey done for the paper published in 2006 also included Canadian universities. However the results were not presented in the paper published in 2006. Instead a separate article, “Masters in Economic Programs:
Comparing Canada and the United States” was published by the Journal of Economic Education
in 2008.
DATA AND DESCRIPTIVE STATISTICS
The data collected in 2012 was collected through an on-line survey using Survey Monkey. All of the universities in the United States and Canada listed in Peterson’s Online Guide to Graduate Programs in Economics which offered a terminal master’s degree in economics were surveyed. This totaled 195 in the United States and 27 in Canada. The emails were sent out in early spring of 2012. Those who did not respond were sent a second email which also contained the survey in the late spring of 2012, and this was followed by an email survey attempt to the non-responders in the fall of 2012. In the previous surveys of Masters of Economics programs the surveys were sent out by postal mail and we asked respondents to send the completed surveys back to us. The survey is very extensive and this may be why our survey response rate is slightly below what is was in the previous surveys. This time our response rate was 33 percent for the Canada universities (compared to 45 percent in the prior survey), and for United States universities the response rate was 32 percent (compared to 37 percent in the prior survey).
There seem to be less programs that offer the terminal master’s degree in economics in the United States. In the United States in 2002 we were able to identify 272 programs that offered this degree, while in the 2012 survey only 195 programs were identified. However in Canada the number of programs identified only decreased by one from 34 to 33.
Table 1 and Table 2 display the results of the surveys. Table 3 contains a list and brief description of all of the variables used in the study. The survey asked respondents information about their programs such as general program characteristics, department faculty, admission requirements, student characteristics, financial aid, curriculum, and graduation rates and placement.
THE CANADIAN AND UNITED STATES PROGRAMS
Means and standard deviations are listed for all of the variables in the 2012 survey. While there are many similarities between the programs located in Canada and the United States, this portion of the paper will focus on the differences which are statistically significant.
A higher percentage of programs in Canada are more likely to see their mission as preparing students for either doctoral work or careers. Also a higher percentage of the Canadian programs are located in the Colleges of Arts and Sciences. They also have a higher percentage of women faculty members in the department.
Programs in the United States are more likely to require a standardized entrance exam. However all of the Canadian programs require a certain undergraduate grade point average for admission, while only eighty percent of the United States programs require one. The average undergraduate grade point average for the Canadian programs is 3.16 while for United States programs it is 2.982. All of the Canadian programs also require intermediate undergraduate economics.
A Comparison of United States and Canadian Programs
US CA US v. CA
Variables1) Ma SD N Ma SD N z Sig. 2)
General Program Characteristics
PHD 0.608 0.492 74 0.8 0.422 10 -1.18 DOCWORK 0.27 0.447 63 0.1 0.316 10 1.158 BUSGOVT 0.635 0.485 63 0.6 0.516 10 0.212 BOTH 0.095 0.296 63 0.3 0.483 10 -1.83 ** ARTSCI 0.466 0.502 73 0.75 0.463 8 -1.527 * BUS 0.329 0.473 73 0.125 0.354 8 1.184 AG 0.205 0.407 73 0.125 0.354 8 0.543 PUBLIC 0.838 0.371 74 0.8 0.422 10 0.301 PRIVATE 0.162 0.371 74 0.2 0.422 10 -0.301 Departmental Faculty FULFAC 19.438 10.828 73 22.1 6.523 10 -1.099 WOMFAC 18.954 13.976 62 26.292 9.457 7 -1.839 ** MINFAC 11.006 16.286 62 12.222 9.493 5 -0.258 Admission Requirements ENTREXAM 0.75 0.436 64 0.1 0.316 10 4.042 *** MINIMUM 0.449 0.503 49 1 - 1 -1.094 MINUGPA 0.794 0.408 63 1 0 10 -1.584 * REQGPA 2.982 0.203 51 3.16 0.201 10 -2.55 *** RCRSWRK 0.875 0.333 64 1 0 10 -1.184 PRINCECO 0.614 0.491 57 0.8 0.422 10 -1.131 INTERECO 0.807 0.398 57 1 0 10 -1.52 * ONECALC 0.702 0.462 57 0.7 0.483 10 0.011 STATS 0.842 0.368 57 0.8 0.422 10 0.332 QUANT 0.842 0.368 57 0.9 0.316 10 -0.474 REQTOEFL 0.984 0.126 63 1 0 10 -0.401 Student Characteristics FTENROLL 26.686 36.343 51 27.4 12.501 10 -0.111 PARTROLL 11.955 45.291 44 1.571 1.618 7 1.515 * WOMEN 35.774 20.753 44 44.4 24.228 8 -0.946 AFRIAMER 5.734 10.058 41 1.214 2.087 8 2.604 *** HISPAMER 3.709 8.024 37 0 0 8 2.812 *** FOREIGN 38.135 26.748 42 49.374 29.044 10 -1.116 UNDGRAD 17.748 18.037 38 32.539 59.885 10 -0.772 UNDECON 57.452 35.114 39 78.018 31.518 10 -1.797 ** DIRECT 55.202 34.723 39 74.696 19.108 10 -2.374 *** GRADTRAN 11.412 14.495 39 4 8.966 10 2.023 **
Table 1
A Comparison of United States and Canadian Programs
US CA US v. CA Variables1) Ma SD N Ma SD N z Sig. 2) WRKFRC 27.858 23.542 37 14.984 11.461 9 2.367 *** IN25MI 0.173 0.382 52 0 0 10 1.423 * IN300MI 0.288 0.457 52 0.4 0.516 10 -0.701 OUT300MI 0.538 0.503 52 0.6 0.516 10 -0.358 Financial Aid TASSIST 0.561 0.501 57 1 0 10 -2.645 *** PTASSIST 19.602 29.98 49 85.5 16.236 10 -9.856 *** DSTIP-T 3) 9812.96 4061.485 25 10179.662 5149.427 10 -0.202 RASSIST 0.632 0.487 57 0.5 0.527 10 0.788 PRASSIST 28.49 35.394 52 16.25 31.075 10 1.114 DSTIP-R 3) 9214.514 4268.247 37 8442.927 8158.127 6 0.227 FELSCHOL 0.474 0.504 57 1 0 10 -3.087 *** DSTIP-F 3) 6825 5534.618 11 9404.25 4970.616 8 -1.064 OTHERAID 0.123 0.331 57 0 0 10 1.171 NEEDBASE 0.175 0.384 57 0.1 0.316 10 0.594 MINFAID 0.644 0.483 59 0.7 0.483 10 -0.343 Curriculum RGRDHRS 32.617 7.258 47 28.125 7.68 8 1.541 * FULLTIME 18.66 6.098 47 15 6.7 10 1.593 * RMICRO 3.766 1.577 47 3.6 1.265 10 0.36 RMACRO 3.283 1.515 46 3 1.414 10 0.565 REMETRIC 4.826 3.282 46 3 2 10 2.293 ** RMATHECO 1.914 1.616 35 0 0 8 7.01 *** RSTAT 1.324 1.934 34 0 0 8 3.99 *** REQSPEC 0.277 0.452 47 0.1 0.316 10 1.178 SPECOPT 0.419 0.499 43 0.3 0.483 10 0.691 REQTHES 0.383 0.491 47 0.4 0.516 10 -0.1 COMPEXAM 0.34 0.479 47 0.1 0.316 10 1.509 * WRITEXAM 0.778 0.428 18 1 - 1 -0.531 ORALEXAM 0.222 0.428 18 0 - 1 0.531
Graduation Rates and Placement
NUMBER 15.447 23.737 47 18.5 11.54 10 -0.607 COMPLETE 83.643 12.435 42 90.9 8.319 10 -2.229 ** DOCTI 9.15 15.501 40 10.111 9.752 9 -0.236 DOCT2 13.205 12.689 39 13.1 9.024 10 0.03 DOCT3 3.441 3.94 34 1.429 2.44 7 1.76 ** GOVT 20.611 11.729 36 34.8 15.648 10 -2.667 ***
A Comparison of United States and Canadian Programs US CA US v. CA Variables1) Ma SD N Ma SD N z Sig. 2) PRIVSECT 49.649 25.044 37 35.4 17.315 10 2.08 ** POSTSEC 5.724 13.943 29 4.333 10.614 6 0.276
Notes: 1) Variables are described in Table 3.
2) Statistical Significance * Alpha = 0.1 ** Alpha = 0.05 *** Alpha = 0.01
3)Figures are in US$
United States programs have a much higher percentage of part-time students than Canadian programs, and they have more African American and Hispanic Students. Canadian programs have significantly more students that completed an economics undergraduate major. The Canadian programs also have a higher percentage of students that entered their Masters of Economics program directly after completion of their undergraduate degree. United States programs have a higher percentage of students who transfer from another graduate program and a higher percentage of students that entered the program from the work force. Also, seventeen percent of the students in the United States programs lived within twenty-five miles prior to entering the Masters of Economics program.
All of the Canadian universities offer teaching assistantships to students in their terminal master’s program, while in the United States only 56% of the programs offer this type of financial support. Over 85% of Canadian students receive teaching assistantships and in the United States less than 20% of the students in the terminal Masters of Economics programs receive teaching assistantships. All of the Canadian schools also award fellowships and scholarships to students in their programs.
The number of months it takes the typical full time student to graduate from the program is 18.66 in the United States while it is only 15 months in the Canadian programs. This may be because the Canadian programs have entering students who may be better prepared to study economics. United States programs seem to be more quantitative. The average United States program requires students to take more econometrics. None of the Canadian programs require a course in either mathematical economics or statistics. United States programs are also more likely to require a comprehensive exam. Another reason why the United States program may take longer to complete is that the average United States program has a higher credit hour requirement than the average credit hour requirement in the Canadian programs.
Almost 91% of the students in Canada complete the terminal masters of economics degree while in the United States the percentage of degree completers is 83.6%. A higher percentage of the students in Canada enter careers in government (almost 35%) after they finish their terminal Master’s degree in Economics. However in the United States more students enter jobs in the private sector (almost 50%). Both the United States and Canadian programs prepare a substantial number of students for doctoral programs in economics.
Many of the differences and similarities are similar to findings in the Milkman and McCoy (2008) paper. This we believe is due to stability in the Canadian programs.
CHANGES IN THE LAST DECADE IN CANADIAN M.S. ECONOMICS PROGRAMS
Table 2 contains the means and standard deviations for the Canadian programs that responded to our surveys in 2002 and 2012. As noted above the Canadian programs have remained relatively stable, however we will highlight the statistically significant changes in the Canadian programs over the last decade.
The Canadian programs are more likely to place more emphasis on preparing students for doctoral work and preparation for careers than they did a decade ago. This may be in response to student desires since a higher percentage of the programs’ graduates now take jobs in the private sector. In the 2002 survey all of the universities who responded to our survey were public institutions. In the 2012 survey 20% of the schools responding were private universities.
In the 2012 survey all of the universities responding required a minimum grade point average, while in the previous survey less than 83% had this requirement for admission. Also, while fewer universities require applicants to have a course in statistics today, they are more likely to require quantitative courses. Requiring more quantitative courses is also true of programs in the United States and this may reflect the trend of the economics profession becoming more and more mathematical.
The average number of students in each program has increased dramatically from 17.0 to 27.4 in the Canadian programs. This same trend has occurred in the United States. A greater percentage of the students in the Canadian masters programs are undergraduate economics majors. (78.01% in the 2012 survey vs. 59.86% in the 2002 survey). Fewer of the students in the Canadian programs are from public comprehensive universities.
The 2012 survey shows that a much greater percentage of students are receiving teaching assistantships than in 2002, and that the average stipend for the teaching assistantship has increased from $5,272 to $10.118. (The 2002 dollars have been adjusted for inflation.)
The percentage of students receiving research assistantships has declined over the decade, but the stipend for fellowships and scholarships has increased. The percentage of universities offering minority specific financial aid has also increased.
None of the universities in the 2012 survey required a class in mathematical economics. This may be attributed to the increasing percentages of universities that required more quantitative classes for admission. Also, fewer of the programs now require a thesis.
The percentage of students going into a doctoral program in a discipline other than economics has declined. A much greater percentage of students are now taking jobs in the private sector after they complete their master’s program in economics.
In conclusion, this research has highlighted both the similarities and differences between the Canadian and United States universities terminal master’s degrees in economics. It has also has illustrated the changes that Canadian universities terminal master’s programs have experienced over the decade. Our hope is that information will be useful to directors of programs in both countries as they work to improve their programs.
A Comparison of Canadian Programs
CA 2012 CA 2002 2012 v. 2002
Variable1) Ma SD N Ma SD N z Sig. 2)
General Program Characteristics
PHD 0.8 0.422 10 0.619 0.498 21 1.008 DOCWORK 0.1 0.316 10 0.227 0.429 22 -0.855 BUSGOVT 0.6 0.516 10 0.727 0.456 22 -0.72 BOTH 0.3 0.483 10 0.045 0.213 22 2.018 ** ARTSCI 0.75 0.463 8 0.826 0.388 23 -0.469 BUS 0.125 0.354 8 0.043 0.209 23 0.808 AG 0.125 0.354 8 0.13 0.344 23 -0.039 PUBLIC 0.8 0.422 10 1 0 24 -2.258 ** PRIVATE 0.2 0.422 10 0 0 24 2.258 ** Departmental faculty FULFAC 22.1 6.523 10 19.75 11.299 24 0.759 WOMFAC 26.292 9.457 7 18.231 33.824 15 0.854 MINFAC 12.222 9.493 5 24.383 33.441 15 -1.264 Admission Requirements ENTREXAM 0.1 0.316 10 0.13 0.344 23 -0.246 MINIMUM 1 N/A 1 1 0.344 23 N/A MINUGPA 1 0 10 0.826 0.388 23 1.407 * REQGPA 3.16 0.201 10 3.164 0.284 17 -0.038 RCRSWRK 1 0 10 0.957 0.209 23 0.67 PRINCECO 0.8 0.422 10 0.682 0.477 22 0.689 INTERECO 1 0 10 0.955 0.213 22 0.685 ONECALC 0.7 0.483 10 0.636 0.492 22 0.351 STATS 0.8 0.422 10 0.955 0.213 22 -1.39 * QUANT 0.9 0.316 10 0.565 0.507 23 1.875 ** REQTOEFL 1 0 10 0.913 0.288 23 0.962 Student Characteristics FTENROLL 27.4 12.501 10 17.043 12.9 23 2.166 ** PARTROLL 1.571 1.618 7 3.733 6.787 15 -1.165 WOMEN 44.4 24.228 8 39.214 13.068 22 0.576 AFRIAMER 1.214 2.087 8 HISPAMER 0 0 8 FOREIGN 49.374 29.044 10 38.504 20.215 22 1.071 UNDGRAD 32.539 59.885 10 25.991 21.387 21 0.336 UNDECON 78.018 31.518 10 59.86 40.643 17 1.295 * DIRECT 74.696 19.108 10 77.472 121.54 22 -0.104
Table 2
A Comparison of Canadian Programs
GRADTRAN 4 8.966 10 3.136 8.703 19 0.249 WRKFRC 14.984 11.461 9 IN25MI 0 0 10 0 0 22 N/A IN300MI 0.4 0.516 10 0.455 0.51 22 -0.288 OUT300MI 0.6 0.516 10 0.545 0.51 22 0.288 Financial Aid TASSIST 1 0 10 0.958 0.204 24 0.655 PTASSIST 85.5 16.236 10 56.452 27.756 21 3.658 *** DSTIP-T 3) 10179.662 5149.427 10 5732.99 3214.686 15 2.433 *** RASSIST 0.5 0.527 10 0.875 0.338 24 -2.349 *** PRASSIST 16.25 31.075 10 34.167 31.311 18 -1.458 * DSTIP-R 3) 8442.927 8158.127 6 5270.562 3160.764 21 0.933 FELSCHOL 1 0 10 0.913 0.288 23 0.962 DSTIP-F 3) 9404.25 4970.616 8 5182.77 3041.426 17 2.215 ** OTHERAID 0 0 10 1 0 2 -3.464 *** NEEDBASE 0.1 0.316 10 0.261 0.449 23 -1.039 MINFAID 0.7 0.483 10 0.13 0.344 23 3.272 *** Curriculum RGRDHRS 28.125 7.68 8 24.947 9.704 19 0.905 FULLTIME 15 6.7 10 15.959 6.726 22 -0.375 RMICRO 3.6 1.265 10 3.4 1.353 20 0.399 RMACRO 3 1.414 10 2.789 1.032 19 0.416 REMETRIC 3 2 10 3.5 1.762 20 -0.671 RMATHECO 0 0 8 2.286 1.604 7 -3.771 *** RSTAT 0 0 8 0.6 1.342 5 -1 REQSPEC 0.1 0.316 10 0.087 0.288 23 0.12 SPECOPT 0.3 0.483 10 0.217 0.422 23 0.509 REQTHES 0.4 0.516 10 0.913 0.288 23 -3.161 *** COMPEXAM 0.1 0.316 10 0.087 0.288 23 0.12 WRITEXAM 1 N/A 1 1 0 2 N/A ORALEXAM 0 N/A 1 1 0 2 -1.732 **
Graduation Rates and Placement
NUMBER 18.5 11.54 10 10 7.403 21 2.13 ** COMPLETE 90.9 8.319 10 84.316 10.945 19 1.81 ** DOCTI 10.111 9.752 9 17.143 22.25 14 -1.038 DOCT2 13.1 9.024 10 18.571 17.805 14 -0.986 DOCT3 1.429 2.44 7 5 9.405 14 -1.334 * GOVT 34.8 15.648 10 37.143 17.944 14 -0.34
A Comparison of Canadian Programs
PRIVSECT 35.4 17.315 10 20.714 21.2 14 1.864 ** POSTSEC 4.333 10.614 6 1.429 3.056 14 0.659
Notes: 1) Variables are described in Table 3.
2) Statistical Significance * Alpha = 0.1 ** Alpha = 0.05 *** Alpha = 0.01
3) 2002 figures are adjusted for inflation
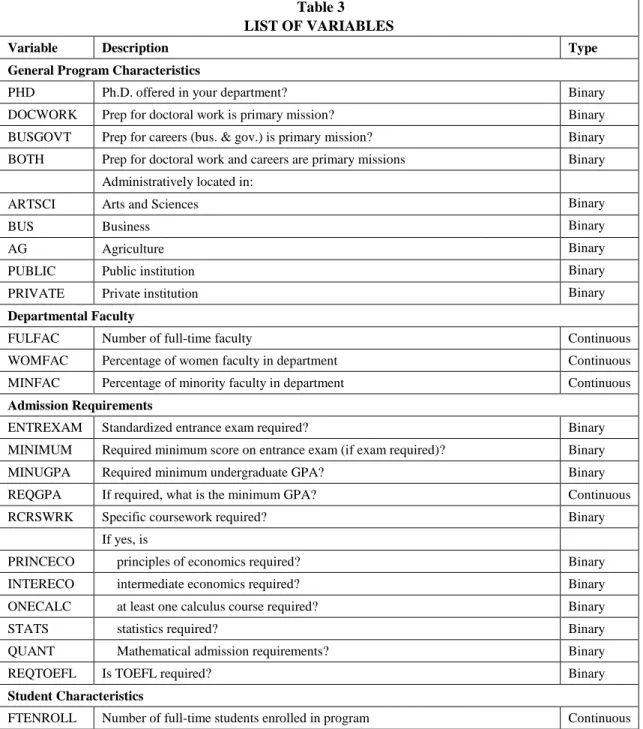
Table 3 LIST OF VARIABLES
Variable Description Type
General Program Characteristics
PHD Ph.D. offered in your department? Binary DOCWORK Prep for doctoral work is primary mission? Binary BUSGOVT Prep for careers (bus. & gov.) is primary mission? Binary BOTH Prep for doctoral work and careers are primary missions Binary Administratively located in: ARTSCI Arts and Sciences Binary
BUS Business Binary
AG Agriculture Binary PUBLIC Public institution Binary PRIVATE Private institution Binary
Departmental Faculty
FULFAC Number of full-time faculty Continuous WOMFAC Percentage of women faculty in department Continuous MINFAC Percentage of minority faculty in department Continuous
Admission Requirements
ENTREXAM Standardized entrance exam required? Binary MINIMUM Required minimum score on entrance exam (if exam required)? Binary MINUGPA Required minimum undergraduate GPA? Binary REQGPA If required, what is the minimum GPA? Continuous RCRSWRK Specific coursework required? Binary
If yes, is
PRINCECO principles of economics required? Binary INTERECO intermediate economics required? Binary ONECALC at least one calculus course required? Binary STATS statistics required? Binary QUANT Mathematical admission requirements? Binary REQTOEFL Is TOEFL required? Binary
Student Characteristics
PARTROLL Number of part-time students enrolled in program Continuous Percentage of students who
WOMEN are women Continuous AFRIAMER are African American Continuous HISPAMER are Hispanic American Continuous FOREIGN are foreign Continuous UNDGRAD received undergraduate degrees at the same institution Continuous UNDECON were undergraduate economics majors Continuous DIRECT entered the program directly upon completion of bachelor's Continuous GRADTRAN transferred from a graduate program Continuous WRKFRC entered the program from the work force Continuous IN25MI Majority of students drawn within 25 miles? Binary IN300MI Majority of students drawn within 300 miles? Binary OUT300MI Majority of students drawn from over 300 miles? Binary
Financial Aid
TASSIST Teaching assistantships available to terminal master's students? Binary PTASSIST Percentage of students in this program who receive TA’s? Continuous DSTIP-T 2) Stipend of TA's Continuous
RASSIST Research assistantships available to terminal master's students? Binary PRASSIST Percentage of students in this program who receive RA's? Continuous DSTIP-R 2) Stipend of RA's Continuous
FELSCHOL Fellowships or scholarships available to terminal master's students? Binary DSTIP-F 2) Stipend of Fellowships/Scholarships Continuous
OTHERAID Other financial aid available? Binary NEEDBASE Any need-based financial aid? Binary MINFAID Any minority specific financial aid? Binary
Curriculum
RGRDHRS Required semester hours for master's Continuous FULLTIME Number of months typically taken by full-time students to graduate Continuous Number of graduate semester hours required in
RMICRO micro theory Continuous RMACRO macro theory Continuous REMETRIC econometrics Continuous RMATHECO mathematical economics Continuous RSTAT statistics Continuous REQSPEC Is there a specialty field requirement? Binary SPECOPT Is there a specialty field option? Binary REQTHES Is a master's thesis required? Binary COMPEXAM Comprehensive exam required? Binary WRITEXAM If yes, is it written? Binary ORALEXAM If yes, is it oral? Binary
Graduation Rates and Placement
Percentage of terminal master's students who upon completion begin
DOCTI a doctoral program in economics at same university Continuous DOCT2 a doctoral program in economics at another university Continuous DOCT3 a doctoral program in some other discipline Continuous GOVT careers in government Continuous PRIVSECT careers in the private sector Continuous POSTSEC careers in Post-Secondary teaching Continuous
REFERENCES
Barr, S.Z.,C.D. Aby, & S.M. Willhite (1991). Graduate economics programs: Preparation for academics or business. Journal of Business and Economic Perspectives 27(1), 12-17.
McCoy, J. P. & M. I. Milkman (2006). Evolution of the Masters in Economics. Journal of Economic Education, 37 (4), 470-476.
McCoy, J.P. & M.I. Milkman (1995). Masters in Economics Programs: Missions and Methods. Journal of Economic Education, 26 (2), 157-176.
Milkman, M. I. & J. P. McCoy (2008). Masters in Economic Programs: Comparing Canada and the United States. Journal of Economic Education, 39 (1), 92-99.
Peterson’s Guide to Graduate Programs in Economics. (2008) Retrieved March 2012, from
http://www.petersons.com/graduate-schools
Thornton, R.J. and J.T. Innes (1988). The status of master’s programs in economics. Journal of Economic Perspectives 2 (1), 171-78.