Design and Development of Laboratory
Single-Axis PV Module Tracker
By
Delaney Berger
Avishek Maitra
Helen Rice
Senior Project Report
ELECTRICAL ENGINEERING DEPARTMENT
California Polytechnic State University
San Luis Obispo State University
Table of Contents
List of Figures……… 2
List of Tables………. 3
Abstract……….. 4
CHAPTER 1 - Introduction……… 5
CHAPTER 2 - Customer Needs, Requirements, and Specifications………. 7
CHAPTER 3 - Functional Decomposition………....………. 10
CHAPTER 4 - Project Planning………...……….. 12
CHAPTER 5 - Design Implementation and Considerations……….. 14
CHAPTER 6 - Testing……… 24
CHAPTER 7 - Conclusion and Future Work………. 29
References………. 30
Appendix A. Senior Project Analysis……… 31
Appendix B. Literature Search..………...…… 37
Appendix C. Code Composer Studio Code……….. 40
Appendix D. Software Flowchart………. 41
Appendix E. User Manual………. 46
Appendix F. Pinout Diagrams……… 48
List of Figures
Figure 1.1: Physical Realization of Inter-row Shading ……… 5
Figure 3.1:Single Module Level 0 Block Diagram…...……….. 10
Figure 3.2: Level 1 Block Diagram…...………...………11
Figure 4.1: Gantt Chart of full project……….. 12
Figure 5.1 : Keypad Pin Diagram………. 14
Figure 5.2 : LCD Pin Diagram………...….. 15
Figure 5.3 : Accelerometer Pin Diagram………..……….……... 15
Figure 5.4 : Relay Pin Diagram………...…. 17
Figure 5.5 : Software Flowchart for Main……….... 18
Figure 5.6 : Software Flowchart for Home……….. 19
Figure 5.7 : Software Flowchart for Manual Entry…………..……….... 20
Figure 5.8 : Software Flowchart for Algorithm Testing………... 21
Figure 5.9 : Software Flowchart for Demo Mode……….... 22
Figure 6.1: Keypad and LCD……… 24
Figure 6.2: Accelerometer Orientation………. 26
List of Tables
Table 2.1: Laboratory Single-Axis PV Module Tracker Requirements & Specifications … 8
Table 2.2: Laboratory Single-Axis PV Module Tracker Deliverables……….. 9
Table 3.1: Level 0 Block Diagram I/O Descriptives ……… 10
Table 3.2: Level 1 Block Diagram I/O Descriptives ……… 11
Abstract
Solar energy is an integral part of the renewable energy industry. Advanced solar farms actively track solar movement and update solar panel angles to maximize the system’s output power. Cal Poly boasts its own Solar Farm that features a single-axis tracking system. Single-axis tracking aims to get panels as close to perpendicular as possible given the panel arrangements and given the time of year. Single-axis tracking is a more robust measurement and tracking option. Single-axis tracking systems usually only have East-West panel arc movement, following the sun’s rotation. Dual-axis trackers have both East-West and North-South panel arc movements. Dual-axis systems have the ability to shift their North-South angle to better face the sun as the seasons change, based on GPS location. Solar panels generate the most power when receiving the highest light intensity. Single-axis systems generally cost less than Dual-axis. One less axis of motion translates to fewer mechanical parts, fewer motor controllers, and ultimately a more durable system. To account for the inability to directly face the sun year round, students will study how to eliminate inter-row shading between panels to maximize power production.
Chapter 1: Introduction
The introduction describes the purpose of the Single-Axis PV Module Tracker and the motivation behind the controller. There are current systems in place to account for geographical factors in solar panel shading, but very few systems properly account for the edge cases presented throughout the day [1].
This senior project focuses on the design, implementation, and testing of a Laboratory
Single-Axis PV Tracker that tests for inter-row shading. As mentioned in the Abstract, inter-row shading presents a significant issue for the energy production of a solar farm [2]. Therefore, this project implements a system that allows users to orient a test panel to specific angles and view the effects of shading at each input.
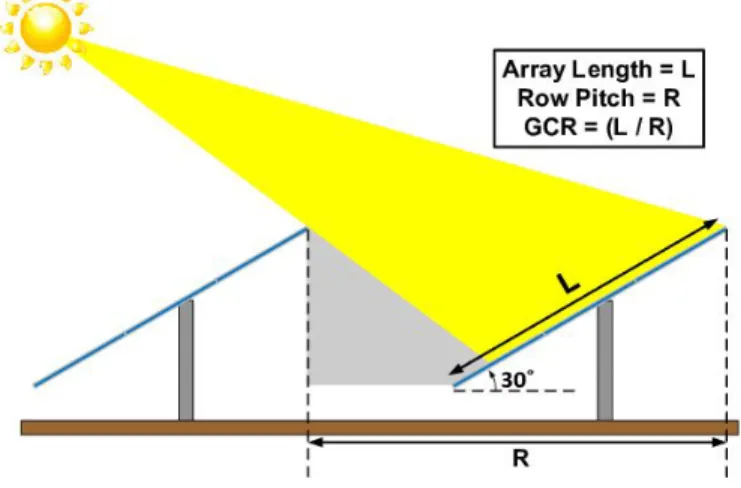
Figure 1.1: Physical Realization of Inter-row Shading
As shown in Figure 1.1, the panel in front of another panel can shade the other panel’s bottom portion if the angles of each are not controlled properly. Shading occurs most during the hours of early morning and late afternoon when the sun is closest to the horizon. Many farms, specifically those in the Gold Tree Solar Farm near Cal Poly, use traditional single-axis solar panels. Unfortunately, the series configuration operates in such a way that if any cells are shaded, a large restriction is put on power output [3].
After students calculate the desired angle, they use a simple control system to set the panel to the desired angle using the same microcontroller and specific power amplifying units that drive a motor [2]. Finally, to communicate the results in a matter conducive to its laboratory setting, students use an LCD to output the current angle and other key characteristics of the panel. In addition, the user has the ability to choose between three distinct settings: a manual angle input setting, an automatic solar tracking setting, and a time-lapsed demonstration setting. This flexibility can illustrate the difference in power output from various angles.
Chapter 2:Customer Needs, Requirements, and Specifications
This section explains the techniques used to determine the customer needs, marketing requirements, and engineering specifications. There should be ongoing meetings with the customer to discuss the status of the project and ensure that all needs are being met.
Customer Needs Assessment
The customer for this proof of concept project is the Cal Poly. This encompasses educating students on different single-axis tracking algorithms as well as providing students and faculty a method to quickly and easily test a variety of ways to track the sun to maximize solar power output. The customers will use this project to find a low-cost, low-maintenance engineering solution to test for maximum power output in a laboratory setting – specifically to address issues like inter-row shading. This kind of shading causes massive decreases in output power generation. Shading often terminates entire bottom rows of cells, which drastically minimizes power output in series-connected panels. Inter-row shading is currently one of the largest causes of reduced power output at the Cal Poly Solar Farm and many solar farms nationwide [3].
It is paramount to create and implement a testing solution to observe an array of solar tracking options, with the ultimate goal of reducing power losses as much as possible. The laboratory testing system helps users find the best ways to reduce or, ideally, eliminate inter-row shading [4]. With project success, the test system helps find the most efficient angles for the tracking system to operate at. The tracking system has independent control inputs for each of three tracking modes. The project focuses on determining the best inputs or best algorithm to produce a desired angle. This project provides a low-cost and flexible testing solution to finding optimal angle inputs for a set of solar panel trackers.
Requirements and Specifications
and obstacles of many other solar farms nationwide. Further descriptions of Requirements and Specifications are found in Table 2.1 below. Following, a brief list of senior project course deadlines is listed in Table. 2.2 below.
Table 2.1: Laboratory single-axis PV Module Tracker Requirements & Specifications Marketing
Requirements
Engineering Specifications Justification
3, 4, 5 Able to observe the effects of
shading in flat terrain.
The system should provide a way to test optimal power output dependent on the time of day.
3 Adjust the angle based on the user
selected modes within +/- 1%.
Ex. If a user implements 32 othen the solar panels should tilt at an angle of 32o.
3, 5 Adjust the angle based on optimal
power
Algorithm should be able to determine the optimal power output and tilt the panels to the desired angle.
2, 4, 5 Takes less than 1 hour to transfer algorithm to new panel configuration regardless of MCU implementation.
Algorithm will work to optimize output of entire system with easy installation and little to no maintenance on system.
2, 4 $600 (max) external device cost
(sensors, mcu, etc.)
The needed devices to implement will be inexpensive.
1, 4, 6 Implement the least amount of
movements possible for minimum power input
Minimum daily movements significantly decreases the power needed to drive the system and creates a more efficient power generation system.
6 9V supply to power the system and
actuator
Need a power supply to power the microprocessor and the actuator.
1, 3, 4, 5 Implement a test system on a durable and contained test housing with 2 test panels. [See Appendix F]
Two panels needed for inter-row shading observation and testing. Two panels provided by Cal Poly EE Department is a low cost way to test and confirm testing configurations in a proof of concept. Durable housing for testing ensures safe and consistent testing. Also provides a way for users to interface.
1, 3, 4, 6 Show an increase of power efficiency from baseline single-axis tracking to algorithm single-axis tracking
The differences in power efficiency of shaded panels with the project’s algorithm validates the proof of concept model for large scale implementation.
Marketing Requirements
1. Effectively tracks the sun using a single-axis movement system. 2. External system will be durable and easy to maintain.
3. Adjust the angle based on the user selected modes 4. Cost effective.
Table 2.2: Design and Development of Laboratory single-axis PV Module Tracker Deliverables
Delivery Date Deliverable Description
Dec. 6, 2019 Design Review
March 6, 2020 EE 461 Demo
March 13, 2020 EE 461 Report
May 26, 2020 EE 462 Demo
Nov. 4, 2020 ABET Sr. Project Analysis
Chapter 3 - Functional Decomposition (Level 0 and Level 1)
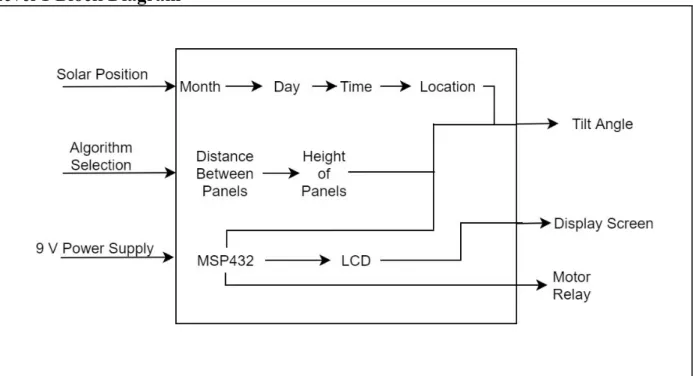
This chapter explains the inputs and outputs of the Level 0, shown in Figure 3.1, and Level 1, shown in Figure 3.2, block diagrams. The Level 1 block diagram delves into the next level of design compared to the Level 0 diagram. The inputs are solar position, inter-row shading, and 9V power supply. From the solar position input, the algorithm will take into consideration the month, day, time, and location to produce a desired tilt output. The desired tilt angle will then be fed into the MSP432, and the algorithm will work to control the motor relays to respond accordingly. The MPS432 will need a 9V power supply in order to supply enough current to move the motors [5].
The Level 0 block diagram in Figure 3.1 below illustrates the base level inputs and outputs of the single-axis Tracker. In addition, Table 3.1 explains these inputs, outputs, and functionality.
Level 0 Block Diagram
Figure 3.1: Test Module Level 0 Block Diagram
Table 3.1: Test Module Level 0 Block Diagram I/O Description
Module Single-Axis PV Module Tracker
Inputs -Solar Position: based on time, day, latitude, longitude
-Algorithm Selection: The user will interact with our system and select/input a solar tracking algorithm for one or both of the laboratory panels to follow.
-9V power supply
Outputs -Tilt angle: Desired angle after algorithm calculation/user input -Display Screen: Displays the simulated and actual angle as -Motor relay: Needed to rotate the panels
Functionality Improve output power production based on an algorithm that accounts for inter-row shading. Output power for all rows should be optimized as a system instead of at the individual panel level.
Level 1 Block Diagram
Figure 3.2: Test Module Level 1 Block Diagram
Table 3.2: Test Module Level 1 Block Diagram I/O Description
Inputs -Solar position: based on time, day, latitude, longitude to estimate the desired tilt angle
-Algorithm Selection: The user will interact with our system and select/input a solar tracking algorithm for one or both of the laboratory panels to follow. -9V power supply: The MSP432 will be powered by 9V to control the LCD display and the motor relay
Outputs -Tilt angle: Desired angle after algorithm calculation/user input -Display Screen: Displays the simulated and actual angle -Motor relay: Needed to rotate the panels
Chapter 4 - Project Planning (Gantt Chart and Cost Estimates
The project planning section depicts the project schedule and cost estimates for the duration of the project. The project is broken down into three sections: EE460, EE461, and EE462, all during the 2019-2020 Cal Poly school year. The most time is allotted for the algorithm design since it is the most complex. There are two design tests scheduled, and the final project should be completed by the twenty-second of May.
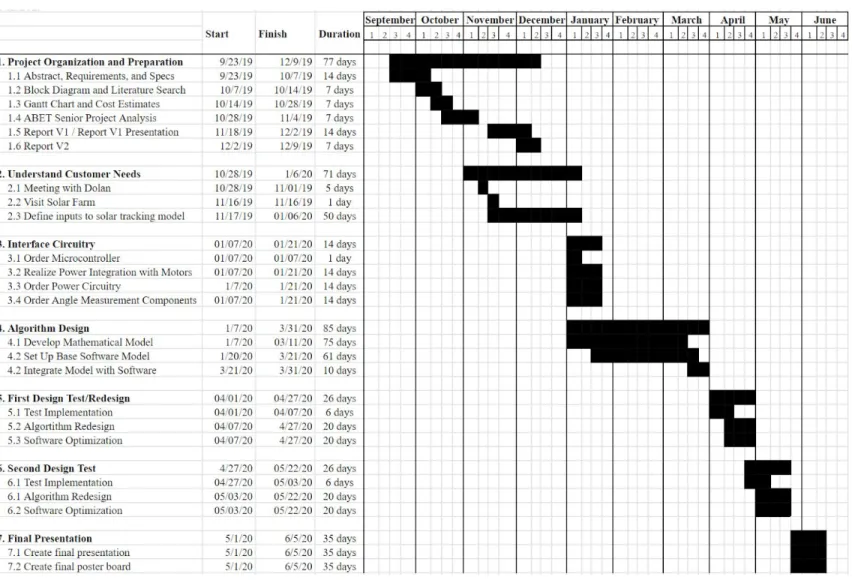
The Gantt chart shown in Figure 4.1 demonstrates the estimated planning for the year.
Figure 4.1: Gantt Chart of Full Project
Length of tasks estimated based on equation: time = (ta + 4tm + tb) / 6.
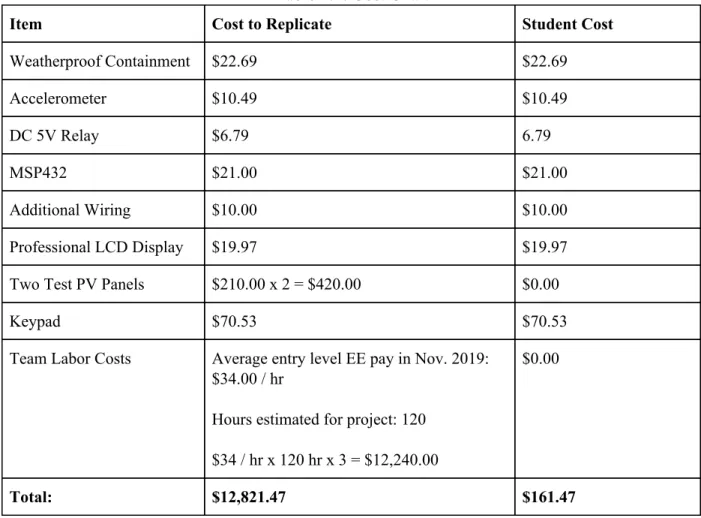
Costs are determined through the equation: cost = (costa + 4costm + costb) / 6, and item cost research. Final item decisions and exact costs will be known once specifications are fully decided, according to Gantt Chart. The accelerometer determines the two available test panel positions and verifies working angle implementations. The MSP432 computes the angles and communicates that angle to the rest of the system while aiding user interface. The weatherproof external containment houses the entire system during long test iterations. The portable battery must supply power during test iterations. The LCD display allows users to interface with the test system. Labor costs account for student work time over the project working span.Total costs of the project and for another group to replicate the project are summarized in Table 4.1 below. See Appendix F.
Table 4.1: Cost Chart
Item Cost to Replicate Student Cost
Weatherproof Containment $22.69 $22.69
Accelerometer $10.49 $10.49
DC 5V Relay $6.79 6.79
MSP432 $21.00 $21.00
Additional Wiring $10.00 $10.00
Professional LCD Display $19.97 $19.97 Two Test PV Panels $210.00 x 2 = $420.00 $0.00
Keypad $70.53 $70.53
Team Labor Costs Average entry level EE pay in Nov. 2019: $34.00 / hr
Hours estimated for project: 120
$34 / hr x 120 hr x 3 = $12,240.00
$0.00
Total: $12,821.47 $161.47
The design and development of the single-axis PV module tracker is intended for laboratory testing. The user will be able to manually input angles for the optimal position of the solar panels considering the location of the sun, run an algorithm that calculates the optimal angle, and view a demonstrative panel sweep showing intended panel orientations of a single day in minutes. With this laboratory testing device, the user can test before implementing on a wide scale solar farm.
Considerations:
While designing the single-axis PV module tracker, durability, reliability, and accuracy were considered. For durability, it is important that the project be able to withstand rain and harsh weather. In addition, the keypad, LCD display, accelerometer, algorithm code, real-time clock, relay, and the user interface were carefully considered while making the final design.
Keypad:
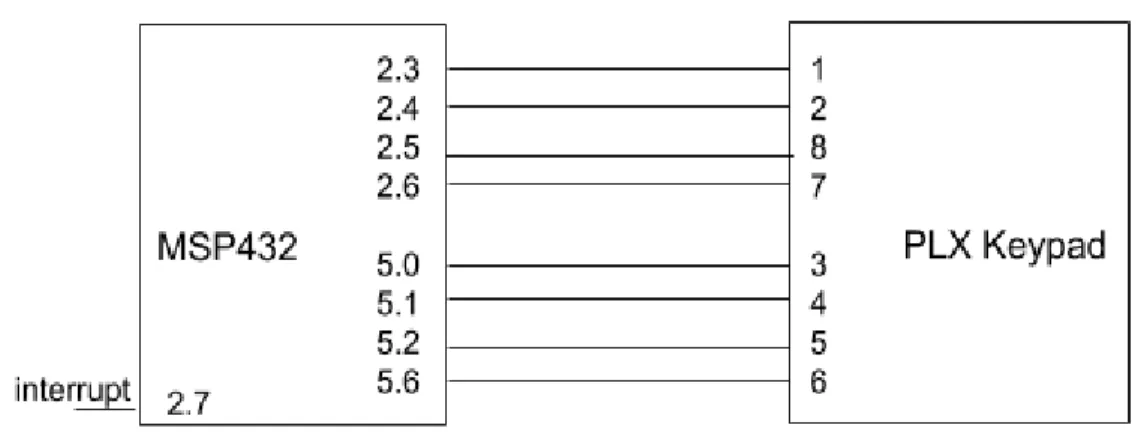
Figure 5.1: Keypad Pinout Diagram
The PLX16T20 is a 16 digit keypad used to make selections. The keypad has the digits 0, 1, 2, 3, 4, 5, 6, 7, 8, 9, A, B, C, . , *, and #. All of these digits allow the user to input numerical values for an angle and make selections. For more information on the dimensions and pins used for the keypad reference the product’s datasheet [8] and Appendix F respectively.
The letters on the keypad are used to select the three different modes the tracker has. Since there is no “Home” or “Enter” key, the “.” key is used for “Home” and the “#” key is used for “Enter”. It was important to consider the shortage of keys available, so no two keys would cause
confusion for the user.
The keypad is connected in parallel with the MSP432 microcontroller and is interrupt driven. The code is interrupt based rather than poll based to save memory and time of the
microcontroller. Once any key on the keypad is pressed, the microcontroller will save it into memory and perform the next steps regarding the specific key value.
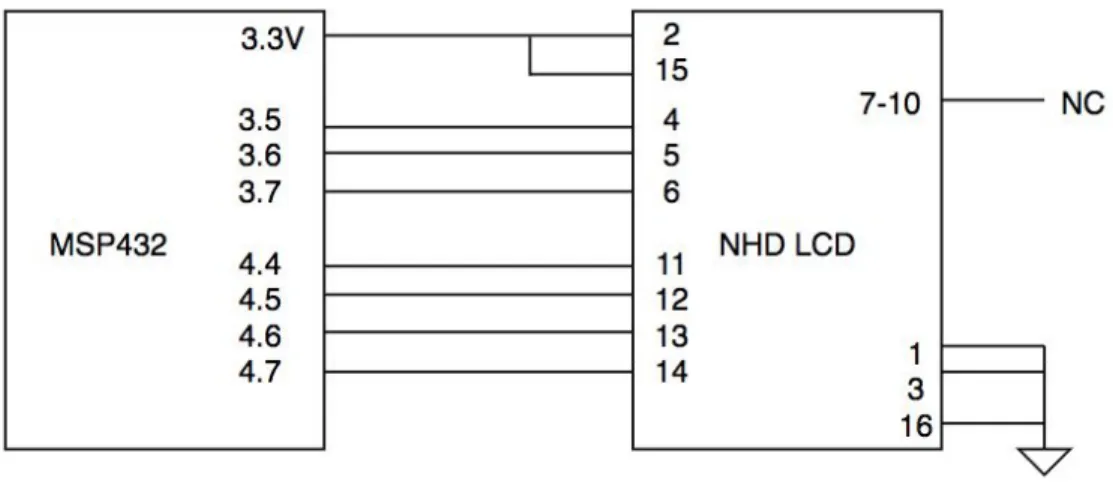
Figure 5.2: LCD Pin Diagram
The LCD display used is a 4x20 character display. To see the LCD in more detail reference the product’s datasheet[9] or view the physical device in the User Manual Appendix E. The LCD is used so the user can interface with, choose between the options and see the outputs of the code. Upon start up, the LCD will display a screen that prompts the user to input the date and time. Then they will be able to see the three mode options and select their option using the keypad. The LCD will showcase the results of the code depending on the selected mode. Within the Manual entry mode, the user will be able to see their own desired angle input as well.
Accelerometer:
Figure 5.3: Accelerometer Pin Diagram
The MMA8452 Accelerometer is used to measure and return the current angle of the solar panel. For information about the specifics and intricacies of the module, reference the product’s datasheet [10]. Accelerometers are often used to measure static angles in embedded system applications. This specific accelerometer communicated to the MSP432 through an I2C interface. The output of the system follows a semi-sinusoidal curve which can be used to convert the digital output to a decimal angle.
By dissecting the datasheet, we set the accelerometer to sample in 12 bits at 800 Hz in a 2g range. Using 12 bits provides the highest resolution, 800 Hz is the quickest sample time, and 2g is the smallest range that we need as we are only measuring from -1g to 1g (g corresponds to 9.8m/s2 or the acceleration due to gravity).
Next, we need to convert the digital 12 bit output to an actual angle in the most efficient, accurate, and repeatable manner. Through a series of testing described in Chapter 6, we concluded that a fourth-order polynomial function was the best to convert the value: y = 3.07E-11x4+3.97E-08x3-3.32E-05x2+4.64E-02x-3.410E-04. These coefficients were found using
Excel’s Line of Best Fit tool. Now that we can report a single angle value, we must make sure the output is precise. To accomplish this, we took 27 measurements (the minimum number of measurements to get very accurate and precise data) and sorted the values using an inplace sorting function. Then, we selected the three median values and found their average. This average value was returned to be used by the rest of the system. Finally, the resulting angle was converted to a string to be used to print to the LCD.
It is absolutely paramount that the user mount the accelerometer in the proper manner. When the solar panel is completely flat, the angle measurements should be 0 o. To achieve the 180o range
while also preserving this constant, the accelerometer would actually be vertical when the solar panel is completely flat. View Figure 6.3 to observe the intended orientations with the corresponding assigned angle.
User Modes:
The three different modes the module runs are: Manual, and Algorithm, and Demo. Manual allows the user to input a specific angle. Demo will tilt the panels as a timelapse-style motion from -60o to +60o as a demonstration. The algorithm mode is more complex and takes into
account the date, time, and location to calculate the desired angle for the solar rays to be perpendicular to the solar panels.
For our purposes, the location is preprogrammed to have the longitude and latitude for San Luis Obispo, CA. Upon start up, the user will input the current date and time, and the algorithm will calculate the expected angle at which the solar panels would be perpendicular to the sun rays.
First, the program will convert the date to the day number, and the time to solar time. In order to find the desired angle(beta), the declination, hour angle, altitude, and azimuth are needed. The equations are shown below to find each parameter.
eclination 23.45 in( daynumber 80))
D = *s 365360
* ( −
ourAngle 15 12 olartime)
H = * ( −s
ltitude rcsin[(sin(Declination) in(Latitude)) (cos(Declination) os(Latitude) os(HourAngle))]
A =A *s + *c *c
zimuth [sin(Altitude) in(Latitude)] [ ]
A = *s − cos(Altitudesin(Declination)*cos(Latitude) )
, where
eta rccos( )
b =a
1+b2
0.598 +−1 √b4−(0.598 −1)−2 *b2
b
=
tan(Altitude)
sin(Azimuth)
Once the desired angle is calculated, the program will run until the accelerometer has reached that angle. This code will run once every minute. We decided to run it once a minute because the sun’s position does not change dramatically over a minute, and it is easier for the microcontroller to run that code than handle code with arrays. Running once a minute rather than any sooner also ensures better battery performance over a single day test time frame.
RTC:
The RTC or Real-Time Clock is a built-in module to the MSP432. For details on configuration and initialization, please refer to the MSP432 reference manual [7]. The RTC conveniently keeps track of the time where it sends an interrupt every minute that passes. It also updates the corresponding registers to reflect the current time. On the system initialization, the user enters the current time. From there, the module will keep track of time (also adjusting for leap years) until the system is powered down. Using this, we can access all times throughout the day. This then becomes the only input necessary to calculate angles for solar tracking specifically in the Algorithm mode.
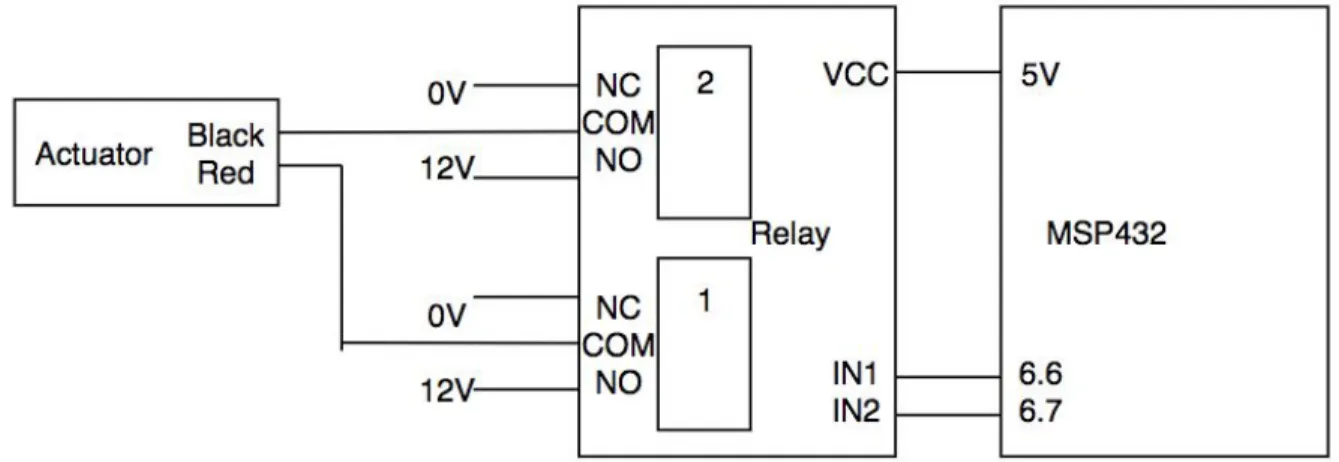
Relay:
The 2 Channel 5V Relay acts as an intermediary device between the MSP432 and the 12V Actuator. The actuator and relay are the two devices that also interface our smaller system with a full size single axis solar panel. When the MSP receives a desired input angle, whether from the user, algorithm, or demonstration predefinition, it checks if the current position of the accelerometer is equivalent. If the accelerometer position is not at the desired angle, it sets either Pin 6.6 or Pin 6.7 to 5V, as shown in Figure 5.4, depending on which direction the actuator needs to move. If Pin 6.6/IN1 is 5V, the actuator moves “out”, and if Pin 6.7/IN2 is set to 5V, the actuator moves “in.” The relay operates by toggling the COM switch to either 0V or 12V depending on the MSP motion logic according to the datasheet[11].
Figure 5.4: Relay Pin Diagram
To preface the following four software flowcharts, we want to emphasize that these are all very high-level descriptions. For example, blocks containing the phrase “get user input” consist of dozens of lines of code and integration between various peripherals. Additionally, software flowcharts look inherently linear. However, to build a robust User Interface, much of this linearity is actually more circular. As the system enters the super loop presented in Figure 5.5, the system acts more similarly to a finite state machine than any linear flow. The system continually cycles, checks for, and handles system updates while presenting the user an easy to and informative interface.
The primary function of the code highlighted in Figure 5.5 is to initialize all peripherals and prepare to launch the primary super loop where the system will spend the majority of its life. This preparation includes configuring the peripherals to work ideally for our solar tracking application and populating RTC registers with user time and date input.
Figure 5.6: Software Flowchart for Home Mode
Figure 5.7: Software Flowchart for Manual Entry Mode
Although Figure 5.7 looks simple, the Manual Entry mode is the most programmatically
Figure 5.8: Software Flowchart for Algorithm Testing
function (Algorithm_GetAngle_Double) to return a different angle. The system will work flawlessly with any algorithm. The user simply has to change the algorithm in the Algorithm.c file (only a single change required). This adds tremendous flexibility to this testbench as a whole and offers future users endless ways to optimize and add to this project.
Moving forward, this portion of the code uses every single peripheral. It continues to use the keypad and LCD as the user interface, accelerometer to measure the angle, relay to move the panel, RTC to gather time and date information, and algorithm to calculate the new angle based on the RTC. After every minute passes during the hard-coded active time, the system calculates the new angle the panel should be at and moves the panel toward that angle. This continues until the new angle is successfully achieved. All the while, the user interface displays exactly what the system is doing. The user can exit this mode at any time by pressing the home button as long as the solar panel is not currently moving.
The Demo mode shown in Figure 5.9 is the simplest mode. The system continuously moves the panel from +60o to -60o. As a result, this mode can be used to stress test the moving mechanisms
Chapter 6 - Testing
The testing section describes system performance from early stages of system testing to final system performance upon project completion. This project includes both software and hardware components, and the system underwent many iterations and alterations to achieve optimal performance.
Keypad and LCD Testing:
The first physical design implementation included integrating both the NHD Liquid Crystal Display Module and the PLX Series Weatherproof Keypad with the TI MSP432 Microcontroller in parallel. Individually, Keypad integration utilized the Code Composer Serial output, analyzing key testing parameters like de-bouncing, timing, and accuracy. The LCD Display itself tested under individual cases, writing static screens to the MSP in the code itself. Key testing parameters include accuracy and brightness. With the MSP functioning as our central processing unit, our team then integrated the two systems such that the keypad output interpreted, by the MSP, functions as the LCD inputs. Because the final result of this project is based highly on user interfacing, the solution needs to quickly, accurately, and consistently interpret keypad button presses to both be stored as data and be displayed for the user. Physical connections for these two components with the MSP are shown in Figure 5.1 and Figure 5.2. Images of the physical Keypad and LCD are shown below:
Figure 6.1: Keypad and LCD
RTC Testing:
The Real Time Clock module testing included following the MSP432 Reference Manual to
RTC did not undergo design iterations, and is successfully used in the Algorithm Mode, where current time is displayed on the LCD itself.
Accelerometer Testing:
The BOB-13926 Accelerometer testing was highly integrated with its conversion steps. Obtaining accurate and meaningful data included finding the fastest and most accurate way to massage raw data from the accelerometer’s I2C interface into data to be stored and later displayed to the user via the LCD. The MSP reads a 12-bit output from the accelerometer, which we needed to then characterize via a type of function to arrive at a corresponding angle value.
Initial research and tests tried to subject the 12-bit outputs to versions and iterations of
trigonometric functions. The accelerometer output over its range of motion follows a
semi-sinusoidal path, so we initially used sine functions to interpret the data. Manually testing out angle readings from the accelerometer, we were able to compare exactly how well calculated angles matched the accelerometer’s physical orientation. With both individual and stacked trig functions, we observed high percent error calculations.
Though the panel needs the most precise angle calculations from the approximately -45o to +45o
positions to follow the sun, this system wanted to see accurate angle measurement and reading from -90o to +90o operation to serve the test bench functionality of its future uses. The final
testing setup included taking raw data from the accelerometer from the -90o to 90orange, plotting
its path in Excel, and creating a fourth-order polynomial line of best fit. This polynomial is included in Chapter 5, and is the truncated version of an extremely precise formula. This setup resulted in monumentally lower percent error calculations and more consistent readings overall.
+90o orientation 0o orientation
Figure 6.2: Accelerometer Orientation
Relay Testing:
Testing the 2 Channel 5V Relay included an initial characterization of the relay as a device. To power the 12V actuator, we connect to a test bench power supply as shown in the pinout diagram in Figure 5.4. The MSP puts a 5V high or 0V low signal on two of its own output pins. These pins are set by the logic described in the Relay initialization of Chapter 5. When only IN1 of the relay receives the MSP 5V signal, the com port closes and receives the 12V signal, pushing the actuator “out”. Alternately, when IN2 of the relay receives the 5V signal, the actuator pulls “in”. This logic was theorized and tested in full. We also determine exhaustively that IN1 and IN2 can either be both logic 0V or both 5V to hold a constant position, which equates to holding a constant angle when connected to a full single-axis solar panel.
Mode Testing:
The final test bench includes three operational modes of angle-panel testing described below. Each of the modes also featured software design iterations, detailed in the following sections. Each mode also featured minor bug fixes including updates to cursor locations, RTC clock checks, and screen choices that are not listed below.
Manual Input:
Testing the manual input mode requires full functionality from the keypad, LCD, accelerometer, and MSP. The user inputs their desired angle and confirms it using the # key. From this point, we utilized the Code Composer debugger to verify the MSP was consistently checking the current angle, updating the LCD angle displayed, and sending the relay pins high or low depending on the current angle status. We confine the input range from -90o to +90o. These are the angles we
choose to reset the Manual Entry mode so that a user can easily test another desired angle. We also include access to the home button that allows the user to stop all aspects of the Manual Entry mode and return to the home screen. This was also the primary mode where we tested the accuracy of the accelerometer to MSP to LCD readings. This was the only mode we were able to fully test with the 5V Relay and 12V actuator as it was the first mode we built and finalized.
Algorithm:
The algorithm mode was the last mode we finalized and tested. This mode uses a Matlab-based system to get the RTC current time and day to determine an ideal angle for the solar panel. Having the Matlab test code available meant that once we adapted the code for the MSP, we could easily test the accuracy of the MSP in now calculating the desired angle. Testing for this included both a step-by-step viewing of the calculations within the software and verifying the final LCD display. From there, the MSP would operate in the same way as the Manual Input Mode, checking if the accelerometer has achieved a goal angle position and moving the actuator until it has.
Figure 6.1 shows the optimal panel angle throughout the day on the 18th of November. The blue line is the real time, actual angle we wish to track, the red line shows the ideal angle for solar time, and the green line is the optimum angle if there were no shade.
Demonstration:
Chapter 7 - Conclusion and Future Work
Conclusion:
Although the COVID-19 Pandemic hurt the final integration of all systems, the project still met the majority of expectations. The final system and all peripherals could not be mounted on to a solar panel, but all the systems work well and can be easily tested once health concerns dissipate.
On the whole, the entire system cost $161.47. This is well under budget especially for the practicality. The overall Solar Tracker System features a robust and bug-free user interface. Of course, this is contingent on the user actually using the system as directed in the User Manual. The only other bugs procured during final testing were due to faulty jumper cables. Specifically, the I2C communication between the MSP432 and the accelerometer sometimes faltered due to shoddy jumper cables. Additionally, the system provides three distinct modes that can each help in the development and testing of Single-Axis solar tracking. Let’s evaluate them one by one.
First, the Manual Entry mode can be used to develop new algorithms. In this mode, the user enters an angle and the system moves the solar panel to that angle plus or minus 0.25 o. As a
result, the user can move the solar panel to any angle between -90 oand +90o at any time. Please
refer to the accelerometer section for how to properly mount it in correspondence to the panel.
Next, the Algorithm mode can be used to test out any algorithm the user desires. Currently, the system is pre-loaded with a Solar Tracking algorithm provided by Professor Dolan. To change the algorithm, simply modify the code in the Algorithm.c section. The user only needs to modify a single function, and the new algorithm will run seamlessly.
Finally, the Demo mode can be used to stress test the mechanisms that actually move the solar panel. This type of stress test is critical before long-term mass deployment. As a result, the system provides a complete package in Solar Tracking Algorithm development.
Future Work:
For future implementation, the Laboratory Single-Axis PV Module Tracker, would ideally be placed on a solar panel in order for laboratory testing. Due to unforeseen circumstances and limited sources, the module tracker was unable to be put directly on the solar panel. However, once implemented on the actuator of the solar panel, the device will be able to control the tilt
angle. One improvement that could be made on this project would be to solder each wire
connection to minimize I2C communication errors. Other improvements would be in the design and build of the overall project, as well as possibly including more modes to test.
References
[1] V. P. Anand, O. B. Priyan, and B. Pesala, “Effect of shading losses on the performance of solar module system using MATLAB simulation,” in IEEE 2nd International Conference on Electrical Energy Systems (ICEES) 2014, Chennai, India, January 7-9, 2014, [Online]. DOI: 10.1109/ICEES.2014.6924142.
[2] P. Domorand and M. Averbukh, “Partial shading problem solution for solar arrays fed by MPPT via permanent monitoring of individual panels,” in IEEE 28th Convention of Electrical and Electronics Engineers in Israel, December 3-5, 2014, [Online]. DOI: 10.1109/EEEI.2014.7005767.
[3] “Cal Poly Gold Tree,” greenpowermonitor.com, 2019. [Online]. Available:
https://web3.greenpowermonitor.com/application/#/adminReports/3387. [Accessed Oct. 19,
2019].
[4] D. Schneider, “Control Algorithms for Large-scale Single-axis Photovoltaic Trackers”, Institute of Imaging and Computer Vision, Aachen University: May, 2012.
[5] Suncore Photovoltaics, Inc. (Irwindale, CA), J. Sherman, ‘Solar Tracking System’, 8946608, 2015.
[6] A. Mey, “Most U.S. utility-scale solar photovoltaic power plants are 5 megawatts or smaller”, US Energy Information Administration, EIA: February, 2019.
[7] Texas Instruments, “Microcontroller LaunchPad,” MSP432P401R datasheet, March 2015 [Revised March 2018].
[8] Storm Interface. “PLX Series - 16 KEY TELEPHONE FORMAT,” PLX16T20 datasheet,
November 2008.
[9] Newhaven Display International, “NHD-0420H1Z-FSW-GBW-33V3,” Character Liquid Crystal Display Module Datasheet, November 2017.
[10] NXP Semiconductors. “MMA8452Q, 3-axis, 12-bit/8-bit digital accelerometer,” MMA8452 datasheet, April 2016.
APPENDIX A - ANALYSIS OF SENIOR PROJECT DESIGN
Project Title: Design and Development of Laboratory single-axis PV Module Tracker
Students’ Name: Delaney Berger, Avishek Maitra, Helen Rice
Students’ Signature:
Advisor’s Name: Dale Dolan Advisor’s Initials:
Date: 12/13/219
1. Summary of Functional Requirements
The single-axis PV Module Tracker system allows users an effortless way to test various algorithms to ultimately determine the best way to avoid inter-row shading and maximize power output. The system will allow characterization of specific existing algorithms as well as newly customized algorithms in order to inform students on critical solar tracking characteristics. Additionally, the system will provide the flexibility to test algorithms before they are deployed on a large scale.
2. Primary Constraints
Describe significant challenges or difficulties associated with your project or implementation.
The single-axis PV Module Tracker system is limited by the algorithm that takes into account the maximum angle of the motors. The location and orientation of the solar panels combined with the single-axis tracking motors limits the angle of rotation for each panel. The difficulties will be in creating an algorithm that maximizes the angle of rotation while minimizing the amount of inter-row shading. Difficulties also include finding a durable, weather-proof material external housing structure for test equipment and angle measurement device. Finally, students design a user interface that is easy to use while displaying important information in an organized manner. The display and interaction with the system will provide the bulk of complexity to the embedded system. Testing dates must be chosen in accordance with viable weather conditions for testing.
3. Economic
When and where do costs and benefits accrue throughout the project’s lifecycle?
As mentioned previously, the costs are largely upfront with development hours. Afterwards, the primary cost will be manufacturing the actual product. This cost will accrue as long as the product is sold. The financial and environmental benefits will be seen as soon as the product is finished and deployed in May 2020. Cal Poly students will immediately be able to test a variety of solar-tracking algorithms to determine which is the best for their specific application. This benefits the environment as more renewable energy will be produced.
What inputs does the project require? How much does the project cost? Who pays?
The inputs required in the project are development hours and specific hardware including sensors, and MCU, and a power driver. The total cost of the project is not expected to exceed $350.Additional equipment costs, including labor and overhead, equal $12,821.47.
How much does the project earn? Who profits?
The final project ultimately earns its worth through the additional power output. The system will be testing and determining ways to minimize inter-row shading. It will be an interface for users to continually test different methods to control panel movements. This project specifically will be used in a laboratory setting to help justify the Cal Poly and other solar farms to update their systems. As a result, the Cal Poly Solar Farm or any solar farm that is able to update their systems designed on the test system will profit in higher energy outputs. The project also encourages technological advancements from students and professionals in the solar production industry.
Timing
Original estimated development time (as of the start of your project), as Gantt or Pert chart
What happens after the project ends?
A successful project-end produces a unified algorithm running on a pair of solar panels that shows the benefits in terms of additional power output in a laboratory setting.
4. If manufactured on a commercial basis:
Estimated number of devices sold per year Estimated manufacturing cost for each device Estimated purchase price for each device Estimated profit per year
Estimated cost for user to operate device, per unit time (specify time interval)
The embedded system, once created, will be easy to use in a variety of two-panel test setups. Any customer looking to test a newly developed or existing algorithm to implement on a larger scale will find value in this product. With a viable and profitable proof of concept testing interface model, expectations include a high demand for the full embedded system so existing solar farms will have a way to test algorithms in a laboratory setting. Since there are about 2,500 US solar power plants, we expect to sell approximately 250 systems a year [6]. Based on the cost of parts and components, the system would cost approximately $13,001 to manufacture, minus the initial team labor, summing to approximately $761. In order to compensate the engineers properly and make a sizable profit the purchase price for each test system should cost at least $1000 for buyers. Thus, the profit per year would be $250,000.
5. Environmental
Describe any environmental impacts associated with manufacturing or use, explain where they occur and quantify.
Which natural resources and ecosystem services does the project use directly and indirectly? Which natural resources and ecosystem services does the project improve or harm?
The negative natural impacts occur when manufacturing the parts for the overall product. This primarily consists of fabricating the silicon components (microcontroller) and the LCD. Secondly, the weatherproof housing will most likely be made of ABS or PETG (primary weatherproof materials) which are both petroleum-based. The use of petroleum-based materials as well as creating silicon-based products will contribute to climate change as both these processes emit greenhouse gasses. However, the positive impact on the environment will outweigh the negative impact on the environment.
The impacts of this project will benefit the environment. By providing solar plants a way to test a variety of solar tracking algorithms before implementation on a large scale, the most efficient algorithm (in terms of power production) can be chosen. Choosing the right algorithm for the specific solar farm environment will drastically increase the overall power output. By increasing the overall power output, communities can rely more heavily on solar power instead of a nonrenewable energy source leading to lower greenhouse gas emissions.
Finally, this product may indirectly increase the proliferation of solar farms. Unfortunately, solar farms take space to employ. If more solar farms were created in natural habitats, it would displace the flora and fauna that currently live there. As a result, this product may indirectly cause displacement for some animal and plant life that live in sunny, flat areas.
6. Manufacturability
Describe any issues or challenges associated with manufacturing.
The bulk of the manufacturing process exists in creating the test bench interface for users to input their means of tracking angle. The challenges students foresee include defining the test system algorithm. It should be able to integrate a variety of user tests, be dynamic, and run tests independently. Once a set of algorithms has been tested, optimized, and finalized, future possible manufacturing costs will be related to external hardware.
7. Sustainability
Describe any issues or challenges associated with maintaining the completed device or system. Describe how the project impacts the sustainable use of resources.
Describe any upgrades that would improve the design of the project. Describe any issues or challenges associated with upgrading the design.
accelerometer, LCD display, and external housing system. These components, especially the electronics, have the capability to become e-waste. Students intend for the project to be used by future students to test panel algorithms. Should components reach the end of their lifetime, students will take care to properly dispose of or recycle these components at the end of the project lifetime. In addition, students aim to utilize a recyclable material for containment of test equipment to maintain a sustainable project.
8. Ethical
Describe ethical implications relating to the design, manufacture, use, or misuse of the project. Analyze using one or more ethical frameworks in addition to the IEEE Code of Ethics.
The first IEEE Code of Ethics states: “to hold paramount the safety, health, and welfare of the public, to strive to comply with ethical design and sustainable development practices, and to disclose promptly factors that might endanger the public or the environment.”
The purpose of the system is to test different algorithms in order to minimize carbon footprint by maximizing the power output of the corresponding solar farms. A possible misuse of this project is if the solar farm is powering a facility that is harmful to society. To accommodate the IEEE code of ethics, the implementation of the algorithm on solar farms will allow the facilities utilizing the power to be more sustainable. The system is also valuable for others to test different algorithms and understand the effects of shading and orientation of solar panels.
9. Health and Safety
Describe any health and safety concerns associated with design, manufacture, or use of the project.
If the system is unable to correctly execute the algorithm with the desired tilt, then potential safety risks may occur when implementing the algorithm on a physical solar farm. The lab system may work correctly, but it could be possible that on the physical solar farm, the algorithm responds differently. When designing, manufacturing, and using the system, it is imperative to follow lab safety guidelines. In addition, as previously mentioned in the Environmental section, manufacturing silicon and petroleum based products harm the environment. More directly, they harm the workers directly involved in the production process as they are closest to the chemical fumes these processes emit.
10. Social and Political
Describe social and political issues associated with design, manufacture, and use.
The direct stakeholders are Cal Poly’s students and faculty, specifically those who have an interest in solar energy. This laboratory Single-Axis PV Tracker will help students learn about common solar tracking principles as well as design and test new algorithms to track the sun.
11. Development
Describe any new tools or techniques, used for either development or analysis that you learned independently during the course of your project.
Upon the completion of this project, we expect to gain vast and intricate awareness and knowledge about mathematical modeling of a physical space. The first steps of our process include adapting data collection into a functional model. This model will translate directly into algorithm inputs as panel rotation magnitude and frequency of motion. We will also become familiar with testing methods for finding optimum frequency of rotation along with mathematical modeling of rotational optimization based on power supply of panel motors. These inputs surmise the algorithm’s bulk, where we will quickly become familiar with the algorithm and its inputs to be easily adjustable.
APPENDIX B - LITERATURE SEARCH
Book:
K. Jager, I. Olindo, et al. Solar Energy. Delft, ND: Delft University of Technology, 2014. This book explains the fundamentals of solar energy and solar panels. The book starts with the theory of electromagnetic waves, jumps into semiconductor physics, and finishes with proper implementation of solar farms. As a result, this is a very valuable reference very almost every step of the project. The book has significant authority as it was written
and published by a world-renowned university specializing in technology and
engineering. Five different professors contributed to the textbook showing its depth and variety of perspectives.
Patent:
Suncore Photovoltaics, Inc. (Irwindale, CA), J. Sherman, ‘Solar Tracking System’, 8946608, 2015.
This patent explains the methods used for a solar cell array to track the sun. This source used a specific method to track the sun used a software algorithm, and it includes useful block diagrams. The source is credible due to the publishing date being in 2015.
IEEE Journal:
V. P. Anand, O. B. Priyan, and B. Pesala, “Effect of shading losses on the performance of solar
module system using MATLAB simulation,” in IEEE 2nd International Conference on
Electrical Energy Systems (ICEES) 2014, Chennai, India, January 7-9, 2014, [Online]. DOI: 10.1109/ICEES.2014.6924142.
This IEEE conference paper clearly justifies the need for an accountability system that reduces if not eliminates shading on solar panels. It contains important data regarding PV characteristics and efficiency of panels under different conditions. The article also explains the creation of a MATLAB model of a multi megaWatt farm, a perfect reference size for Cal Poly’s 4.5 MW farm. A similar matlab model to streamline our data collection process once in the testing phase. This source is credible due to its entrance into an official IEEE conference and resubmission to IEEE database months later.
P. Domorand and M. Averbukh, “Partial shading problem solution for solar arrays fed by MPPT via permanent monitoring of individual panels,” in IEEE 28th Convention of Electrical and Electronics Engineers in Israel, December 3-5, 2014, [Online]. DOI: 10.1109/EEEI.2014.7005767.
encourages our group to continue research because the positive power output changes from optimizing panel placement provides an efficient solution.
A. Bidram, A. Davoudi and R. S. Balog, “Control and circuit techniques to mitigate partial shading effects in photovoltaic arrays,” Photovoltaics, IEEE Journal of 2(4), pp. 532-546. 2012. This IEEE journal article does a good job at characterizing Maximum Power Point Tracking techniques, which will be valuable when characterizing our own power tracking systems for our test panels. This article was cited in numerous other articles surrounding the topic of solar power maximization.
Data Sheet:
Texas Instruments, “Microcontroller LaunchPad,” MSP432P401R datasheet, March 2015 [Revised March 2018].
Datasheet for the microprocessor that will be used to implement the algorithm used for the single axis solar tracking system. The datasheet was taken directly from Texas Instruments’ website.
Other:
“Cal Poly Gold Tree,” greenpowermonitor.com, 2019. [Online]. Available:
https://web3.greenpowermonitor.com/application/#/adminReports/3387. [Accessed Oct. 19,
2019].
This website will be used to analyze the output power directly from Cal Poly’s Solar farm. Students will be able to analyze the shading and landscape issues with the solar panels.
K. Das, H. Ghosh, and M. Sengupta, “Single Axis Solar Tracking System using Microcontroller (ATmega328) and Servo Motor,” Dept.of ECE, Sur Degree Engineering College. Kolkata, India. June 6, 2016.
This article explains the methods and ideas used for programming an Arduino Uno for real time monitoring solar position. Students can use this article when writing the algorithm for the single axis tracking. The article is credible because it was featured in the International Journal of Scientific and Research Publications, Volume 6.
D. Schneider, “Control Algorithms for Large-scale Single-axis Photovoltaic Trackers”, Institute of Imaging and Computer Vision, Aachen University: May, 2012.
This publication from Aachen University explains how to implement an algorithm
theory behind basic solar panel tracking by using Lambert’s Law as a basis and deviates from it using a customized algorithm with a backtracking emphasis. The publication has authority because it explicitly uses mathematical calculations to highlight why the algorithm deviates from previously established solar tracking methods. On top of that, it references eleven other academic publications for peppered proof throughout the text.
F. Sadeque and Q. Ahsan, “Design and Implementation in Single-Axis Automatic Solar
APPENDIX C - CODE COMPOSER STUDIO CODE
The code base is too large and unwieldy to simply cut and paste. The code, instead, can be found in the GitHub link below. If you desire to make any changes, please clone the original and make the changes. Do not change the code in the original.
APPENDIX D - SOFTWARE FLOWCHART
APPENDIX E - USER MANUAL
See Appendix F for the pinout diagrams and connections.
Upon start up, the user will be prompted to input the current date and time, pressing “#” to enter and go to the next screen. Each time the module is powered back on, the user will need to input the current date and time. The code is hard coded for the location to be San Luis Obispo, CA.
The following screen should display a “Welcome!” message.
Then a screen showing three different modes: A: Manual
B: Algorithm C: Demo
The Manual mode allows the user to set their own desired angle for the solar panels. The
Algorithm mode will calculate the desired angle using the location, date, and time previously inputted. Lastly, the Demo mode will automatically move the solar panels from -60o to +60o in
the form of a timelapse.
In order to go back to the homescreen the user can press the “.” key on the keypad, but the running code must finish before returning to the homescreen.
If there is an I2C communication error, the program will eventually fix itself and return back to the homescreen.
APPENDIX F - PINOUT DIAGRAMS
Figure 5.1: Keypad Pin Diagram
Figure 5.2: LCD Pin Diagram
APPENDIX G - NOTES