The effect of linker histones on
force-induced nucleosome
unstacking
THESIS
submitted in partial fulfillment of the requirements for the degree of
BACHELOR OF SCIENCE in
PHYSICS
Author : Sven Schoonebeek
Student ID : 1692070
Supervisor : John van Noort
2ndcorrector : Thomas Schmidt
The effect of linker histones on
force-induced nucleosome
unstacking
Sven Schoonebeek
Gorlaeus Faculty Office
Einsteinweg 55, 2333 CC Leiden, The Netherlands
September 2, 2019
Abstract
The structure of chromatin plays a vital role in the regulation of gene expression. In this thesis, the mechanical properties of chromatin are
investigated by measuring force-extension curves with Magnetic Tweezers. Two models are re-introduced that accurately describe these
curves. Upon adding linker histone H1, a protein that can bind to individual nucleosomes, stabilization of nucleosome unstacking up to 10 pNwas observed. Varying the Nucleosome Repeat Length (NRL) of the chromatin fibers with linker histones resulted in different degrees of stabilization: 168NRL fibers have a higher energy barrier for unstacking
than 197NRL fibers. This could be caused by increased nucleosome stiffness at lower NRLs. This difference could have an important effect on
Contents
1 Introduction 1
1.1 Genomic architecture 1
1.2 The nucleosome: a dynamic structure 2
1.3 Linker histones 2
2 Theory 5
2.1 Statistical mechanics 5
2.2 Nucleosome dynamics 8
2.2.1 High-force nucleosome unwrapping 8
2.2.2 Non-equilibirium nucleosome unstacking 10
2.2.3 Single molecule force spectroscopy 11
3 Methods 13
3.1 Methods 13
3.1.1 Flowcell preparation 13
3.1.2 Magnetic Tweezers 16
3.1.3 Sample preparation 17
4 Results 19
4.1 Flowcell protocol optimalization 19
4.2 Chromatin 19
5 Discussion 27
6 Conclusion 31
Chapter
1
Introduction
1.1
Genomic architecture
In eukaryotes, genetic information is stored in the cell nucleus as DNA. The complete human genome contains approximately 3 Gbpof DNA [8], which equals a stretched length of over 1 meter. Storing genetic informa-tion in an unfolded manner would impart efficient gene localizainforma-tion and transcription regulation. Moreover, DNA would be more vulnerable for damage. In order to store genetic information in an efficient and organized way, DNA is subjected to several folding mechanisms [9]. At the primary level, 146 basepairs (bp) of DNA are wound left-handed 1.65 times around a histone octamer core. The histones are a family of highly alkaline pro-teins, which enables them to buffer changes in environmental acidity [10]. The histone octamer (HO) consists of a H3-H4 tetramer and two H2A-H2B dimers, where H3, H4, H2A and H2B are the canonical core histones. The DNA-HO complex is called a nucleosome [11]. Approximately 50 bp of DNA seperates the individual nucleosomes, the linker DNA. The structure of chromatin has been researched by electron microscopy (EM). However, the structure is highly dynamic and is mainly influenced by interactions between nucleosomes [16]. This makes a structural analysis with EM dif-ficult.
ana-lyze the low force equilbrium regime and the high force non-equilibrium regime.
1.2
The nucleosome: a dynamic structure
The structure of the nucleosome has already been investigated extensively, and has been shown to be highly dynamic just like chromatin. For exam-ple, nucleosomes can spontaneously unwrap part of their DNA from the HO [12]. These nucleosome dynamics are closely related to transcription modulation, and alterations to nucleosome structure can therefore affect DNA accessibility. There are three known ways in which the nucleosome structure can be altered. First, histones can be chemically altered by his-tone modification enzymes which will change the free energy landscape of HO-DNA interactions [13][15]. A few well-known enzymatic alter-ations include methylation, acetylation, ubiquitylation and phosphoryla-tion of histones. Second, the spontaneous wrapping and unwrapping be-havior enables nucleosomes to regulate occupancy of DNA-binding pro-teins. When the nucleosome unwraps, there will be more binding sites for the protein to bind to, increasing DNA accessibility [12]. Finally, the nucleosome can be altered by substitution of canonical core histones by histone variants. Histone variants that lack an acidic patch impede nu-cleosome stacking, which improves accessibility but also leaves the un-wrapped DNA unprotected [14].
1.3
Linker histones
1.3 Linker histones 3
Chapter
2
Theory
2.1
Statistical mechanics
To study the mechanical properties of chromatin fibers, models will be in-troduced to analyze chromatin fibers with and without linker histone H1. To analyze the force-extension curves of chromatin without H1, a model based on statistical mechanics is used. Statistical mechanics is a powerful tool that allows for description of systems in thermodynamic equilibrium consisting of a large number of components.
Because the chromatin fiber can be in a large number of states during the experiments, but will remain in thermodynamic equilibrium when low forces are applied and transitions are reversible, use of statistical mechan-ics is justified. The equation that will be used is the Maxwell-Boltzmann equation, which describes the average distribution of non-interacting par-ticles in different states, in a system which is in thermal equilibrium:
Pstate =
Dstate·exp
−
Gstate
kBT
∑
statesDstate
·exp−Gstate
kBT
(2.1)
In this equation, Pstate is the probability that a component will be in a
certain state,Gstateis the free energy of that state (kBT),Dstateis a factor that
accounts for the degeneracy of that state andkB is the Boltzmann factor.
Conformation Lwrap(bp) Li(bp) ∆Gcon f ormation(kBT)
Fully wrapped 147 NRL−Lwrap 0
Partially unwrapped 107 NRL−Lwrap g1
Singly unwrapped 80 NRL−Lwrap g1+g2
Fully unwrapped - NRL g1+g2+g3
Table 2.1: Used constants of the four different nucleosome conformations. The free energies of the transitions are roughlyg1 =19±2kBT,g2 =4.4±0.7kBT[3].
g3does not belong to an equilibrium transition and is manually derived.
important. It is already known that DNA extends under force according to a worm-like chain [2]:
zW LC(f,L) = L 1−
1 2
s
kBT f A +
f S
!
(2.2)
In this equation, the contour length L is the total length of the DNA strand in basepairs (bp), f is the applied force (pN), A is the persistence length of the strand (nm), and S is the stretch modulus (pN). The corre-sponding free energy (kBT) can now be calculated by integrating the
ex-tension over the force:
GW LC(f,L) = − f
Z
0
zW LC f˜,Ldf˜=−L f −
r
f kBT
A +
f2
2S
!
(2.3)
Chromatin fibers consist of single nucleosomes that can be in four dif-ferent conformations when they are subject to external force, as found by Meng et al [3]: a fully wrapped conformation, a partially unwrapped formation, a singly unwrapped conformation, and a fully unwrapped con-formation. Every conformation unwraps some DNA from the histone oc-tamer, which allows defining the contour length of this released free DNA. The contour lengths for the different conformations can be found in table 2.1, and a schematic overview of the different conformations is visualized in figure 2.1.
The different conformations of each nucleosome will extend under force according to 2.2. This allows for calculation of the extension for each con-formation:
2.1 Statistical mechanics 7
Figure 2.1: The four different nucleosome conformations as proposed by Meng et al [3]: fully wrapped (I), partially unwrapped (II), singly unwrapped (III) and fully unwrapped (IV). The free energies of the transitions can be found in table 2.1. This figure was obtained from Kaczmarczyk [7].
Each unwrapping event is also accompanied by a change in free energy ∆G, which is added to the free energy of the conformation:
Gcon f ormation(f) = GW LC(f,Li) +∆Gcon f ormation (2.5)
The different free energies corresponding to the transitions between conformations can be found in table 2.1.
Under lowest force, when nucleosomes are still arranged in a fiber, the linker DNA is constrained. This reduces the extension for each nucleo-some, which makes equation 2.4 non-applicable. It was found empirically that when all nucleosomes are stacked, the fiber behaves like a Hookean spring with fiber stiffnessk (pN/nm) [22]. Thus, the first conformation is best descibed by Hooke’s Law:
zf iber(f) = f
k +z0 (2.6)
Gf iber(f) = f2
2k (2.7)
The fiber can now be in astate =n1,n2,n3,n4, where there aren nucle-osomes in conformation i. Consequently, each state has a corresponding state extension which can be calculated by summing over the contribu-tions of all nucleosomes in each conformation, and adding the extension of the DNA handles at the flanks of the fiber:
zstate(f) =
∑
inizi+zW LC(f,Lhandles) (2.8)
Gstate(f) =
∑
iniGi+GW LC(f,Lhandles) (2.9)
The probability that a nucleosome will be in conformationiat a certain force f follows the Maxwell-Boltzmann distribution 2.1. Because some states can have the same free energy, a degeneracy factor calculated from a binomial distribution is needed to correct for this:
Dstate =
∏
i<j
ni+nj ni
(2.10)
Now the average extension of the whole fiber can be calculated by com-bining equations 2.8, 2.10 and 2.1, including the extension, degeneracy and probability of each state:
hztether(f)i=
∑
states
zstate(f)·Dstate·Pstate (2.11)
This allows for the complete modelling of the chromatin fiber at all forces when the tether is in thermal equilibrium and transitions are all reversible.
2.2
Nucleosome dynamics
2.2.1
High-force nucleosome unwrapping
2.2 Nucleosome dynamics 9
using a Z-score to quantify the deviation of the state extensionzstatefrom
the measured valuez(f)[3] [7]:
Zi(f) =
|zi(f)−zstate(f)|
σ(f) (2.12)
Whereσis the expected standard deviation (nm), which is the quadratic sum of the measurement error and the thermal fluctuations:
σ2 =σmeasurement2 +σthermal2 (2.13)
The measurement error depends on the mechanical background viba-rations and accuracy of the bead tracking software, and the standard de-viation in thermal fluctuations can simply be calculated from the equipar-tition theorem 12kBT = 12kσthermal2 . The local stiffnessk(pN/nm) is the stiff-ness of the tether evaluated for a single state, and depends on the force:
k = zstate(f +d f)−zstate(f)
d f (2.14)
Wherezstate(f)is the extension of a state at force f calculated by
equa-tion 2.8. The probability Pi that data point j belongs to a state i is then
calculated from the normal distribution by using the error function:
Pi(f) =1−erf(Zi(f)) (2.15)
To obtain the probability landscape, equation 2.15 is summed over all data points Pi(f) for all possible states in the entire measured
force-extension curve. The peaks in the probability landscape correspond to the states that most likely belong to stable unwrapping intermediates. Only states with a minimum of two datapoints were further processed.
Merging states
Implementing the Z-score analysis mentioned above often resulted into groups of datapoints which appeared wrongly divided into multiple nearby states. To correct for this, multiple states were merged, using the weighted average of neighboring states when the following criteria were met [20]:
1. Each of two original states must have at least 50% of the datapoints within 2σof the probability distribution of the merged state.
When these conditions were met, the datapoints are attributed to the merged state.
2.2.2
Non-equilibirium nucleosome unstacking
When linker histones are added to the chromatin fibers, force-extension curves show discrete unstacking steps below 10pN. This indicates that the unfolding of the chromatin fiber is no longer in thermodynamic equi-librium. The probability landscape obtained from equation 2.15 can also be used to identify these discrete states. However, important parameters of interest, such as the free energy change of the transition, cannot be cal-culated with equation 2.15. Instead, the transition rates between different conformations need to be taken into account explicitly.
Nucleosomes can spontaneously wrap (closed state) or unwrap their outer turn of DNA (open state), changing their conformation. The forward and backward rates at which this happens depends on the free energy dif-ference between two conformationsi,jand is described by the Arrhenius equation:
kij =k0exp
−
∆G
ij− f z kBT
(2.16)
Wherek0is the initial rate of passing the energy barrier (s−1) and∆Gij
is the free energy difference between the conformations in the directionij.
k0 is related to the rupture force of a nucleosome F∗ and the extension at the highest energy barrier of the transition∆zby [4][20]:
F∗ = kBT ∆z ln 1 N dF dt −ln
k0k∆BT
z
(2.17)
Where additional parameters are the number of nucleosomes left that are still in the closed stateN, and the pulling rate dFdt. By plotting rupture-forces as a function of the logarithm of the pulling rate in a similar fashion to Brower-Toland et al [4], insightful parameters such as k0, ∆Gij and ∆z
are recovered. Because the probability of a rupture will increase with de-creasing N, the logarithm in these plots is corrected by the nucleosome ratio factor:
No−N
N (2.18)
2.2 Nucleosome dynamics 11
2.2.3
Single molecule force spectroscopy
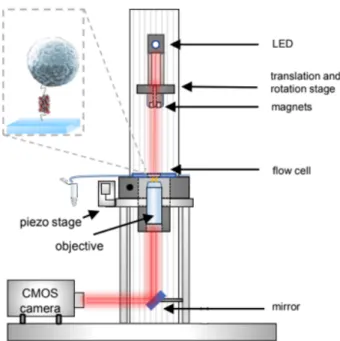
Magnetic Tweezers is a technique to manipulate single molecules by using single molecule force spectroscopy. The paramagnetic beads are subjected to an external magnetic force which will pull on the attached chromatin molecule. The biggest advantage of using magnetic tweezers over other force spectroscopy techniques, such as optical tweezers or atomic force microscopy, is the possibility to acquire data from multiple molecules at once [6]. A custom built setup was used to utilize the Magnetic Tweezer technique to generate force-extension curves of chromatin. The setup uses LED light (Lumitronix) to illuminate a sample of tethered beads. Diffracted light was collected by an oil-immersion objective (Olympus) and collected with a CMOS camera at 30 Hz. A more detailed description of the setup is provided by Kruithof et al [21], and a schematic overview of the setup is shown in figure 2.2. A LED is used to illuminate the beads imaged by a microscope, which will produce a diffraction pattern when the light of the LED falls through the objective. When a bead moves out of focus, the diffraction pattern will shift. This shift with respect to the focus is corre-lated to a reference image to obtain the change in position of the bead. This allows for nanometer-accurate position measurements in 3D. By lowering the magnet to the sample, it will increase the magnetic force on the bead. The magnetic force on the M270 2.8 µm beads was related to the vertical position of the magnet by fitting a double exponential function to it∗:
F(z) = 85·
0.7·exp
−
z
1.4
+0.3·exp
−
z
0.8
+0.01 (2.19)
Chapter
3
Methods
3.1
Methods
3.1.1
Flowcell preparation
A flowcell consists of small channels running between two slides of glass mounted on a frame. By flushing the sample into one of the channels in-dividual chromatin fibers can be tethered between on of the slides and a paramagnetic bead. spectroscopy can be performed on the sample. The following protocol was used to prepare flowcells for measuring in the Magnetic Tweezers [7].
1. Preparing the frame.
For new flowcell frames: put a 3mmsilicone tubing through the big holes in the flowcell. Use a scalpel to cut off the silicone tubing at the surface of the frame.
For used flowcell frames: remove the sticker and glass by rinsing the frame with acetone.
Clean the frame and flush all holes with acetone. Dry the frame and channels thoroughly with nitrogen gas.
2. Cleaning the coverslips.
Immerse 24 x 60 mm coverslips in isopropanol and sonicate for a minimum of 10 minutes in the ultrasonic cleaner. Immerse the 24 x 40 mm coverslips in isopropanol for 10 minutes. Afterwards dry the coverslips with a stream of N2 gas.
Put a single-sided sticker strip on the Cameo Silhouette sheet. Se-lect the custom template containing (multiple) holes on both sides connected by (multiple) channels. After the cutting is done, put a double-sided sticker strip on the sheet and select the custom tem-plate containing only the channel(s).
4. Assembling the flowcell.
Put the single-sided sticker with the holes on the frame, on the side with the big holes. The holes on the frame should overlap with the holes on the sticker. Turn the frame around and put the 24x40 mm coverslip on the sticker. Again, turn around and put the double-sided sticker on the single-double-sided sticker. The channels on both stick-ers should overlap. Finally, put the 24x60 mm covstick-erslip on the double-sided sticker. Use a pipettetip to gently push both coverslips against the stickers.
5. Incubation with anti-digoxigenin.
Prepare 150 of 10ng/ anti-digoxigenin dissolved in filtered phosphate-buffered saline (PBS) solution. Flush 150 into the flowcell, seal the channels with tape, and incubate for 2 hours at 4◦C. When there are multiple channels, divide 150 anti-digoxigenin solution equally over the channels. Prepare new 10ng/ anti-digoxigenin solution for ev-ery flowcell assembly. Do not put the anti-digoxigenin solution on the vortex. Mix slowly with a pipette, such that no bubbles arise.
6. Flowcell passivation.
Prepare 150 of 4% BSA (bovine serum albumin), 0.1% Tween-20 so-lution dissolved in HPLC water. Flush 150 of the 4% BSA soso-lution into the flowcell, seal the channels with tape and incubate for 2 hours at 4◦C. When there are multiple channels, divide 150 4% BSA solu-tion equally over the channels. Prepare new 4% BSA solusolu-tion for every flowcell assembly. Do not put the BSA solution on the vortex. Mix slowly with a pipette, such that no bubbles arise. The flowcell can be stored for up to one week at this point.
7. Washing the flowcell.
3.1 Methods 15
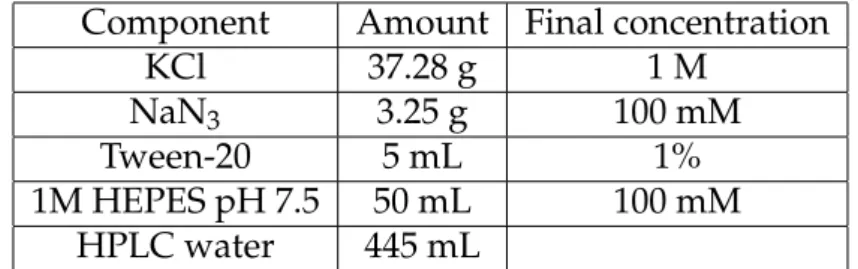
Component Amount Final concentration
KCl 37.28 g 1 M
NaN3 3.25 g 100 mM
Tween-20 5 mL 1%
1M HEPES pH 7.5 50 mL 100 mM
HPLC water 445 mL
Table 3.1:The components for preparation of 1 L of 10x pre-ESB buffer.
Component Amount Final concentration
10x pre-ESB buffer 1 mL 10%
20 mM MgCl2 1 mL 2 mM
4% BSA in HPLC water 0.5 mL 0.2%
HPLC water 7.5 mL
Table 3.2:The components for preparation of 10 mL of ESB(+) buffer.
The 10x pre-ESB buffer can be stored for maximally 1 month at 4◦C.
8. Preparing the sample.
Add approximately 20 ng of reconstituted chromatin fibers to 500 µL of ESB(+) buffer. Mix very gently with a pipette. Flush all 500µL gently into the flowcell. When there are multiple channels, divide the 500µL equally over the channels. One should consider flushing the chromatin into the channels in seperated measurement rounds, as this allows for more measurements per flowcell. Incubate for 10 minutes at room temperature.
9. Adding magnetic beads
3.1.2
Magnetic Tweezers
By relating the bead heigth to the force, a force-extension curve can be ob-tained for single chromatin tethers. The bead diffraction pattern was an-alyzed by using a 3D FFT tracking algorithm developed by Brouwer et al (Leiden University, in preparation). The following protocol describes how measurements were done using the setup [7]. The protocol is visualized in figure 3.1.
1. Cleaning and immersing the objective.
Clean the objective by using lens paper. Immerse the objective in a drop of oil.
2. Calibration of the magnet position.
Align the position of the magnet such that the longitudinal axis of the magnet is perpendicular to the longest side of the flowcell. Place a flowcell that has already been measured in the setup. Alternatively, it is possible to use the measurement flowcell for calibration, which will make the area near the magnet (along the longitudinal axis) un-usable for measurements, because it exposes tethers to high force. Start the setup: motors, LED and camera. Bring a single bead into focus using PageUp/PageDown (+ Shift) keys. Lower the magnet towards the top coverslip, until it just touches the glass. The bead diffraction pattern will change as a response to the slight bending of the glass. Move the magnet upwards in small (0.01 mm) steps, un-til the diffraction pattern returns to the initial state. The position of the magnet is calibrated as 0 mm by clicking the ’reset’ button in the LabVIEW interface. Move the magnet 15mm up. Remove the old flowcell and mount the measurement flowcell on the setup (when the measurement flowcell was used for calibration, move the mag-net one width along its transversal axis).
3. Calibration of the camera focus.
3.1 Methods 17
Figure 3.1:Finding and selecting beads with the LABVIEW software.A: a 3D FFT LABVIEW bead tracking algorithm developed by Brouwer et al (Leiden Univer-sity, in preparation) is used to detect bead diffraction patterns. B: the diffraction pattern depends on the vertical position of the bead. The diffraction pattern shift can therefore be related to the change in vertical position of the bead, which is the core of single molecule force spectroscopy. This figure was obtained from Kaczmarczyk [7] and altered.
4. Selecting beads.
Select or unselect beads by using Alt + Click. Unselect all beads at the corners of the FOV, clustered beads and beads that are moving out of their region of interest (ROI). If necessary, the ROI can be expanded a bit.
5. Executing the measurement.
Select or create a magnet trajectory. When selected, click ’run’. The trace will be executed by the LabVIEW program. When done, the po-sition data will be automatically saved by the LabVIEW program. To do another measurement, move the magnet ¿5 mm along its transver-sal axis.
3.1.3
Sample preparation
Figure 3.2: Bare DNA or chromatin fibers labelled with biotin and digoxigenin can bind to steptavidin and anti-digoxigenin groups. This figure was obtained from Janis-sen et al [23] and altered.
digoxigenin because it needs to have two distinct binding sites: one for the streptavidin group on the bead and one for the anti-digoxigenin an-tibody on the surface of the flowcell. Steptavidin has a very high affin-ity for biotin [23]. Figure 3.2 shows a schematic overview of the biotin-digoxigenin binding. DNA strands were digested using BsaI and BseYI enzymes (NE BioLabs). The digested DNA was labelled on the BsaI site with digoxigenin-11-ddUTP in presence of dCTP (Roche Diagnostics), and the BseYI site was labelled with biotin-16-ddUTP in presence of dGTP (Roche Diagnostics). Both labels were incorporated using Klenow frag-ments and Klenow reaction buffer.
The digested and labelled DNA was dissolved in a high salt buffer (2.5M NaCl, 1xTE) along with human recombinant histone octamer (EpiChy-pher) and pipetted into tubes with a membrane bottom. The DNA:HO ra-tio was varied from 1 to 2 over five different tubes to make sure the right amount of nucleosomes were formed in at least one tube. DNA-HO was the incubated overnight at 4◦C while a low salt buffer (1xTE) was pumped into the beaker at a rate of 0.9 ml/min. Mixed buffer was drained from the beaker at the same rate. The five different tubes were the stored at 4◦C for a maximum of five weeks [20] [7]∗.
Chapter
4
Results
4.1
Flowcell protocol optimalization
Before doing measurements on chromatin, the flowcell preparation proto-col stated in the previous section was optimized for force-extension mea-surements on DNA. Four different protocols were compared. The beads were first classified as either stuck or tethered (figure 4.1A). The tethered beads were divided into traces that rupture, traces that could be fitted with a WLC (equation 2.2), and beads showing behaviour that could not be identified (other). This is shown in figure 4.1B. The best protocol is the protocol yielding the most beads that could be fitted to a WLC.
Figure 4.1B shows that the differences in quality curves between the protocols are very small. Therefore, the fastest (4 hours of total incu-bation time) and most cost-effective (10ng/µL anti-digoxigenin) protocol was used for doing measurements on chromatin.
4.2
Chromatin
Reconstituted chromatin fibers were measured in the Magnetic Tweezers with and without adding H1. Data analysis was done with custom written Python software in 5 steps:
1. The offset of the bead was determined by fitting a worm-like chain (equation 2.2) to the datapoints above 20pN of the release curve.
Figure 4.1:2 hour incubation with antidig (10ng/µL) followed by 2 hour
incuba-tion with 4% BSA soluincuba-tion is the best flowcell protocol for DNA force-extension measurements. A: number of stuck beads and tethered beads (figure 7.2) as a fraction of the total beads.B: Number of tether ruptures, beads suitable for anal-ysis and other as a fraction of the total number of tethered beads. The suitable for analysis criterium was used to determine the best protocol by fitting extendable WLC’s (figure 7.1) to the data. Since the difference in quality curves between the different protocols is very small, the fastest and most cost-effective protocol was deemed best.
The fitting parameters are the total number of nucleosomesNtot, the
total number of tetrasomesNtet, the free energy difference of the first
transition g1 and the stiffness of the fiber k. The free energy of the second transition g2, was fixed at 5.5kBT. The bead offset value z0 from previous step was used as a fixed parameter.
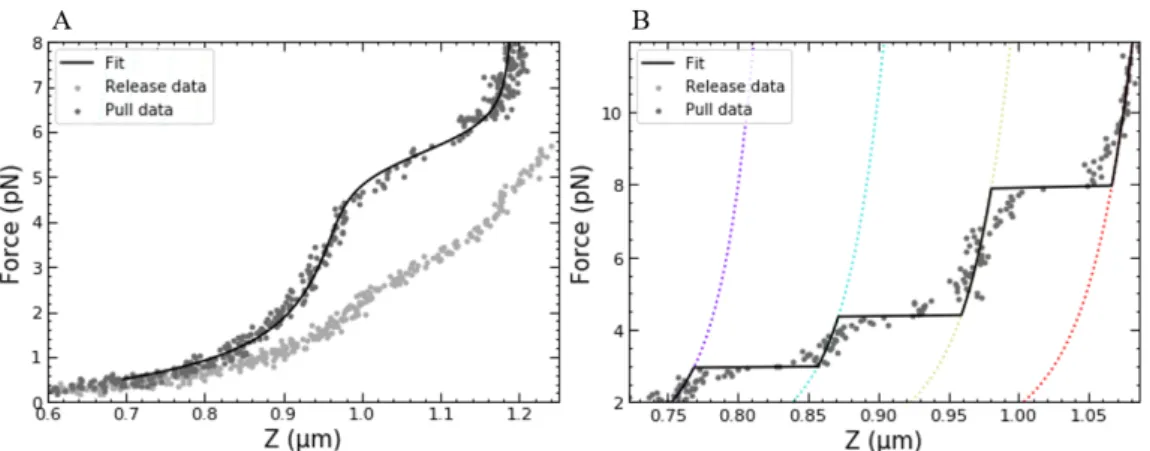
3. For chromatin with H1, the statistical mechanics model cannot be used, because the observed transitions at forces below 10pNfor chro-matin with H1 are not in thermal equilibrium. A low force compari-son between chromatin with H1 and chromatin without H1 is shown in figure 4.2.
Instead, the probability landscape (equation 2.15) was used to iden-tify discrete states. Figure 4.3 shows identification of unstacking steps with the t-test model in chromatin with H1. The low force boundary was set at a higher value (10-12pN) than the 7pN used for chromatin in equilibrium.
4.2 Chromatin 21
Figure 4.2: At forces below 7pN, chromatin fibers without H1 unfold in thermal equilibrium, whereas chromatin fibers with H1 show non-equilibrium, discrete unstacking steps. A: the equilibrium model describes chromatin fibers without H1 at forces below 7pN. The fitting parameters used for this fiber are: Ntot =
14.0±0.1, Ntet = 0.9±0.4, g1 = 8.3±0.3kBT, k = 0.1±0.1pN/nm. g2 was
fixed at5.5KBT.B: Unstacking behaviour in fibers with H1 at forces below 10pN. Datapoints are clustered and can be described by identifying discrete states using the t-test model.
step). Equation 2.15) was also used to identify the unwrapping steps. Criteria mentioned in section 2.2.1 were used to merge the states. The identification of states before and after merging states is shown in figure 4.4.
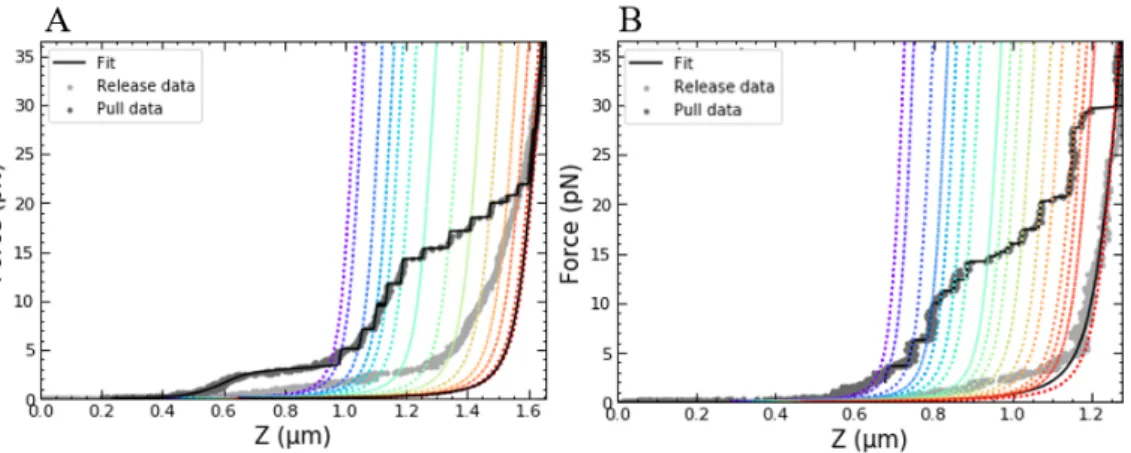
5. The different regimes were concatenated to get the complete force-extension curve. Completely fitted force-force-extension curves of chro-matin with H1 and without H1 are shown in figure 4.5. Typically, the yield of such curves was only about 5 % of the total number of beads, the biggest problem being the rupturing of tethers at forces above 20pN.
4.2 Chromatin 23
Figure 4.4:Merging states corrects for wrongly assigned split states.A: the prob-ability landscape before merging states. Nearby peaks are sometimes identified as seperate states. B: peaks in the probability landscape are assigned to distinct states. For each peak, a WLC with the corresponding contour length is plot-ted. Some clusters of datapoints are wrongly assigned to multiple states. C: after merging states, all groups of datapoints are correctly assigned to their corre-sponding state.
Figure 4.5: Force-extension curves of chromatin without (A) and with (B) H1 are qualitatively similar at forces above 10pN, but show different behaviour at forces below 10pN.A: a force-extension curve of chromatin without H1. Below 10pN, the data was fitted to the equilibrium model with fitting parametersNtot=
18.0±0.1, Ntet = 4.3±0.3, g1 = 7.5±0.2kBT, k = 0.3±0.3pN/nm (g2 was
Figure 4.6: Unwrapping stepsizes in 168NRL chromatin fibers are centered aroundµ = 75.6±1.06 bp and2µ = 151±1.05bp. A-B: identification of
dis-crete unwrapping steps with the t-test model.C: histogram of the stepsizes with a double Gaussian fit. The second Gaussian represents two nucleosomes un-wrapping at the same time. D: A linear fit of the rupture forces as a function of the logarithm of the pulling rate yields reaction parameters∆z=1.4±0.1nm,
4.2 Chromatin 25
Figure 4.7:Unstacking stepsizes in 168NRL and 197NRL fibers both vary widely, but reaction parameters show differences. A: Analysis of the unstacking be-haviour of 16 independent 16x168-NRL chromatin fibers with H1 (as shown in figure 4.3) yields a wide variety of stepsizes. B: A linear fit of the rup-ture forces as a function of the logarithm of the pulling rate yields parameters
Chapter
5
Discussion
The data collected by doing Magnetic Tweezer experiments on chromatin with and without H1, with NRL’s of 168 and 197 confirms a number of statements from previous experiments (1-3), while also providing new in-sights (4).
1. At forces below 7 pN, the equilibrium model accurately describes force-extension curves of chromatin without H1. As described by Meng et al [3], the curves show a plateau at around 3.5 pN. The plateau represents linear extension of the fiber until nucleosome in-teractions rupture and the outer turn of nucleosomal DNA unwraps from the HO [3]. The values found forg1is low (<10kBT) compared
to the value of 21.2kBT in Meng et al [3]. The found values forg1lie closer to the established values forg1of a mononucleosome: 8.3kBT
[3] and 9.0kBT [24]. The high-force stepwise unwrapping in figure
2. H1 stabilizes chromatosomes against unstacking.When H1 is added to chromatin fibers, the regime below<10pNdoes not show a grad-ual plateau, but stepwise unstacking of chromatosomes. Individgrad-ual rupture events can be observed, as opposed to fibers without H1. The difference is shown in figure 4.2. The discrete character of chro-matosome unstacking makes it possible to identify the individual unstacking events. There is some variation between different fibers due to the differences in composition, but the final unstacking event lies between 8-10 pN (figure 4.3). For fibers without H1, the plateau associated with similar rupture of nucleosome stacking interactions lies much lower: generally between 3-7 pN (figure 4.2A, [3], [20], [7]). Thus, on average, a higher force is needed to break the nucleosome interactions and unwrap the outer turn of DNA in fibers with H1 opposed to fibers without H1. It can therefore be concluded that H1 stabilizes chromatosomes against unstacking.
3. Unwrapping stepsizes are normally distributed aroundµ =75.6± 1.06 bp. The non-equilibrium model based on the probability land-scape was used to identify stepsizes in low force (< 10 pN) un-stacking events (figure 4.7) and high force (> 10pN) unwrapping events (figure 4.6C). A double Gaussian was fitted to unwrapping stepsizes in figure 4.6C to identify two peaks atµ = 75.6±1.06 bp and 2µ =151±1.05bp. The first peak in the distribution can be in-terpreted as the unwrapping of the remaining 72 bp of nucleosomal DNA from the HO of a nucleosome [4] [25], while the second peak indicates two nucleosomes unwrapping at the same time. The base-pairs are often converted to nanometers, which is not entirely correct since the extension is force-dependent. Here, a value of 0.34nm/bp
is used [30], which yieldsµ =25.7nmand 2µ =51.3nm. The values found in other experiments vary widely between 22-30 nm [3], which could be attributed to the extra extension that conformation III con-tributes (figure 2.1). Within a single reconstitution, the value found here is constant as indicated by the small standard error. This sug-gests conformation III could depend greatly on fiber structure. It can be concluded that unwrapping stepsizes for 16*168 chromatin fibers were found to normally distributed aroundµ = 75.6±1.06bp. The amount of data in the 2µ region is too low to draw any conclusions with respect to cooperative nucleosome unwrapping.
de-29
scribed in section 2.2.2 was used to extract reaction parameters from the data. First, the model was pplied to the unwrapping events from figures 4.6A+B. Figure 4.6D shows a linear fit to the data. The av-erage distance the nucleosome stretches before it unwraps the inner turn of nucleosomal DNA was found to be∆z =1.4±0.1nm. This is a reasonable value considering the size of the Nucleosome Core Par-ticle [11]. This value is lower than in [4] (3.2 nm) but higher than in [20] (0.8 nm). The difference could be caused by different buffer con-ditions. The height of the activation barrier was found to be 31.6±
0.1kBT. The height of this barrier further contributes to the stability of the nucleosome at high force. k0is low with 1.90±0.16·10−4s−1, which indicates that inner turn unwrapping rarely occurs sponta-neously.
Next, the model was applied to unstacking transitions of 168NRL and 197NRL chromatin fibers with H1. Figure 4.7 shows a wide dis-tribution of stepsizes. Since the uncertainty of the stepsize counts is high, no conclusions can be drawn with respect to the stepsizes. The stretching distance of the nucleosome,∆z, shows no difference within the standard error between 168NRL and 197NRL (∆z168 = 2.5±0.6 nm,∆z197 =2.1±0.5nm). The height of the activation bar-rier does show a difference: ∆G168 = 27.2±0.2 kBT and ∆G197 = 26.6±0.2 kBT. In deed, it has been suggested by Kaczmarczyk et
Chapter
6
Conclusion
In this thesis, Magnetic Tweezer measurements were done on chromatin fibers with and without adding H1 to obtain force-extension curves. Chro-matin fibers with different NRLs were used: 168 and 197.
The flowcell preparation protocol using anti-digoxigenin and BSA was optimalized for DNA to yield the highest percentage of WLC-behaving force-extension curves. It was demonstrated that this protocol also works well for doing measurements on chromatin fibers. However, the yield of curves that could be used for data analysis decreased when measuring the force-extension curves of chromatin. The low yield can be caused by tether ruptures, unwanted surface interactions and excessive forces on the sample during flushing. The yield can possibly be increased by using a different compound for the chromatin binding to the flowcell surface (for example a covalent bond like DBCO [29]). Because this bond is stronger than anti-digoxigenin, ruptures can be reduced. Using different pipette techniques might reduce drag forces on the sample during flushing. Be-cause the statistical relevance of the results depends on the amount of data, more measurements need to be done in order to confirm the four results in this thesis.
forces during flushing, developing a technique which reduces forces on the chromatin fibers would also increase fiber homogeneity.
The second result indicates that more force is required to unstack nucle-osomes in chromatin fiber with H1 than in chromatin fibers without H1. This stabilization has an inhibiting effect on genetic expression, since more force is needed to unfold chromatin fibers with H1 and transcription re-quires bare DNA. Quantifying this in vivo would be interesting, since the abundancy of chromatosomes is comparable to that of nucleosomes [27]. Furthermore, since different linker histone species affect gene expression in vivo in different ways [28], performing Magnetic Tweezer experiments on chromatin fibers equipped with these subspecies could identify possi-bly different unfolding characteristics.
The third result confirms that unwrapping stepsizes in chromatin with or without H1 are normally distributed. A peak value ofµ =75.6bpwas found, which converted to 25.7nmwas within the range of 22-30 nm found in other experiments [3]. More data is needed for the less-studied second peak, which could support cooperative unwrapping of nucleosomes.
The fourth and final result shows that 168NRL fibers have a higher ac-tivation energy barrier and a lowerk0 than 197NRL fibers for unstacking behaviour. This can be explained by the result from Kaczmarczyk et al [26], that the stiffness of fibers with a lower NRL is higher than the stiffness of fibers with a higher NRL. The increased stiffness of the 168NRL fibers would then cause a higher G† and a lower spontaneous unstacking rate
k0. It would be insightful to verify these results by doing force-extension measurements on a variety of fibers with a NRL between 150-200.
33
Acknowledgements
Bibliography
[1] B. Lai, W. Gao, K. Cui, W. Xie, Q. Tang, W. Jin, G. Hu, B. Ni, K. Zhao.
Principles of nucleosome organization revealed by single-cell micrococcal nu-clease sequencing.Nature (2018).
[2] C. Bustamante, S.B. Smith, J. Liphardt, D. Smith.Single-molecule studies of DNA mechanics.Curr. Opin. Struct. Biol. (2000).
[3] H. Meng, H. Andresen, J. van Noort. Quantitative analysis of single-molecule force spectroscopy on folded chromatin fibers. Nucleic Acids Re-search (2015).
[4] B. D. Brower-Toland, C. L. Smith, R. C. Yeh, J. T. Lis, C. L. Peterson, M. D. Wang.Mechanical disruption of individual nucleosomes reveals a re-versible multistage release of DNA.PNAS (2002).
[5] F. Chien.Chromatin Dynamics resolved with Force Spectroscopy.PhD The-sis at Leiden University (2011).
[6] N. Ribeck, O. A. Saleh. Multiplexed single-molecule measurements with magnetic tweezers.Review of Scientific Instruments 79.9 (2008).
[7] A. Kaczmarczyk. Nucleosome stacking in chromatin fibers probed with single-molecule force- and torque-spectroscopy.PhD Thesis at Leiden Uni-versity (2019).
[8] B. Alberts.Molecular biology of the cell (4th ed.).Garland Science. p. 197.
[9] J. T. Finch, A. Klug.Solenoidal model for superstructure in chromatin.Proc. Natl. Acad. Sci. U.S.A. 73, 1897−1901 (1976).
[11] K. Luger, A. W. M¨ader, R. K. Richmond, D. F. Sargent, T. J. Richmond.
Crystal structure of the nucleosome core particle at 2.8 A resolution.Nature. 389 (1997).
[12] K.J. Polach, J. Widom. Mechanism of protein access to specific DNA se-quences in chromatin: a dynamic equilibrium model for gene regulation. J Mol Biol. (1995).
[13] S.B. Rothbart.Interpreting the language of histone and DNA modifications.
Biochim Biophys Acta. (2014).
[14] J. Zhou, J.Y. Fan, D. Rangasamy, D.J. Tremethick.The nucleosome sur-face regulates chromatin compaction and couples it with transcriptional re-pression. Nature Structural Molecular Biology vol. 14, p. 1070−1076 (2007).
[15] J.D. Anderson, J. Widom.Sequence and position-dependence of the equi-librium accessibility of nucleosomal DNA target sites.J Mol Biol. (2000).
[16] N. Korolev, A.P. Lyubartsev, L. Nordenski ¨old. A system- atic analysis of nucleosome core particle and nucleosome-nucleosome stacking structure.
Scientific Reports 8.1 p. 1543 (2018).
[17] B.R. Zhou, J. Jiang, H. Feng, R. Ghirlando, T. S. Xiao, Y. Bai. Struc-tural Mechanisms of Nucleosome Recognition by Linker Histones. Molecu-lar Cell, Volume 59, Issue 4, p. 628-638 (2015).
[18] R. T. Simpson. Structure of the chromatosome, a chromatin particle con-taining 160 base pairs of DNA and all the histones. Biochemistry 17.25 p. 5524−5531 (1978).
[19] K.W. Jeon, R. Berezney.Structural and functional organization of the nu-clear matrix.Boston: Academic Press. p. 214 ˆa217 (1995).
[20] R. Rodrigues de Mercado.Quantification of discrete states in chromatin fiber folding.Bachelor Thesis at Leiden University (2018).
[21] M. Kruithof, F. Chien, M. de Jager, J. van Noort. Subpiconewton dynamic force spectroscopy using magnetic tweezers. Biophys. J. 94, p. 2343 ˆa2348 (2008).
BIBLIOGRAPHY 37
[23] R. Janissen. B. Berghuis, D. Dulin, M. Wink, T. van Laar, N. Dekker.
Invincible single molecules: Covalent DNA anchoring strongly enhances the measurable time window and force range.Nucl. Acids Res. 42 (2014).
[24] S. Mihardja, A.J. Spakowitz, Y. Zhang, C. Bustamante.Effect of force on mononucleosomal dynamics.Proc. Natl. Acad. Sci. U.S.A. (2006).
[25] M. Simon, J.A. North, J.C. Shimko, R.A. Forties, M.B. Ferdinand, M. Manohar, M. Zhang, R. Fishel, J.J. Ottesen, M.G. Poirier. Histone fold modifications control nucleosome unwrapping and disassembly.Proc. Natl. Acad. Sci. U.S.A. (2011).
[26] A.P. Kaczmarczyk, A. Allahverdi, T.B. Brouwer, L. Nordenskiold, N.H. Dekker, S.J.T. van Noort. Single-molecule force spectroscopy on hi-stone h4 tail cross-linked chromatin reveals fiber folding.Journal of Biolog-ical Chemistry 292 (2017).
[27] N. Happel, D. Doenecke. Histone H1 and its isoforms: Contribution to chromatin structure and function.Gene 431.1-2, p. 1ˆa12 (2009).
[28] R. Alami, Y. Fan, S. Pack, T. M. Sonbuchner, A. Besse, Q. Lin, J. M. Gre-ally, A. I. Skoultchi, E. E. Bouhassira.Mammalian linker-histone subtypes differentially affect gene expression in vivo. Proc. Natl. Acad. Sci. U.S.A. (2003).
[29] J. M. Eeftens, J. van der Torre, D. R. Burnham, C. Dekker.Copper-free click chemistry for attachment of biomolecules in magnetic tweezers. BMC Biophys. (2015).
Chapter
7
Figure 7.1: The offset parameter z0 was used to determine the quality of fit of
DNA force-extension curves. FiguresA-Dshow force-extension curves of DNA, with a fitted WLC. Because the DNA tether can bind to multiple locations on the bead, the distance to the flowcell surface can also vary. Therefore, not the DNA contour length is used as fitting parameter but the vertical distance between the lowest point of the bead and the binding site of the tether on the bead. Bead radius (1.4µm) was taken as maximum offset, and the standard deviation for good
41
![Table 2.1: Used constants of the four different nucleosome conformations. The free energies of the transitions are roughly g 1 = 19 ± 2k B T, g 2 = 4.4 ± 0.7k B T [3].](https://thumb-us.123doks.com/thumbv2/123dok_us/8176888.2167628/12.892.192.764.194.310/table-constants-different-nucleosome-conformations-energies-transitions-roughly.webp)
![Figure 2.1: The four different nucleosome conformations as proposed by Meng et al [3]: fully wrapped (I), partially unwrapped (II), singly unwrapped (III) and fully unwrapped (IV)](https://thumb-us.123doks.com/thumbv2/123dok_us/8176888.2167628/13.892.198.632.207.490/different-nucleosome-conformations-proposed-partially-unwrapped-unwrapped-unwrapped.webp)