Katy Lang
DEPARTMENT OF CITY AND REGIONAL PLANNING | UNC CHAPEL HILL | 2018
A
N
E
VALUATION OF
D
EMAND
-R
ESPONSIVE
T
RANSIT IN
N
ORTH
C
AROLINA
’
S
R
ESEARCH
T
RIANGLE
P
ARK
Contents
Executive Summary ... 4
Overview of Go OnDemand Pilot ... 6
Introduction to GoTriangle, RTP, and Existing Transit Service... 6
Impetus for the Pilot ... 6
Go OnDemand Structure ... 7
Service Area Characteristics ... 8
Goals and Objectives for the Pilot ... 9
Grounding the Evaluation in Context... 10
Purpose of the Evaluation ... 10
Literature Review ... 10
Evaluation Approach ... 23
Shuttle Baseline ... 23
Compiled Performance Indicators ... 26
Selected Performance Indicators ... 30
Data Collection Plan ... 32
Analysis ... 34
Four Weeks Summary ... 34
Review of Go OnDemand Objectives ... 34
Summary of Performance of Go OnDemand against Selected Indicators ... 40
Conclusion ... 42
Discussion ... 42
Factors that Influence DRT Performance ... 43
Conclusion ... 44
Appendix A: Surveys ... 45
Appendix B: Performance Indicator and Criteria Detail ... 53
Appendix C: Service Area Characteristics ... 55
Appendix D: Go OnDemand Data ... 65
Appendix E: Other ... 70
Table of Figures
Figure 1. GoTriangle Shuttle Routes (as of August 2016). Map credit: Author. ... 6
Figure 2. Map of GoTriangle On-Demand Pilot Service Area (GoTriangle) ... 8
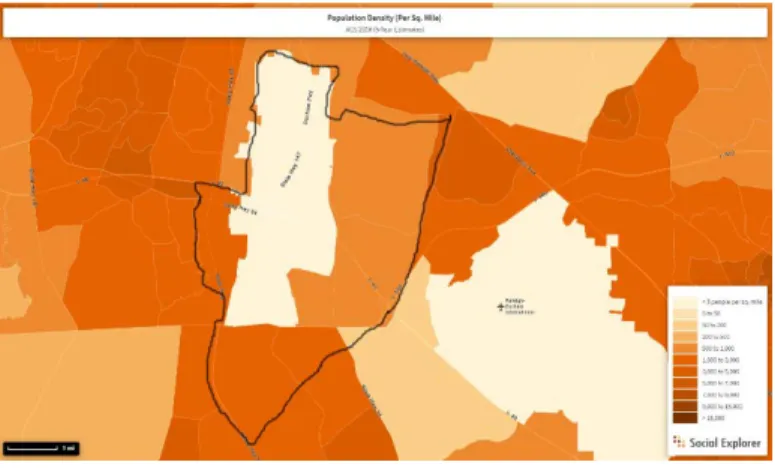
Figure 3. Population Density of Go OnDemand Service Area (Block Group-level data, Source: ACS 2016). 9 Figure 4. Decision Guide for Large Urban Areas (over 200,000 population) (Potts 2010 p36, Figure 19). 13 Figure 5. Typology of DRT Systems (Source: TCRP Report 124, p.47 (Table 5-2) ... 21
Figure 6. Cost per trip for different types of public transportation (Source: Potts 2010, p37) ... 22
Figure 7. Approximate Lengths (in miles) of old Shuttle routes ... 23
Figure 8. Shuttle Riders’ Satisfaction with GoTriangle Service Elements ... 24
Figure 9. Vehicle Availability of Shuttle Riders ... 24
Figure 10. Maps of Apartments within Service Area ... 33
Figure 11. Map of 0.75-mile buffer around apartments in service area, and trips occurring within the buffers ... 36
Figure 12. Ride Destinations (Jan 22 - Feb 16) ... 38
Figure 13. Ride Origins (Jan 22 - Feb 16) ... 39
Figure 14. Selection of Census Block Groups from Go OnDemand Service Area (Source: Social Explorer) 55 Figure 15. Work Area Profile Analysis, 2015 (Source: LEHD OnTheMap) ... 64
Figure 16. Rides by Status ... 65
Figure 17. Rides by Source ... 66
Figure 18. Rides by Hour (Completed) ... 66
Figure 19. Ride Duration ... 67
Figure 20. Ride Wait Time ... 67
Figure 21. Total Daily and Cumulative Passengers ... 68
Figure 22. Vehicle Miles Traveled ... 68
Figure 23. Goals for OCTA's "OC Flex" Microtransit ... 71
Table of Tables
Table 1. GoTriangle Performance Data FY 2017 ... 7
Table 2. Key DRT Performance Indicators – Selected in TCRP Report 124 (TCRP Report 124, p31 Table 4-2) ... 16
Table 3. Traveler Centric Performance Indicators for Mobility-On-Demand Sandbox Projects (TransitCenter, 2018) ... 17
Table 4. Other Performance Indicators for Mobility-On-Demand Sandbox Projects (Valdes and Knopp 2018) ... 18
Table 5. Other Performance Indicators ... 19
Table 6. Performance Indicators for OCTA’s OC Flex Microtransit Pilot... 20
Table 7. GoTriangle Shuttle Performance Data 2016-2017 ... 25
Table 8. Comprehensive List of Performance Indicators ... 27
Table 9. List of Selected Performance Indicators for Go OnDemand ... 31
Table 10. Go OnDemand Vehicle Revenue Hours and Schedule ... 37
Table 11. Summary of Performance of Go OnDemand against Selected Indicators ... 40
Table 12. Likelihood of current shuttle riders to use GoTriangle after change to on-demand ... 48
Table 13. How would riders hail the on-demand service? ... 48
Table 14. How often have riders used Uber or Lyft? ... 48
Table 15. Pilot Goals and Baseline Summary ... 53
Table 16. Selected Geographies for Go OnDemand Service Area (Source: Social Explorer) ... 55
Table 17. Go OnDemand Service Area Characteristics ... 56
Table 18. Go OnDemand Service Area Characteristics - Comprehensive List ... 57
Executive Summary
GoTriangle, the regional transit agency for the Triangle region of North Carolina, is conducting an innovative, shared ride, responsive transit pilot in Research Triangle Park (RTP). This demand-responsive transit pilot, called Go OnDemand, replaces four fixed-route shuttles. GoTriangle hopes that this pilot program will improve transit service in RTP, provide greater mobility and accessibility, and potentially reduce costs.
This pilot is part of a larger, national transportation trend. Transit agencies are shifting operations toward mobility as a service (MaaS) and exploring non-traditional ways of providing mobility to
customers, using mobile apps, partnerships with the private sector, and shared models. Go OnDemand fits with this trend, adding a high-tech component to traditional dial-a-ride service by partnering with TransLoc and targeting the service in low-density area of the Triangle where this type of transit model makes sense.
Given its innovative and unique operating structure, demand-responsive transit services like Go OnDemand can be difficult to evaluate. This paper attempts to frame Go OnDemand in context by reviewing existing demand-responsive transit performance measures, examining demand-responsive transit typologies, bringing in customer-focused performance indicators, and where possible, comparing Go OnDemand performance to baseline metrics from other comparable services. This paper also looks at Go OnDemand’s initial performance over a four-week time period to identify early wins and
challenges for the pilot.
Initial results from the pilot suggest that the Go OnDemand is providing different but effective transit service in RTP. The expansion of midday service is clearly an added benefit, and so are the additional connections that the point-to-point service provides to apartment complexes and commercial establishments within the service area. At the same time, predictability for regional connections has been reduced, and the service has not yet provided the hoped-for vehicle miles traveled (VMT)
reductions. Many of the performance indicators should be monitored throughout the six months of the pilot to identify areas for adjustment.
About This Document
GoTriangle, TransLoc, and the University of North Carolina at Chapel Hill collaborated on an evaluation strategy for the Go OnDemand pilot. This document is one of the outcomes of that evaluation. It is organized by a framework from BetterEvaluation, which suggests seven discrete evaluation tasks: manage, define, frame, describe, understand causes, synthesize, and report.1
Special thanks to the GoTriangle team (John Tallmadge, Jon Dodson, Juan Carlos Erickson, Wendy Mallon, Audra Foree, Matthew Frazier, Stan Hutchens, and Chris Clark), the TransLoc team (Landis Masnor, Annabel Jones, and Josh Cohen), Kirk Hovenkotter at TransitCenter, my advisor Dr. Noreen McDonald, my family at Carolina Planning, and my DC & NJ families.
Overview of Go OnDemand Pilot
Introduction to GoTriangle, RTP, and Existing Transit Service
GoTriangle is the regional transit agency for the Triangle region of North Carolina, which encompasses Raleigh, Durham, Chapel Hill, and their suburbs. GoTriangle has been in operation since 1989 (formerly known as the Triangle Transit Authority) and has expanded to include 19 routes with over 1.6 million riders in FY 2017. GoTriangle’s mission is to “improve[s] our region’s quality of life by connecting people and places through safe, reliable and easy-to-use travel choices.” Its 2017-2021 high-level goals are to 1) improve mobility in the region, 2) assure high-quality customer service through direct operation and partnerships, and 3) encourage sound growth patterns.2
Research Triangle Park (RTP) is an incorporated area of Durham County in the Triangle region that houses multiple large office parks, including the offices of IBM, RTI International, and Cisco. It was originally envisioned as an innovation hub in the 1970s by the Research Triangle Park Foundation, and now encompasses 250 businesses and about 50,000 employees. RTP is sprawling, and its land use is mostly suburban office park, a few apartments, and low-density retail connected by wide, high-speed roads. RTP has critical transportation links to the rest of the region and country, with Highway I-40 cutting through the area, RDU International airport a few miles away, and GoTriangle’s Regional Transit Center (RTC) within its borders.
Prior to January 2, 2018, GoTriangle provided transit service in Research Triangle Park (RTP) through four peak-period shuttles: the 42, 46, 47, and 49 (see Figure 1). These shuttles ran every half hour during the peak periods Monday-Friday. The shuttles would start their routes at the Regional Transit Center, where connections could be made to and from other regional bus routes. Shuttles were timed to a “pulse,” i.e., their schedules were coordinated with the regional routes so that connections could be made easily with minimal wait times (e.g., shuttle arrival at RTC at 5:25pm with regional buses departing at 5:30pm). The routes served major employment centers and by the end of 2017 had approximately 120 boardings total per day.
Impetus for the Pilot
Due to the comparatively low ridership on the shuttles and the high cost per rider compared to the average GoTriangle route (see Table 1 below), the service presented an opportunity for
improvement. Mobility and accessibility were low in RTP due to the limited number of stops, the
2 “About Us,” GoTriangle, accessed February 23, 2018, https://gotriangle.org/about-us.
distance between stops and destinations, and the infrequent service. GoTriangle looked to their technology partner, TransLoc, as well as funding from a Congestion Mitigation and Air Quality
Improvement (CMAQ) grant from the Federal Highway Administration (FHWA) to try something new. Table 1. GoTriangle Performance Data FY 2017
Four Shuttles Regional Peak
Routes Express Routes Regional Midday + Night
Daily Boardings 117 3,527 1,350 1,266
Per-Rider Cost* $19.65 $9.00 $12.47 $9.73
*Calculated as daily revenue hours x avg. operating cost/hr, divided by avg. daily boardings.
CMAQ is focused on improving air quality across multiple pollutant types. Under federal transportation policy, CMAQ funds are distributed to Metropolitan Planning Organizations, states, and other
transportation agencies with the goal of reducing vehicle emissions and congestion. These entities can engage in projects such as intersection improvements, transit service enhancements, electric vehicle charging stations, bikeshare, and more. Transit service improvements, such as this pilot, are categorized as moderately cost-effective by CMAQ in terms of benefit gained for CMAQ dollars disbursed.3
In pursuing and designing this pilot, GoTriangle had to consider the current ridership, their readiness and willingness to try something new, and other aspects of the service that would make it appealing rather than off-putting to riders. As described in the section below, the previous shuttles did not provide midday service. Hypothesizing that there was an unmet need for daytime (between the morning and evening rush) service, the Go OnDemand pilot provides rides during midday. GoTriangle surveyed riders of the shuttles in late 2017 to assess their readiness for demand-responsive transit and how they envisioned themselves using the service (detail in Appendix A: Surveys). Of the shuttle-riding
respondents, 90 percent said that based on what they knew about the proposed Go OnDemand pilot, they anticipate using GoTriangle more often or the same amount, with only 3 percent predicting they would use it less often.
When considering the implementation of this pilot program, GoTriangle also had to consider operator and vehicle availability, particularly for the addition of midday service. Because the previous shuttles did not offer midday service, figuring out how vehicles could be deployed to cover the midday was an important part of the planning process. It was ultimately decided to run 4 shuttles during peak to match the prior supply as closely as possible, while providing 1 shuttle midday while GoTriangle collected data on the demand for midday rides.
Go OnDemand Structure
The Go OnDemand pilot program replaces the GoTriangle shuttles 42, 46, 47, and 49 in Research Triangle Park. As of January 2, 2018 this new Go OnDemand service allows riders to request a ride using the TransLoc Rider app, web browser, or by calling GoTriangle. Go OnDemand serves bus stops within a limited service area (Figure 2). The service is available Monday through Friday, 6:30am to 6:30pm.
3 “Cost Effectiveness Tables - CMAQ” (Federal Highway Administration, May 17, 2017),
During the first six months of the pilot (January 2, 2018 to June 30, 2018) the fare is $0. After June 30, the fare will become $2.25 per trip with free transfers to other non-express routes. Riders can request rides during the service hours, or schedule a ride request ahead of time. Once a ride is requested, it can be tracked through the TransLoc Rider app. Wait times reflect the current average wait time across the system at the time of request, which averages between 15-30 minutes. As soon as a bus is
assigned to pickup, the TransLoc Rider app updates with the adjusted wait time.
GoTriangle is partnering with TransLoc for this pilot. They already partner with TransLoc for real-time arrivals via the TransLoc mobile app. TransLoc’s algorithm assigns ride requests automatically and has a platform for managing dispatch and operations manually as needed (e.g., if a rider calls in to request a ride, or if there is a walk-up rider). According to TransLoc, the algorithm optimizes for current conditions and for these following variables4:
• Rider wait time (minimized)
• Vehicle miles traveled (minimized)
• Rider time-on-vehicle (minimized)
GoTriangle will use its existing shuttle vehicles for the Go OnDemand service. These vehicles are 16-seat wheelchair accessible vans. This size vehicle is recommended for flexible and demand-responsive transit service.5 During the morning peak periods, GoTriangle puts three vehicles into service (four in the
evening peak), and at the start of the pilot, just one vehicle midday. Demand in the midday is as yet unknown since the previous shuttles did not provide midday service.
Service Area Characteristics
The service area for Go OnDemand is over 21 square miles and home to over 21,000 residents and 51,000 employees. It uniquely has a Block Group in its center that has zero population, so all of the residents live on the edges of the service area. Young children under age 5 make up 10 percent of the population, and middle-aged adults ages 35-54 make up 31 percent. The employees in the service area are mostly between the ages of 30-54 (67.5 percent of the employees are this age), and make more than $3,333 per month (75.6 percent of employees have these earnings). The largest industry sectors in the
4 “OnDemand Driver Presentation,” August 7, 2017.
5 John F. Potts et al., eds., A Guide for Planning and Operating Flexible Public Transportation Services, TCRP Report 140 (Washington, D.C: Transportation Research Board, 2010), 38.
service area are manufacturing, with 32.4 percent of jobs, and
professional/scientific/technical services with 21.8 percent of jobs.6
• 21.4 square miles
• Average population density of 804 people per square mile (Block group range: 0.0 to 1,687 people per square mile)
• Total number of residents: 21,560
• Total number of employees: 51,533
See Appendix C: Service Area Characteristics
for additional service area characteristics, tables, and detail.
Goals and Objectives for the Pilot
GoTriangle’s overarching goal for the pilot is to explore if they can improve mobility and accessibility in Research Triangle Park, reduce vehicle miles traveled (and realize the associated air quality
improvements), and potentially realize some operating efficiencies. GoTriangle's objectives for this pilot are as follows:
1. Increase ridership to/from stops in the on-demand service area to 200 daily. We currently experience an average of approximately 1207 boardings per weekday on the 4 fixed-route
shuttles.
2. Of the 200 trips, 50 direct trips made that would not require a transfer at Regional Transit Center from residences in the service zone.
3. Create new demand from the area around Woodcroft to destinations within the on-demand service area because they can be made with shorter trips (i.e., transfers can be made at stops along NC54).
4. Create new demand from the area around Falls Pointe Apartments to destinations within the on-demand service area because they can be made with direct trips or fewer transfers (if connecting to a route at the RTC).
5. Reduce vehicle miles travelled (both by GoTriangle-operated vehicles and customer trips) compared to current levels.
6. Alternately, if we don't generate new demand, we'd like to serve the current level of 120 boardings with 25 percent fewer hours of service.8
6 U.S. Census Bureau, Longitudinal-Employer Household Dynamics Program, “LEHD Origin-Desintation Employment Statistics (2002-2015),” LEHD OnTheMap, 2018, https://onthemap.ces.census.gov/; “US Demography 1790 to Present,” Government, Social Explorer, accessed March 5, 2018,
https://www.socialexplorer.com/a9676d974c/explore.
7 Note: Boarding estimates vary. The median boardings for April 2017 was 75 (range of 26 to 113). 8 John Tallmadge and Erik Landfried, “RTP On-Demand Project Goals” (GoTriangle, August 23, 2017).
Grounding the Evaluation in Context
Purpose of the Evaluation
In order to evaluate the success of the pilot and monitor performance, GoTriangle engaged with a Masters student in the Department of City & Regional Planning at the University of North Carolina at Chapel Hill. The evaluation will broadly cover the impacts of the demand-responsive transit pilot on riders, operating costs and resources, and whether it met its goals. The evaluation of the pilot will provide GoTriangle with financial and ridership information they need to determine if the pilot is successful and to assist with planning for the following fiscal year. It is a formative evaluation designed to assist GoTriangle and TransLoc staff with decision-making about transit service in RTP. Hopefully, this evaluation will provide other transit agencies with lessons learned from attempting to implement an on-demand pilot and document the successes of the pilot for use in future funding requests, transit service planning, and marketing efforts.
The evaluation will incorporate the beginning stages of a time series, or trend analysis, in that it will examine 4 weeks’ worth of initial pilot operating data. The evaluation will also seek to compare Go OnDemand to established norms or standards from industry. And finally, it will seek to compare Go OnDemand to its peers providing demand-responsive service.
Literature Review
How will GoTriangle know if the pilot is successful? As noted above, GoTriangle will eventually need to compare the Go OnDemand service to itself in a trend analysis and against the stated pilot goals. But before there is even data from the pilot to collect and analyze, it is important to identify established norms or standards and identify peer systems.
To do this, I performed a literature review of demand-responsive transit and other evaluations of unconventional transit, including:
• TCRP Report 124 – Defining DRT and other flexible transit typologies
• NCHRP Reports and Guidebooks on DRT and DRT evaluation
• FTA’s Mobility On Demand (MOD) Sandbox
• Latest MOD Evaluation research from Transportation Research Board Annual Meeting
• Report on Mobility as a Service (Maas)
• Latest cases and research on microtransit
• Case studies, including OCTA and TransLoc’s other microtransit pilots
These are described in the following sections, as well as a grounding of Go OnDemand in the larger conversation around mobility.
Key Terminology and Context Demand-Responsive Transit
fixed-route service.9 Paratransit also includes flexible transit, demand-responsive transit, microtransit such as
jitneys and company shuttles, and more.”10 According to the National Transit Database, “vehicle
revenue miles increased to 29.4 percent for Demand Response transit from 2007-2016.”11
DRT is defined as service that is flexibly routed, requested by the rider ahead of time, and shared. The TCRP Guidebook on Measuring, Assessing, and Improving the Performance of Demand Response Transportation (hereafter referred to as TCRP Report 124) cites the Federal Transit Administration’s definition of DRT as follows:12
“Demand-response is a transit mode comprised of passenger cars, vans or small buses operating in response to calls from passengers or their agents to the transit operator, who then dispatches a vehicle to pick up the passengers and transport them to their destinations. A demand-response (DR) operation is characterized by the following: a. The vehicles do not operate over a fixed route or on a fixed schedule except, perhaps, on a temporary basis to satisfy a special need, and b. Typically, the vehicle may be dispatched to pick up several passengers at different pick-up points before taking them to their respective destinations and may even be interrupted en route to these destinations to pick up other passengers.”13
Demand-responsive transit allows customers to request and receive rides in a defined service area or from multiple bus stops. There may be limits on the service area, pickup locations, and operating times. Vehicles may be smaller than traditional 40ft. buses. It is characterized by shared rides, prior
arrangement with the rider, and flexible routing.14 The guidelines of the Americans with Disabilities Act
(ADA) are not required for paratransit service that serves the general population, such as Go OnDemand, and transit agencies have great flexibility in determining the service, e.g., trips can be prioritized, hours and days for the service can be set independently, numbers of trips per rider can be rationed, and waiting lists are allowed.15
DRT is a long-standing form of transit, and is also referred to as: dial-a-ride, demand-activated transportation, demand-responsive transportation, dial-a-bus, shared-ride paratransit, flexible-route
9 KFH Group, Inc., Guidebook for Measuring, Assessing, and Improving Performance of Demand-Response Transportation, Transit Cooperative Research Program, Report 124 (Washington, D.C.: Transportation Research Board, National Academies of Sciences, Engineering, and Medicine, 2008), 3, https://doi.org/10.17226/23112. 10 Kathryn Lang, “Demand-Responsive Transit: Considerations and Potential for Transit Agencies. Prepared for: Dr. Roberto Quercia, PLAN 761.,” December 2017.
11 National Transit Database, 2016. Appendix. Accessed:
https://www.transit.dot.gov/sites/fta.dot.gov/files/docs/ntd/66016/2016-ntst-appendix.pdf.
12 Lang, “Demand-Responsive Transit: Considerations and Potential for Transit Agencies. Prepared for: Dr. Roberto Quercia, PLAN 761.”
13 Federal Transit Administration, appearing in KFH Group, Inc., Guidebook for Measuring, Assessing, and Improving Performance of Demand-Response Transportation, 4.
14 KFH Group, Inc., Guidebook for Measuring, Assessing, and Improving Performance of Demand-Response Transportation.
service, and flexible-transport service.16 Flexible transit service overall is prevalent in the United States,
with 39 percent of transit agency respondents reporting that they operate some form of flexible public transportation.17 Low-density urban areas tend to be good candidates for flexible public transportation,
particularly those located near major transportation activity centers (e.g., train stations, medical centers, office parks, and transit hubs).18
In urban areas, demand-responsive transportation has been most successful as a feeder to other transit connections, in office parks, as night-owl service, in communities constrained by natural or man-made barriers, new suburban residential, and areas never previously served by transit.19 This makes Research
Triangle Park (RTP) a solid candidate for this type of service. Microtransit
Microtransit is defined as a for-profit transportation program, usually using buses or small vans that provide direct or almost door-to-door service. Recent national examples include services provided by companies like Bridj, Leap, Loup, and Chariot, as well as technological support provided by companies like TransLoc and Via. According to the Shared Use Mobility Center (SUMC),20 microtransit has the
following implications for public transit:
• Dynamic routing technology – adjusting stops and routes in real time with algorithms, which works well for dispersed populations
• Public private partnerships – to quote the SUMC, microtransit providers could provide “more efficient alternatives for paratransit, ‘dial-a-ride’ transport and other important but inefficient forms of public transportation”21
• First and last mile connections – more efficient ways to connect to larger transit systems, e.g., heavy or light rail or an express bus line
• More options for travelers – more flexibility for transit users versus fixed-route buses
Although touted by some experts as the future of transit, and by others as a resource-intensive scheme taking riders away from transit, clearly microtransit is influencing public transit agencies and appeals to customers willing to pay more for a more direct, more comfortable ride (see Appendix E: Other for case studies of microtransit).22
16 KFH Group, Inc., Guidebook for Measuring, Assessing, and Improving Performance of Demand-Response Transportation, 4.
17 Potts et al., A Guide for Planning and Operating Flexible Public Transportation Services, 26. 18 Potts et al., 34.
19 Potts et al., 33–34.
20 Editor, “Four Ways Microtransit Can Influence the Future of Public Transportation,” Shared Use Mobility Center (blog), December 8, 2015, http://sharedusemobilitycenter.org/news/four-ways-microtransit-can-influence-the-future-of-public-transportation/.
21 Editor, sec. Public Private Partnerships.
22 Simon J. Berrebi, “Don’t Believe the Microtransit Hype,” CityLab, November 6, 2017,
Mobility as a Service (MaaS)
Mobility as a Service (MaaS) is a user-centered approach to transportation that integrates trip planning, booking, ticketing, and payment across public and private transportation modes into a seamless user experience. It aims to connected people more easily openly to the variety of
transportation choices that they can make and to help people select the ‘best’ option for their travel needs – whether that be lowest cost, fastest time, or fewest transfers. MaaS uses apps to integrate this
information and update it in real-time.23
Mobility on Demand (MOD) Sandbox
The Federal Transit Administration is funding an $8 million program for experimentation in new ways of providing mobility, called the Mobility on Demand Sandbox Program.24 The FTA recognizes that “new
mobility concepts and solutions, from bike- and car-sharing systems to demand-responsive bus services, are providing travelers with flexible and convenient transportation options”.25 FTA is recognizing
demand-responsive transit, MaaS, and successful private sector models of providing mobility.26
Choosing Demand-Responsive Transit
The Guide for Planning and Operating Flexible Public
Transportation Services (Potts 2010) offers a decision tree for transit agencies considering offering a form of flexible transportation. While this category is broad and includes other types of flexible service, it does offer validity to GoTriangle’s choice to pilot a demand-responsive program. As shown in Figure 4, the decision tree for offering demand-responsive transit service depends on the area’s population density, existing route productivity, and the presence of transportation generators.
23 Warwick Goodall et al., “The Rise of Mobility as a Service,” Company, Deloitte Insights, January 23, 2017, https://www2.deloitte.com/insights/us/en/deloitte-review/issue-20/smart-transportation-technology-mobility-as-a-service.html.
24 Federal Transit Administration, “Mobility on Demand (MOD) Sandbox Program,” Government, FTA, April 20, 2016, https://www.transit.dot.gov/research-innovation/mobility-demand-mod-sandbox-program.html; Aarian Marshall, “How a Failed Experiment Could Still Be the Future of Public Transit,” WIRED, March 6, 2017, https://www.wired.com/2017/03/failed-experiment-still-future-public-transit/.
25 Federal Transit Administration, “Mobility on Demand (MOD) Sandbox Program.”
26 Lang, “Demand-Responsive Transit: Considerations and Potential for Transit Agencies. Prepared for: Dr. Roberto Quercia, PLAN 761.”
Some of the key factors in understanding if a location is a candidate for successful demand-responsive transit is to examine:
• Residential and employment density
• Ridership productivity below 15 passengers/hour
• Significant origins or destinations (e.g., transit center)
• Ridership low at certain times of day
• Presence of special needs group
• Total service area
• Travel time to the significant origin or destination (center point)
• Auto ownership
• Median income27
The OC Flex microtransit pilot in Orange County, CA, for example, determined that microtransit would be appropriate for some of its service zones based on a ‘transit propensity index’ made up of the following (more information on OC Flex can be found in the section Case Studies: Demand-Responsive Service on page 70):
• Population density
• Employment/enrollment density
• Low-income population density
• Traffic density
• Intersection density
• Connecting bus routes
• Transit nodes
• Other trip generators.28
Researchers from Cambridge Systematics conducted a study of cost savings that transit agencies could realize by partnering with ride-hailing services compared to the per-trip transit subsidies they currently provide. They specifically modeled two low-performing routes in San Antonio, and their initial results indicate that most of the trips close to the existing bus routes could be completed by a ride-hailing service for a lower cost than the per-trip agency cost of service.29 However, they acknowledge that not
all systems have the density or other transit connections to support these shorter and cheaper rides, and that partnerships carry risks such as unstable fares, inequitable labor practices, and potential net increases in VMT.
The authors also created two typologies for this kind of partnership between a transit agency and a ride-hailing company – substitutive and supplemental.30 Substitutive partnerships intend for the ride-hailing
subsidy to replace public transit and are used in lower-density areas where fixed-route is challenging. Supplemental programs intend to use ride-hailing service to get people to transit, commonly referred to as “first-mile, last-mile” connectivity. It is useful to hold these two typologies in mind when choosing
27 Potts et al., A Guide for Planning and Operating Flexible Public Transportation Services, 33–34. 28 Gary Hewitt, “OCFlex Pilot Project White Paper,” October 2, 2017.
what type of service to operate and how to evaluate it. Go OnDemand falls clearly within the
“supplemental” style of service since the pilot has replaced the old fixed-route service, although it does not involve a partnership with a ride-hailing company.
Examples of Demand-Responsive Transit
Cities and towns across the United States have been providing demand-responsive transit service and ‘Dial-A-Ride’ service for decades. However, recent trends in privately provided shared mobility,
microtransit, and technology improvements have brought demand-responsive service into the limelight. Case studies describing other cities and towns that have engaged in similar or related partnerships with technology providers to provide demand-responsive service are provided in Appendix E: Other.
Challenges for Evaluating DRT Performance
DRT must be evaluated differently from fixed-route service, as it is fundamentally different. For
example, the marginal cost of adding any one passenger to a fixed-route bus is extremely small and adds to the overall efficiency of the bus trip by potentially removing one car from the road and by further dividing the fixed cost of the bus trip (operator pay, fuel) among more people. Fixed-route transit has an incentive to add passengers to increase the efficiency of trips. In contrast, a demand-response transit service has very high marginal costs – adding one more passenger usually adds an entire new trip (unless the trip is shared). More demand means more trips are required, along with increases in vehicle miles and, depending on how hours are counted, increases in service hours. If DRT service is successful and demand increases, eventually it will reach vehicle or human resources capacity and an agency will need to either ration service or substitute fixed- or flexible-route service to meet demand.31
Transit systems’ usual service standards and performance indicators may not apply to its DRT service, since the DRT service performs dramatically different functions than fixed-route service. The National Research Council (É.-U.) describes some of these functions, which include:
• Technology (mechanism) for trip reservations and requests
• Technology (mechanism) for managing and adjusting schedules for trips
• More labor-intensive dispatch service
• Expectation of lower productivity than fixed-route service32
Other criteria that influence DRT performance are listed in Appendix B: Performance Indicator and Criteria Detail.
Comparing Go OnDemand to peers is challenging for a number of reasons. While demand-responsive transit is popular in rural areas, this pilot is unique in its use of existing equipment, its replacement of low productivity shuttle routes, its direct operation, and its technology partnership. Of all of the case studies of other transit service examined, only OC Flex in Orange County, CA provides a similar service model (and also partners with TransLoc).
31 National Research Council (É.-U.) et al., A Guidebook for Developing a Transit Performance-Measurement System, 104–5.
Measuring Performance
As noted at the beginning of this section, this evaluation will attempt to compare Go OnDemand data to itself and goals, accepted industry standards, and to peers. This section outlines performance indicators identified during the literature review.
The Guidebook for Measuring, Assessing, and Improving Performance of Demand-Response
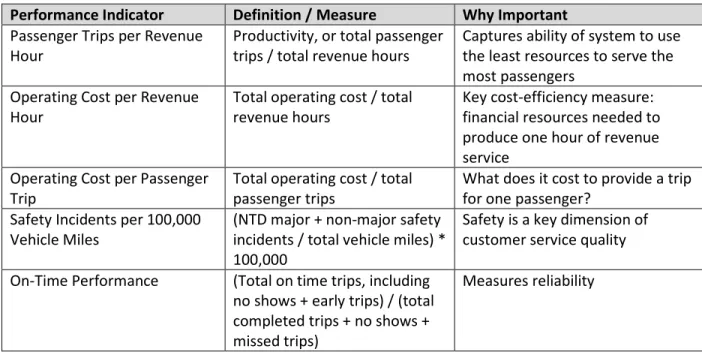
Transportation (hereafter referred to as TCRP Report 124) is a resource for transit agencies providing DRT in urban areas. It has a companion report for DRT in rural areas. The Guidebook’s objective is to identify what factors influence DRT performance, include performance assessment methods, and provide a meaningful typology as benchmarks. Although the report is from 2008, it provides useful DRT context and helpful performance standards that are used throughout the evaluation of Go OnDemand. TCRP Report 124 on measuring demand-responsive transit identifies 5 Key DRT performance indicators (shown in Table 2):
Table 2. Key DRT Performance Indicators – Selected in TCRP Report 124 (TCRP Report 124, p31 Table 4-2)
Performance Indicator Definition / Measure Why Important
Passenger Trips per Revenue
Hour Productivity, or total passenger trips / total revenue hours Captures ability of system to use the least resources to serve the most passengers
Operating Cost per Revenue
Hour Total operating cost / total revenue hours Key cost-efficiency measure: financial resources needed to produce one hour of revenue service
Operating Cost per Passenger
Trip Total operating cost / total passenger trips What does it cost to provide a trip for one passenger? Safety Incidents per 100,000
Vehicle Miles (NTD major + non-major safety incidents / total vehicle miles) * 100,000
Safety is a key dimension of customer service quality
On-Time Performance (Total on time trips, including no shows + early trips) / (total completed trips + no shows + missed trips)
Measures reliability
The indicators identified by TCRP Report 124 are core performance measures for a demand-responsive transit system. However, the focus on the passenger experience is missing from these indicators. How do passengers experience this service? What is their level of satisfaction with their most valued aspects of the service? The Federal Transit Administration’s Mobility On Demand (MOD) Sandbox program has engaged the assistance of TransitCenter to develop performance indicators for its MOD projects, and they are taking a traveler centric perspective to their evaluation approach.
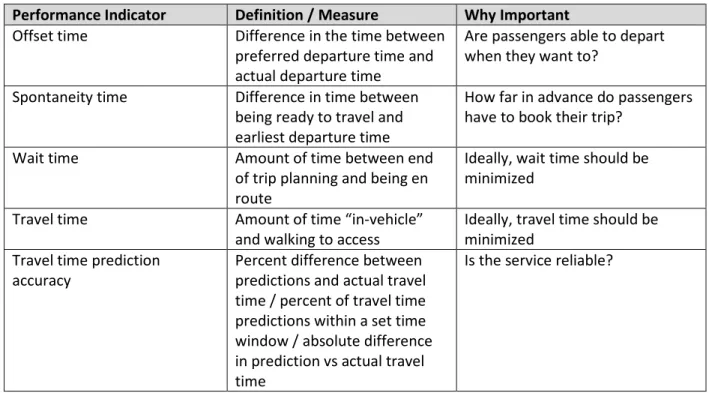
TransitCenter has organized its performance indicators by stage of travel (planning, waiting, en route, connecting) and by the type of experience (time, budget, reliability, and availability). The full list of performance indicators can be found by reviewing TransitCenter’s 2018 Memo to the FTA.33 Some of its
recommended performance indicators that have the most relevance to Go OnDemand are listed below (as listed in TransitCenter Memo 2018):
Table 3. Traveler Centric Performance Indicators for Mobility-On-Demand Sandbox Projects (TransitCenter, 2018)
Performance Indicator Definition / Measure Why Important
Offset time Difference in the time between preferred departure time and actual departure time
Are passengers able to depart when they want to?
Spontaneity time Difference in time between being ready to travel and earliest departure time
How far in advance do passengers have to book their trip?
Wait time Amount of time between end of trip planning and being en route
Ideally, wait time should be minimized
Travel time Amount of time “in-vehicle”
and walking to access Ideally, travel time should be minimized Travel time prediction
accuracy Percent difference between predictions and actual travel time / percent of travel time predictions within a set time window / absolute difference in prediction vs actual travel time
Is the service reliable?
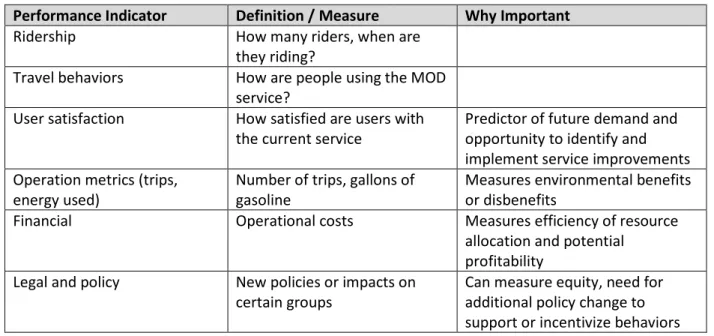
At the Transportation Research Board 2018 Annual Meeting, a workshop on U.S. DOT’s Mobility On Demand (MOD) Program’s “Nuts and Bolts” laid out the following categories of performance indicators for MOD projects (Table 4.34 Since the MOD Sandbox Program includes all types of mobility projects,
including restructuring parking and implementing bikesharing or carpooling, not all of these metrics might be relevant for a demand-responsive transit project.
Table 4. Other Performance Indicators for Mobility-On-Demand Sandbox Projects (Valdes and Knopp 2018)
Performance Indicator Definition / Measure Why Important
Ridership How many riders, when are they riding?
Travel behaviors How are people using the MOD service?
User satisfaction How satisfied are users with
the current service Predictor of future demand and opportunity to identify and implement service improvements Operation metrics (trips,
energy used) Number of trips, gallons of gasoline Measures environmental benefits or disbenefits Financial Operational costs Measures efficiency of resource
allocation and potential profitability
Legal and policy New policies or impacts on
certain groups Can measure equity, need for additional policy change to support or incentivize behaviors
Additional indicators that may be useful to evaluating demand-responsive transit service can be found in Table 5. These include: average passenger trip length, which is a local external factor that can affect DRT productivity, and average travel time, which measures how much time each passenger is traveling.35
Transit agencies may also want to look at environmental and equity indicators.36 This can be achieved by
“slicing” other performance measures by demographic indicators such as race, gender, income, English proficiency, disability, and age—depending on availability of data. For example, 2016 on-board survey results revealed that over 50 percent of GoTriangle shuttle respondents have no access to a vehicle, and English is not the dominant language at home for almost a third of respondents.37 Any initiative that
changes service and hopes to increase equity must take these user characteristics into account. Table 5. Other Performance Indicators
Performance Indicator Definition / Measure Why Important
Average passenger trip length How many miles each
passenger travels in the vehicle Can affect DRT productivity Average travel time How much time each
passenger spends in the vehicle Measures how much time each passenger is traveling Bus Wait Time Length of time that the buses
wait for passengers before pick-up at pick-up location
If bus wait times for passengers are too long, overall trip length and other passengers’ wait times will increase
Rider satisfaction How satisfied are riders with
the current service Predictor of future demand and opportunity to identify and implement service improvements Provide low-income residents
with equivalent access to high-income residents
Ratio of average household 30-minute access shed for lowest-income ten percent of
residents to highest-income residents’ 30-minute access shed
Advances equity
Ensure revenue sources and
spending support access for all Five-year planned system investments benefitting riders by income quintile and race/ethnicity
Advances equity
35 KFH Group, Inc., Guidebook for Measuring, Assessing, and Improving Performance of Demand-Response Transportation.
36 C. Pangilinan, Z. Accuardi, and M. Plaut, “Evaluating Emerging Mobility Partnerships: A Performance Evaluation Framework for the FTA Mobility on Demand Sandbox” (TransitCenter, May 30, 2017).
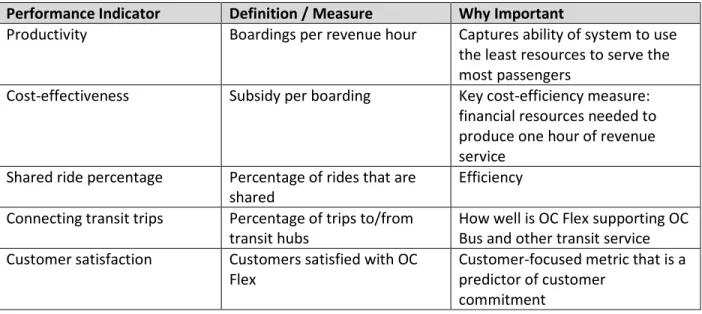
As mentioned earlier in this paper, Orange County Transit Authority (OCTA) has a microtransit pilot planned for 2018 and has created an evaluation plan that maps out its desired performance indicators (more information on page 70).38 OCTA will evaluate its OC Flex service based on:
Table 6. Performance Indicators for OCTA’s OC Flex Microtransit Pilot
Performance Indicator Definition / Measure Why Important
Productivity Boardings per revenue hour Captures ability of system to use the least resources to serve the most passengers
Cost-effectiveness Subsidy per boarding Key cost-efficiency measure: financial resources needed to produce one hour of revenue service
Shared ride percentage Percentage of rides that are
shared Efficiency
Connecting transit trips Percentage of trips to/from
transit hubs How well is OC Flex supporting OC Bus and other transit service Customer satisfaction Customers satisfied with OC
Flex Customer-focused metric that is a predictor of customer commitment
Performance Standards
Define Go OnDemand Typology
As noted at the beginning of the last section, this evaluation will attempt to compare Go OnDemand data to itself and goals, accepted industry standards, and to peers. This section defines types of DRT service to facilitate peer to peer comparison across the same types.
The typology of DRT service is dependent on the ridership market served, operating environment, type of routing and scheduling, type of operator, dedicated vs. non-dedicated vehicles, advance vs.
immediate response, use of technology, door-to-door vs. curb-to-curb, etc.39
Out of the three main typologies involving small urban, large urban, and largest urban DRT systems, GoTriangle’s Go OnDemand service falls into the “Small Urban DRT Systems” category, providing general public DRT (Figure 5). According to TCRP Report 124, this was the least common type of urban DRT using systems existing in 2008.
38 Hewitt, “OCTA White Paper.”
TCRP Report 124 collected data from participating DRT systems for FY 2005. There were fourteen small urban DRT systems included in their study, with only three systems within the general public category. Passengers
Although flexible public transportation is different from on-demand, the target performance standards and other cases are useful to examine. Routes that have between 5 and 16 passengers per hour are strong candidates for converting from fixed-route to some form of paratransit.40
OCTA’s OC Flex pilot has a target performance of 6 or more boardings per revenue hour in its first year.41
Costs
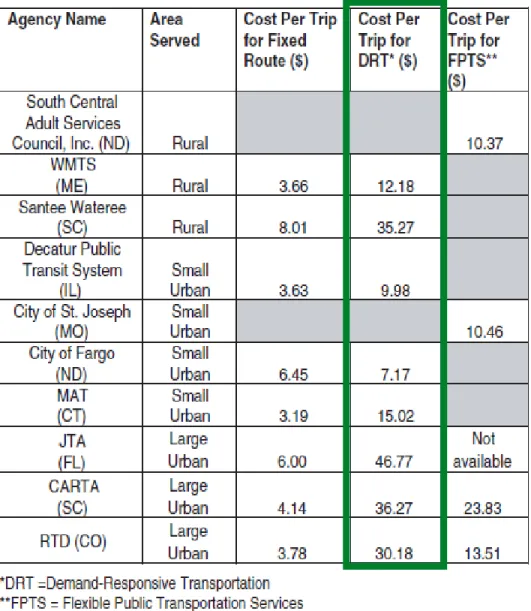
In 2007, the National Transit Database (NTD) reported that the national average per trip for demand-responsive service directly operated by a transit agency was $26.95, compared to $3.21 for fixed-route trips.42 Research compiled for a report on flexible transportation found a few examples of costs for
demand-responsive transit in 2007, ranging from $7.17 cost per trip to $46.77 cost per trip. Figure 6 shows a table from that report, breaking out the services into rural, small urban, and large urban DRT.43
OCTA’s OC Flex pilot has a target performance of $9.00 or less of subsidy per boarding, using actual costs and revenues received.44 This is a measure of cost-effectiveness for the service.
Other
OCTA has a few other performance standards for its 2018 pilot of microtransit service, OC Flex.
However, because the pilot is not in operation, these should not be taken as performance standards but rather desired benchmarks from another similar service. It has a goal of 25 percent shared rides, 25 percent of trips to and from transit hubs, and higher than 85 percent customer satisfaction of “very” or “somewhat.”45
40 Potts et al., A Guide for Planning and Operating Flexible Public Transportation Services, 36. 41 Hewitt, “OCTA White Paper,” 24.
42 Potts et al., A Guide for Planning and Operating Flexible Public Transportation Services, 36. 43 Potts et al., 37.
44 Hewitt, “OCTA White Paper,” 24. 45 Hewitt, 24.
Evaluation Approach
Shuttle Baseline
What were the baseline conditions for the former shuttles? Although the performance metrics for demand-responsive transit are very different from fixed-route service (as noted by National Research Council (É.-U.) & Potts), it is important to understand the performance of the shuttles as a starting point. The four shuttles, which stopped service at the end of December 2017, are listed below.
• 42: Davis Dr/IBM Shuttle
• 46: Miami/TW Alexander Shuttle
• 47: TW Alexander/Cornwallis Shuttle
• 49: Kit Creek Shuttle
Former shuttles ran approximately 41 miles total on their old routes and each ran 10 trips per day (5 in the a.m. peak and 5 in the p.m. peak), bringing approximate VMT for those shuttles to 410 miles per day.
On-board surveys from GoTriangle, the last one dated 2016, suggest a moderately satisfied, consistent, transit-dependent group of riders traveling to work on the RTP shuttles. A combined 73 percent of shuttle riders rated GoTriangle a 5, 6, or 7 on a scale ranging from very poor (1) to excellent (7). The majority of shuttle riders, 55 percent, used GoTriangle (including the shuttles and other regional service) 5 or more days per week and 63 percent consider themselves either “frequent” or “intensive” riders of GoTriangle. Ninety-two percent of survey respondents reported using their current one-way bus trip to go to work. Of about half of the respondents who used a method other than walking to get to the bus stop for their shuttle trip, 23 percent used another GoTriangle bus to get there. Over 50 percent of the shuttle riders have no access to a vehicle, and English is not the dominant language at home for almost a third of respondents.46
Despite generally positive ratings, there were some areas for improvement as well for the shuttle riders (see Figure 8). Some shuttle riders (approximately 12 percent and 5 percent, respectively) rated the ease of making connections between other systems and other GoTriangle buses as very poor. On-time
connections, frequency of service, and operating hours were other areas with room for improvement. Additional on-board survey results for shuttle riders from 2016 can be found in Appendix A: Surveys.
46 “GoTriangle On Board Survey.”
Figure 8. Shuttle Riders’ Satisfaction with GoTriangle Service Elements
Figure 9. Vehicle Availability of Shuttle Riders
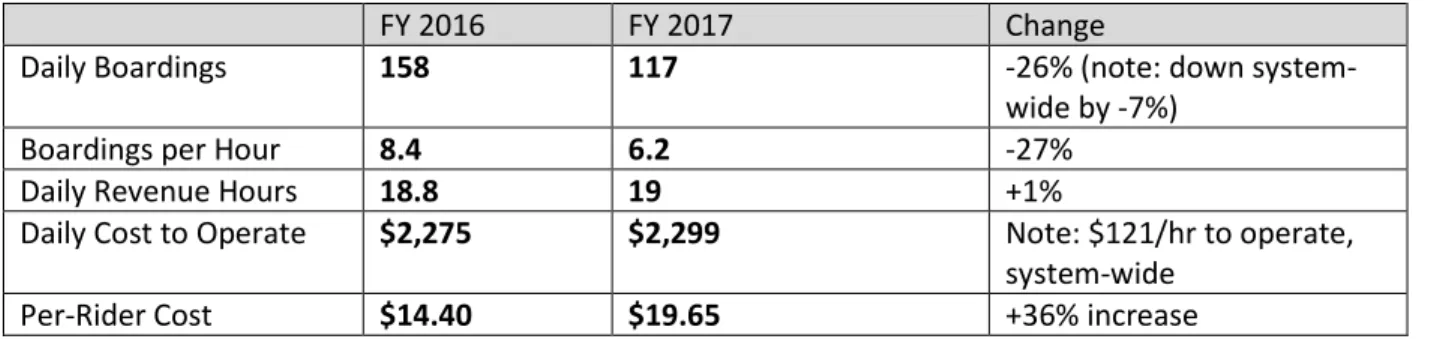
Performance data for the shuttles was comparatively lower than the rest of the system. The shuttles had decreasing ridership from 2016 to 2017, and although GoTriangle experienced a system-wide decline of 7 percent, the shuttle ridership dropped by 26 percent. Given that system-wide, GoTriangle’s buses cost $121/hr to operate, this represents a per-rider cost on the shuttles of $14.40 in FY2016 which increased to $19.65 in FY2017.
0% 10% 20% 30% 40% 50%
Speed of the bus ride to your destination
Buses running
on-time Frequency ofservice Hours the busesoperate conct/ns btwEase making GoTriangle & Oth
systems
Connections between Triangle
Transit buses
Satisfaction with GoTriangle Service Elements
(Source: On-board Survey 2016, Shuttle Riders Only)
Very poor 2 3 4 5 6 Excellent
0% 10% 20% 30% 40% 50% 60%
0 vehicles 1 vehicle 2 vehicles 3+ vehicles
Vehicle Availability
Table 7. GoTriangle Shuttle Performance Data 2016-2017
FY 2016 FY 2017 Change
Daily Boardings 158 117 -26% (note: down
system-wide by -7%)
Boardings per Hour 8.4 6.2 -27%
Daily Revenue Hours 18.8 19 +1%
Daily Cost to Operate $2,275 $2,299 Note: $121/hr to operate, system-wide
Per-Rider Cost $14.40 $19.65 +36% increase
GoTriangle uses a standard hourly operating cost across all of its routes. This makes it difficult to attribute specific costs to the former shuttles and to OnDemand operations going forward. One of the methods proposed by GoTriangle’s Data Technician was to use provision of service using revenue hours: the shuttles were 4.17 percent of GoTriangle’s total revenue hours in 2017, which represents
$721,938.47
GoTriangle administered an on-board survey to shuttle riders in mid-2017 to gauge the readiness of current shuttle riders to use a new demand-responsive service. The results found that the majority of riders were well-positioned to understand the technology and setup of the new Go OnDemand transit service (for more detailed survey results, see Appendix A: Surveys). The current shuttle riders were overwhelmingly committed to transit in RTP—not necessarily because they were in favor of the OnDemand pilot, but possibly because some are transit-dependent—and only 3 percent of current GoTriangle shuttle users said that they would use GoTriangle less because of the change to the on-demand transit service. The riders also indicated that the most common way they planned on hailing the on-demand service was via smartphone or tablet. Of the seven respondents who indicated that they would call GoTriangle to hail the on-demand service, three of the respondents selected no other option, indicating that calling may be their only way to access the service, and pointing to the importance of having a call option (see Appendix A: Surveys). Finally, GoTriangle assessed how familiar the riders were with TNCs (e.g., Uber or Lyft). Over a third of current and potential GoTriangle shuttle riders (38 percent) had not used Uber or Lyft in the past 30 days, and 19 percent of current riders have used Uber of Lyft four or more times in the past 30 days. This data suggests a mix of confidence with Uber, Lyft, and other ride-hailing services among current and potential shuttle riders.48
47 Chris Clark to Katy Lang, “Cost Analysis,” December 13, 2017.
Compiled Performance Indicators
A list of evaluation indicators and measures are compiled into Table 8. This comprehensive list draws from Go OnDemand goals, industry standards, and peer comparison. Table 8 includes the names of the performance indicators, the standard (if available), a definition of what we are measuring, the source of the data that is needed, and where the indicator came from (the source).
As a reminder, GoTriangle's objectives for this pilot are as follows:
1. Increase ridership to/from stops in the on-demand service area to 200 daily. We currently experience an average of approximately 120 boardings per weekday on the 4 fixed-route shuttles.
2. Of the 200 trips, 50 direct trips made that would not require a transfer at Regional Transit Center from residences in the service zone.
3. Create new demand from the area around Woodcroft to destinations within the on-demand service area because they can be made with shorter trips (i.e., transfers can be made at stops along NC54).
4. Create new demand from the area around Falls Pointe Apartments to destinations within the on-demand service area because they can be made with direct trips or fewer transfers (if connecting to a route at the RTC).
5. Reduce vehicle miles travelled (both by GoTriangle-operated vehicles and customer trips) compared to current levels.
6. Alternately, if we don't generate new demand, we'd like to serve the current level of 120 boardings with 25 percent fewer hours of service.49
Table 8. Comprehensive List of Performance Indicators
Performance
Indicator Definition / Measure Shuttle Baseline Standard Goal Data Source
NTD
VMT Vehicle miles traveled 410
miles/day < 410 miles/day TransLoc NTD, GoTriangle Objectives Revenue hours If additional demand not generated,
reduce service hours by 25% 19 service hours 14.25 service hours
TransLoc NTD, GoTriangle Objectives
Operating Cost
per Revenue Hour Total operating cost / total revenue hours $121 $45-$50 GoTriangle + TransLoc NTD, TCRP Report 124 p53 Safety Incidents
per 100,000 Vehicle Miles
(NTD major + non-major safety incidents /
total vehicle miles) x 100,000 Minimize GoTriangle NTD, TCRP Report 124
Passenger miles Passenger miles traveled Depends GoTriangle NTD
TCRP Report 124 Passenger Trips
per Revenue Hour Productivity = total passenger trips / total revenue hours 6.2 2.92 - 4.7 trips TransLoc TCRP Report 124 p52 On-Time
Performance (Total on time trips, including no shows + early trips) / (total completed trips + no shows + missed trips)
90% on-time
pick-ups On time as ride plus wait time is <35 minutes
TransLoc TCRP Report 124 p42 – norm GoTriangle
Operating Cost per Passenger Trip
Total operating cost / total passenger trips $19.65 $9.00 - $17.09, up to $26.95
GoTriangle
+ TransLoc TCRP Report 124, Potts 2010, OCTA
TransitCenter
Offset time Difference in the time between preferred
departure time and actual departure time Minimize Unknown TransitCenter Spontaneity time Difference in time between being ready to
travel and earliest departure time Minimize Unknown TransitCenter
Wait time Amount of time between end of trip
Performance
Indicator Definition / Measure Shuttle Baseline Standard Goal Data Source
Travel time prediction accuracy
Percent difference between predictions and actual travel time / percent of travel time predictions within a set time window / absolute difference in prediction vs actual travel time
Minimize Unknown TransitCenter
Average passenger trip length
Average passenger trip length (in miles) Minimize TransLoc TransitCenter
Average travel
time Average travel time (in minutes) Minimize TransLoc TransitCenter
Bus Wait Time Length of time that the buses wait for passengers before pick-up at pick-up location
Minimize TransLoc TransitCenter
Rider satisfaction How satisfied are riders with the current
service 73 percent of shuttle
riders rated GoTriangle a 5, 6, or 7 on a scale ranging from very poor (1) to excellent (7)
GoTriangle Go
OnDemand Rider Survey
TransitCenter
Other
Attrition Return customers and percent new riders Minimize
attrition TransLoc Boardings Per Day Number of people boarding the buses
each day 117 200 TransLoc GoTriangle Objectives
Locations of Trips Locations of Trips 50 trips not
involving RTC, trips
Performance
Indicator Definition / Measure Shuttle Baseline Standard Goal Data Source
located in Woodcroft or Falls Pointe Downtime Percent time that vehicle isn’t making a
trip Minimize Unknown GoTriangle
Window of arrival
time Comparison of vehicle arrival time at RTC to “pulse” Within 5 minutes before the :00 and :30
Selected Performance Indicators
Based on the availability of data, the priority to asses Go OnDemand against its goals, relevance to demand-responsive service, and feedback from GoTriangle, the following performance indicators have been chosen to focus on for this stage of the evaluation.
Note: as additional data are created or priorities for the pilot change, these performance indicators may be modified. These include passenger-centric indicators such as Offset Time, Spontaneity Time, Travel Time Prediction Accuracy, Downtime, Bus Wait Time, and Rider Satisfaction. Note: NTD-required data will be compiled by GoTriangle staff, including Safety Incidents per 100,000 Vehicle Miles, and Attrition.
Table 9. List of Selected Performance Indicators for Go OnDemand
Performance Indicator Definition / Measure Shuttle
Baseline Standard Goal Source Boardings Per Day Number of people boarding the buses each
day 117 200 GoTriangle Objectives
Revenue hours If additional demand not generated, reduce
service hours by 25% 19 service hours 14.25 service hours NTD, GoTriangle Objectives Operating Cost per
Revenue Hour Total operating cost / total revenue hours $121 $45-$50 NTD, TCRP Report 124 p53 Operating Cost per
Passenger Trip Total operating cost / total passenger trips $19.65 $9.79 - $17.09, up to $26.95
TCRP Report 124, Potts 2010, OCTA
Passenger Trips per
Revenue Hour Productivity = total passenger trips / total revenue hours 6.2 2.92 - 4.7 trips TCRP Report 124 p52
VMT Vehicle miles traveled 410
miles/day < 410 miles/day NTD, GoTriangle Objectives
Passenger miles Passenger miles traveled Depends NTD
Average passenger trip
length Average passenger trip length (in miles) Minimize TransitCenter
Average travel time Average travel time (in minutes) Minimize TransitCenter
Wait time Amount of time between end of trip
planning and being en route Minimize TransitCenter, OCTA
On-Time Performance (Total on time trips, including no shows + early trips) / (total completed trips + no shows + missed trips)
90% on-time pick-ups
On time as ride plus wait time is <35 minutes
TCRP Report 124 p42 – norm GoTriangle
Window of arrival time Comparison of vehicle arrival time at RTC to
“pulse” Within 5 minutes before the :00
and :30
GoTriangle
Locations of Trips Locations of Trips 50 trips not
Data Collection Plan
This data collection plan is an approach that can be applied as more data becomes available. With only four weeks (20 service days) of data included in this analysis, it does not attempt to evaluate the overall success of the pilot, but it does provide a framework for metrics that can be gathered easily again using the same data inputs. I recommend a post-pilot six-month evaluation, as well as regular quarterly evaluation of the selected performance indicators should the pilot turn into permanent service. TransLoc
The time period for which an initial data analysis will be done is January 22, 2018 to February 16, 2018. This represents 20 days of service. TransLoc collects data via its dispatch system and deploys it to GoTriangle via its admin portal. The system collects geo-coded and time-stamped information about rides and is a valuable source for future data analysis. It also allows GoTriangle Dispatch to see in real-time who is being picked up, who has requested rides, and which vehicles are out in the field. Woodcroft and Falls Pointe
Given that GoTriangle is interested in providing better transit service for residents, spatial relationships between Go OnDemand’s rides and the following apartment complexes will be examined.
The following apartment complexes fall within or immediately adjacent (<0.25 miles) to the service area:
• Falls Pointe at the Park Apartments
• Colonial Grand at Research Park
• Villages at Ellis Crossing Apartments
• Indigo Apartment Homes
• Avellan Springs Apartments
• Reserve at Arringdon
• Featherstone Village Apartments
• Parkside Place Apartments
• Chancery Village
• Triangle Park Apartments
• Stonesthrow Apartments
• Emerald Forest Apartment Homes
Meetings and Trainings
I attended multiple training sessions and a pilot test with GoTriangle and TransLoc. My meeting notes are summarized in Appendix E: Other.
Rider Survey
Survey Protocol can be found in Appendix A: Surveys. Survey was not administered in time to collect data for this document, but will be deployed on the Go OnDemand website, on board the vehicles, and potentially via the TransLoc app.
Figure 10. Maps of Apartments within Service Area
Analysis
Four Weeks Summary
This section describes the first few weeks of the Go OnDemand pilot through anonymized data from the TransLoc Rider App and analysis done through GIS. The first 4 continuous weeks after a major
snowstorm in mid-January 2018 were selected as a fairly representative set of weeks for the initial data analysis.
This section attempts to answer, where are people going? How long are their trips? How long are they waiting? What is their ride experience like?
Overview of Ride Statistics in Four Week Period
During the period from January 22, 2018 to February 16, 2018:
For additional detail calculated from the TransLoc Data, see Appendix D: Go OnDemand Data.
Review of Go OnDemand Objectives
Objective #1
The ridership over the examined four-week period averaged 110 daily passengers.
Objective #1 (increasing ridership to 200 daily) is considered NOTYET MET.
Objective #2
Over twenty-five percent of rides during this period didn’t end or begin at RTC, which averages out to twenty-seven rides not involving the RTC each day. While that is an impressive number given that previous service always involved the RTC, it falls short of the 50-ride goal. Put another way, however,
2,495
rides
110
average daily
passengers
148
distinct riders
(96% of trips)
1.03
average vehicle
capacity
39%
trips originated at
RTC
36%
trips terminating
at RTC
11.9 minutes
average ride
duration
8.1 minutes
average wait time
73%
rides sourced by
rider app
61% rides
had no
intermediate stops
21% rides
had 1 intermediate
stop
3.7 miles
average ride
GoTriangle is meeting a goal of approximately 25 percent of rides not involving the RTC, since its original goal was 200 daily rides with 50 not involving RTC (25 percent).
Objective #2 (50 trips made not requiring transfer at RTC) is considered PARTLYMET.
Objective #3 and #4
Go OnDemand service serves at least twelve apartment complexes, which is at least ten more than were served by the previous shuttle routes.
Go OnDemand’s Objective #4 was to create new demand from the area around Falls Pointe Apartments to destinations within the on-demand service area. I used GIS to see which origins and destinations were within 0.5 miles of the 12 identified apartment complexes, including Falls Pointe.
This analysis captured 53 rides in the 4-week analysis period originating from stops nearby any of the twelve apartment complexes. Of those 53 trips that originated from those stops (listed below), 18 went to the RTC, 21 to Bright Horizons, and 14 to Walmart.
• #1358 – Page Rd at Crown Pkwy (Avellan Springs Apartments)
• #6277 – S Alston Ave at Falls Pointe Apts (SB)
• #6584 – S Alston Ave at Falls Point Apts (NB)
The analysis also captured 30 rides terminating at stops nearby one of the twelve apartment complexes. Of those 30 trips that terminated at those stops, 20 originated at Bright Horizons, 8 at Walmart, and 2 at Cisco and LC Industries (stops listed below).
• #1563 – Slater Rd at Emperor Blvd (Bright Horizons)
• #1718 – Emperor Blvd. at LC Industries
• #1800 – Louis Stephens Dr. at Cisco (Building 12)
• #1937 – NC 54 at Shiloh Glenn Dr (Walmart)
When this analysis is re-run using a 0.75-mile buffer around apartment complexes (as shown in Figure 11), the number of rides jumps to 173 rides that do not originate or terminate at the RTC.
Objective #3 (new demand from the area around Woodcroft) is considered MET. Objective #4 (new demand from the area around Falls Pointe Apartments) is
considered MET.
apartment complexes of: Colonial Grand at Research Park, Villages at Ellis Crossing Apartments, Chancery Village, Parkside Place Apartments, and Indigo Apartment Homes.
Objective #5
GoTriangle goal was to reduce VMT of its vehicles and passengers compared to current levels. Former shuttle service traveled approximately 410 miles per day across the 4 vehicles. Under Go OnDemand in the examined 4-week period, average VMT per day is 828 miles across the 4 vehicles.
Objective #5 (reduce VMT compared to current levels) is considered NOT MET.
Objective #6
The hours of service of the vehicles is important to calculating operating costs and productivity. As shown in the timetable below, one shuttles serves all day (6:30am-6:30pm), two shuttles are added during the peaks (6:30am-9:30am and 3:30pm-6:30pm), and an additional shuttle is added during the evening peak (3:30pm-6:30pm). This is a total of 27 hours of vehicle revenue hours.
According to GoTriangle’s Data Technician, Operations makes decisions on number of vehicles three times per year, and in April 2018 they will adjust the number of vehicles for Go OnDemand. Four vehicles will run during peak (as shown in Table 10 below), but three of the four vehicles will have service hours reduced by 3.5 vehicle hours starting April 30.50
Table 10. Go OnDemand Vehicle Revenue Hours and Schedule
Vehicle Revenue Hours and Schedule
A.M. Peak Hours P.M. Peak Hours Hours
Vehicle 1 6:30- -6:30 12
Vehicle 2 6:30-9:30 3:30-6:30 6 Vehicle 3 6:30-9:30 3:30-6:30 6
Vehicle 4 3:30-6:30 3
27
Objective #6 (if no new demand, serve the current level of 120 boardings with 25 percent fewer hours of service) is considered NOT YET MET.51
Window of Arrival Time
An important metric that was identified by GoTriangle was the window of arrival time. This was
important to capture because many passengers of the old shuttle service relied on regional connections
50 Chris Clark to Matthew Frazier et al., “RE: OnDemand Ridership,” March 5, 2018.