Home Ownership and Neighborhood Quality:
Examining the Outcomes of Individual Development Account
Home-Ownership Program Participants in Forsyth County, NC.
A Masters Project submitted to the faculty of the University of North Carolina
at Chapel Hill in partial fulfillment of the requirements for the degree of Master
of City and Regional Planning in the Department of City and Regional Planning
.Author: Joseph Omozokpea
Advisor:
1
Table of Content
Table of Content ... 1
List of Tables ... 3
List of Figures ... 4
ACKNOWLEDGEMENTS ... 5
ABSTRACT ... 6
INTRODUCTION ... 7
Individual Development Accounts ... 8
Definition and Description of Research Question ... 8
LITERATURE REVIEW ... 12
Benefits of Home-ownership to Families... 12
Children Outcomes ... 14
Benefit of Home-ownership to the Larger Community ... 15
Cost of Home-ownership ... 16
Why does Neighborhood Quality Matter? ... 17
Indicators of Neighborhood Quality ... 18
Individual Development Accounts and Home-ownership ... 19
DATA ANALYSIS ... 21
Sources of Data ... 21
Methods ... 22
Neighborhood Quality Index ... 23
Neighborhood Change Score ... 24
Matching Participants to Neighborhood Score ... 25
Quantitative Data Analysis Approach ... 25
Limitations of the Study ... 29
RESULTS ... 30
Old Neighborhood Quality versus New Neighborhood Quality ... 30
Neighborhood and Age of IDA Participants ... 35
New Neighborhood Score and Age of IDA Participants ... 35
2
Neighborhood and Race of IDA Participants ... 38
New Neighborhood Score and Race of IDA Participants ... 38
Neighborhood Change Score and Race of IDA Participants ... 40
Neighborhood and Marital Status of IDA Participants ... 41
New Neighborhood Score and Marital Status of IDA Participants ... 41
Neighborhood Change Score and Marital Status of IDA Participants ... 43
Neighborhood and Household Size of IDA Participants ... 44
New Neighborhood Score and Household Size of IDA Participants ... 44
Neighborhood Change Score and Household Size of IDA Participants ... 46
Neighborhood and Gender of IDA Participants ... 47
New Neighborhood Score and Gender of IDA Participants ... 47
Neighborhood Change Score and Gender of IDA Participants ... 49
DISCUSSION ... 51
CONCLUSION ... 53
REFERENCES ... 54
3
List of Tables
Table 1: Neighborhood Quality Index ... 24
Table 2: Age Composition of IDA Participants ... 26
Table 3: Age Composition of IDA Participants ... 27
Table 4: Marital Status of IDA Participants ... 27
Table 5: Household Size of IDA Participants ... 28
Table 6: Gender of IDA Participants ... 28
Table 7: Results - Old Neighborhood Score versus New Neighborhood Score ... 30
Table 8: Neighborhood Outcome of IDA Home-ownership Program Participants ... 31
Table 9: Result - New Neighborhood Score of IDA Participants by Age Range ... 35
Table 10: Neighborhood Score of IDA Participants by Age... 36
Table 11: Neighborhood Change Score by Age ... 37
Table 12: Result - New Neighborhood Score of IDA Participants by Race ... 38
Table 13: Neighborhood Score of IDA Participants by Race ... 39
Table 14: Result - Neighborhood Change Score by Race ... 40
Table 15: Result - New Neighborhood Score of IDA Participants by Marital Status ... 41
Table 16: Neighborhood Score of IDA Participants by Marital Status ... 42
Table 17: Result - Neighborhood Change Score by Marital Status ... 43
Table 18: Result - New Neighborhood Score of IDA Participants by Household Size ... 44
Table 19: Neighborhood Score of IDA Participants by Household Size ... 45
Table 20: Result - Neighborhood Change Score by Household Size ... 46
Table 21: Result - New Neighborhood Score of IDA Participants by Household Gender ... 47
Table 22: Neighborhood Score of IDA Participants by Gender ... 48
4
List of Figures
Figure 1: Purchased Home Location for IDA Participants (1990-1999) ... 32
Figure 2: Rental Home Location for IDA Participants (1990-1999) ... 32
Figure 3: Figure 2: Purchased Home Location for IDA Participants (2000 - 2009) ... 33
Figure 4: Rental Home Location for IDA Participants (2000 - 2009) ... 33
Figure 5: Purchased Home Location for IDA Participants (2010 - 2016) ... 34
Figure 6: Rental Home Location for IDA Participants (2010 - 2016) ... 34
Figure 7: Neighborhood Change Score of IDA Participants by Age ... 38
Figure 8: Neighborhood Change Score of IDA Participants by Race ... 41
Figure 9: Neighborhood Change Score of IDA Participants by Marital Status ... 44
Figure 10: Neighborhood Change Score of IDA Participants by Household Size ... 47
Figure 11: Neighborhood Change Score of IDA Participants by Gender ... 50
Figure 12: Average Neighborhood Score by Program Year... 58
Figure 13: Average Neighborhood Quality Change by Program Year ... 58
Figure 14: Neighborhood Change by Age Group ... 59
Figure 15: Neighborhood Change by Marital Status ... 59
Figure 16: Neighborhood Change by Race ... 60
Figure 17: Neighborhood Change by Household Size ... 60
5
ACKNOWLEDGEMENTS
This Master’s project would not have been possible without the dedication of
many individuals. Most notable is my adviser and mentor Dr. Mai Thi Nguyen who
provided phenomenal guidance and encouragement throughout this project.
UNC-Chapel Hill GIS librarian Philip McDaniel and research staff at the Davis Library
Research Hub who provided additional support. Forsyth County Department of
Community Development who opened their doors and shared information that made
this project possible and finally, my family and friends who offered immeasurable
support and encouragement.
My experience working on this project has strengthened my interest and belief in
the importance of community development as a tool for triggering and sustaining
upward socioeconomic mobility. It is my hope that this study initiates important dialogue
and shapes vibrant policies that provide access to opportunities for socioeconomic
6
ABSTRACT
Publicly funded programs that promote access to home-ownership among
low-income families are guided by the conviction that home-ownership is a path to economic
growth and financial stability. This idea is increasingly being questioned as recent studies
show that home-ownership alone does not guarantee access to socio-economic mobility.
Neighborhood quality and access to opportunities play a more important role in upward
socio-economic mobility.
This study examines the outcome of an Individual Development Account
home-ownership Program in Forsyth County North Carolina in terms of improvement in
neighborhood quality experienced by participants who transition from rental housing to
homeownership. It finds that most participants attain improved neighborhood
conditions in addition to home-ownership which may translate into upward
socio-economic mobility. Recommendations include sustaining IDA home-ownership
programs while placing further emphasis on the quality of neighborhoods where
participants purchase homes as well as increased intervention to revitalize already
distressed neighborhoods to expand opportunities for upward socio-economic mobility
to those who are unable to transition to high-opportunity neighborhoods.
7
INTRODUCTION
Government intervention in home-ownership programs is driven by the
connection between home-ownership and social mobility. The transition from rental
housing to homeownership is often considered a step towards upward social mobility
(DiPasquale & Glaeser, 1999). The benefits of home-ownership are not linked to families
alone. In addition to long-term economic and social development, several positive
externalities associated with homeownership include higher levels of involvement in
community improvement groups, such as homeowners association and neighborhood
watch programs, improved academic performance and lower likelihood of engaging in
socially destructive behaviors among children (Green & White 1997).
The transition from renting to home-ownership does not always result in the
previously mentioned outcomes if families do not experience significant improvement in
neighborhood quality. Neighborhood conditions, such as low concentration of poverty
and high employment have been linked to upward socioeconomic mobility (Ellen
&Turner, 1997). With rising housing costs, low-income families increasingly depend on
home-ownership programs such as Individual Development Accounts to enable them to
8
Individual Development Accounts
Individual Development Accounts (IDAs) are asset creation programs that
provide participants (low-income earners) matching funds for the purpose achieving
asset based goals including starting a business, furthering post-secondary education or
purchasing a home. IDA programs have gained recognition over the years as an effective
approach to achieving home-ownership among low-income families. In addition to
matched savings, IDA programs offer financial education classes, case management and
asset-specific education such as home-buyers education to ensure successful outcomes
for the participant (Grinstein‐Weiss, Irish, Parish, & Wagner, 2007).
IDAs are distinct from other welfare programs particularly through the emphasis
on combining social provision with individual control and responsibility. They are
designed to encourage long-term planning as well as the development of saving and
investment culture which is critical for low-income families to succeed in
home-ownership and avoid foreclosure (Sherraden, 1991).
Definition and Description of Research Question
The impact of home-ownership and transition to higher quality neighborhoods
among low-income families have been examined in depth, but less so in relation to
9
deliver on neighborhood quality? Is there a connection between characteristics of
program participants and likelihood to transition to better neighborhoods? This study
seeks to examine the change in neighborhood quality experienced by low-income
families who participate in Individual Development Account (IDA) programs in Forsyth
County, North Carolina as they transition from rental housing to homeownership. This
study also examines the relationship between demographic characteristics of program
participants such as race, age, gender, family size as well as head of household’s marital
status and the likelihood to transition to better neighborhood through IDA
home-ownership programs. Based on the above research, the following hypotheses are tested:
H1: There is no significant improvement in neighborhood quality of IDA
home-ownership program participants.
H2a: There is no significant relationship between neighborhood quality and age
of IDA home-ownership program participants.
H2b: There is no significant relationship between the degree of change in
neighborhood quality and age of IDA home-ownership program
participants.
H3a: There is no significant relationship between neighborhood quality and race
10
H3b: There is no significant relationship between the degree of change in
neighborhood quality and race of IDA home-ownership program
participants.
H4a: There is no significant relationship between neighborhood quality and
marital status of IDA home-ownership program participants.
H4b: There is no significant relationship between the degree of change in
neighborhood quality and marital status of IDA home-ownership program
participants.
H5a: There is no significant relationship between neighborhood quality and
household size of IDA home-ownership program participants.
H5b: There is no significant relationship between the degree of change in
neighborhood quality and household size of IDA home-ownership program
participants.
H6a: There is no significant relationship between neighborhood quality and
11
H6b: There is no significant relationship between the degree of change in
neighborhood quality and gender of IDA home-ownership program
12
LITERATURE REVIEW
Several studies have examined the benefits of homeownership and neighborhood
quality independently and taking both into consideration. The majority of findings
suggest that homeownership and improved neighborhood quality are beneficial to
families in several ways ranging from wealth creation to career opportunities and
improved educational outcome for children, but the results are not consistent. Other
studies suggest that homeownership could affect low-income and minority population
negatively through loss of capital invested in the purchase of a home. Rather than
focusing solely on home-ownership as a means of asset accumulation, neighborhood
quality and financial literacy should be considered with the decision of home-ownership
to realize positive outcomes to low-income families.
Benefits of Home-ownership to Families
Housing condition and neighborhood quality, regardless of tenure, has a positive
effect on self-esteem. Although low-income homeowners do not generally show
improved self-esteem upon owning their first home, they record significant increase in
level of life satisfaction as well as greater sense of control over their lives (Rohe and
13
is linked to physical and psychological health, therefore home ownership could have a
direct positive impact on the health and welfare of the homeowner.
Home-ownership also serves as a form of investment. Home equity accounts for
roughly 35% of median household wealth and the highest single component of household
wealth excluding pension-related investments (Hurst, et al. 1998). Householders who live
in owner-occupied housing accumulate greater wealth in the long run than their
counterparts who live in rental housing even when they share similar education, location,
income, and other personal characteristics (Zhu Xiao et al, 2007). This trend could reflect
the propensity of individuals with better financial literacy skills to own homes, but it
could also be due to the fact that personal expenses in the form of rent are never
recovered, however, monthly mortgage payments translate into home equity and can be
recovered upon sale of the house at equal or higher value.
While home-ownership accounts for a significant portion of total assets owned by
low-income and minority families, the neighborhood in which they live may have
detrimental effect on the value of their homes in the long-term. Black homeowners
generally live in neighborhoods with lower property values, higher poverty rates, and
distressed properties, hence, they are not exposed to equal home-ownership benefits
14
Householders who own and reside in their homes also enjoy financial benefits in
the form of tax refunds that come from itemized deductions such as mortgage interest
deductions, state and municipal property taxes and certain home repairs on their annual
tax returns. Occupants of rental housing are not eligible for such tax benefits even if their
annual housing expense exceeds that of a homeowner in the same tax bracket (Snider, M.
2005). Without home-ownership programs like IDA which expand home-ownership
opportunities to low-income families, such financial benefits would be available
exclusively to the middle class and wealthy members of society who can afford to buy
homes without any form of assistance.
Children Outcomes
In their study of home-ownership benefits to children, Haurin, Parcel, and Haurin
(2002) concluded that children of homeowners had fewer child behavior problems,
greater cognitive ability and they experienced 13-23% higher quality home environment.
Thomas and Alan (1999) found in a similar study that children of homeowners are more
likely to have higher educational attainment, greater earning potential and are more
likely to become homeowners themselves.
The benefits of homeownership to children are not tied to this form of housing
15
does not suggest that home-ownership alone guarantees successful outcome on children.
Residential stability, and access to decent living condition are some of the underlying
attributes associated with home-ownership that result in positive outcomes for children
(Mohanty and Raunt, 2009). In situations where children raised in rental housing are
exposed to similar neighborhood quality and opportunities, they are likely to do as well
as children of homeowners (Baker, 2013).
Benefit of Home-ownership to the Larger Community
Deeply rooted in the American political thought is the idea that property
ownership is a central component of political involvement and community engagement
(Keyssar, 2000). Residential stability is likely to lead to the establishment of social
networks and community ties that drive community participation. Individuals who are
invested in their communities through home-ownership tend to participate more in
community-wide decision-making processes and civic engagements such as voting and
participating in neighborhood groups (Rohe and Stegman, 1994). Residential stability
which is closely associated with home-ownership could also be another reason why
homeowners are more involved in community affairs at a rate significantly higher than
16
Cost of Home-ownership
While home-ownership is associated with several positive outcomes, several
studies have found that home-ownership may not always yield positive outcomes for
low-income families. Belsky and Duda (2002) found that rather than building wealth
through accumulated interest in equity, low-income homeowners often experience
depreciating property values, indicating a decline in neighborhood character where they
buy homes and suggesting that many low-income families are not well informed of the
risk of home-ownership. Similarly, Van Zandt and Rohe (2006) found that most
low-income home buyers remained in neighborhoods similar those in which they lived as
renters while continuing renters experienced neighborhood improvement over time.
Without proper financial education and home-buyers education that emphasize the
benefits of neighborhood quality on property value, low-income families may fall further
into debt through home-ownership.
Lindbald and Quercia (2015) also report that the non-financial benefits associated
with owning a home including increased civic engagement, duration of tenure and the
resident’s sense of control which previous studies have found to be linked to home
ownership could be leveraged to benefit renters. Low-income families that can find
17
are likely to attain similar outcomes as their counterparts who transition to home
ownership in neighborhoods of similar quality.
Why does Neighborhood Quality Matter?
Studies on the benefits of home-ownership highlight asset creation, positive health
outcomes, increased educational attainment, increased residential stability and higher
level of involvement in community development as some of the benefits. While it has
been established that some of these benefits can be achieved by renters, it remains evident
that stability and neighborhood characteristics have greater impact on the educational
attainment, employment potential and delinquency rate among children (Ellen and
Turner, 1997).
Sampson, Morenoff, and Earls (1999) report that children who experience
residential stability and are raised in high-income neighborhoods are more likely to
demonstrate positive outcomes in terms of academic performance and career outcomes.
They also suggest that the impact of positive neighborhood qualities such as high
employment rate and high income are stronger than the impacts of neighborhood
qualities considered to have negative effect on the welfare of children such as crime rate,
18
With the benefits of neighborhood quality brought to light, it is important that
home-ownership programs designed with the goal of asset creation and upward mobility
for low-income families take into consideration the neighborhoods in which program
participants purchase homes. Home-ownership without improved neighborhood quality
and access to opportunities may not result in improved outcomes for low-income
families.
Indicators of Neighborhood Quality
The importance of neighborhood quality cannot be overemphasized. It is a prime
determinant of access to opportunities and socio-economic outcome of residents,
therefore, it remains an important subject in planning and public policy. The
development guidelines built into the zoning ordinance of almost every municipality in
the country proves that government at all levels recognize the importance of creating and
maintaining decent neighborhood conditions.
Despite the importance of neighborhood quality, it remains a difficult subject to
quantify. In an assessment of neighborhood quality, Mast (2010) found that poverty
rates, median income, and indicators of census tracts receiving low-income housing tax
credits were highly correlated with U.S Department of Housing and Urban Development
Customer Satisfaction Survey of neighborhood quality for Section 8 Housing Choice
19
found that attempts to measure neighborhood quality that focus only on socio-economic
conditions alone such as poverty, crime and unemployment results in incomplete and
fragmentary results. More comprehensive approaches include socio-economic conditions
as well as physical neighborhood quality such as air quality, vacant housing, and home
values.
Housing value plays important role in measuring neighborhood quality as it
expresses a desire to live in places that are better off in terms of several other
neighborhood indicators. However, the cost of housing alone is not sufficient in
measuring neighborhood quality as high cost of housing may be a result of housing
shortage and not necessarily translate into better quality of life. Therefore, the most
comprehensive measure of neighborhood quality requires an index of socioeconomic as
well as physical indicators.
Individual Development Accounts and Home-ownership
Individual Development Account programs are designed to assist low-income
families in achieving goals that are linked to long-term asset creation through providing
incentives in form of matching grants to motivate saving towards those goals. IDA
programs have been highly successful, however, there are limitations to the program as
highlighted by Rohe, Gorham, and Quercia (2005) in their study which pinpoints job loss
20
participants. In the same study, they highlight economic literacy training and effective
case management as components of the program that contribute to successful outcomes.
Grinstein‐Weiss, Irish, Parish, and Wagner (2007) examined performance among
black and white participants of IDA programs and found that black participants on
average saved less than their white counterparts. They identified marital status, car
ownership, and account ownership as factors responsible for the racial savings gap
between black and white participants in the program.
Despite the savings gap identified by Grinstein‐Weiss, Irish, Parish, and Wagner
(2007), IDA program participants generally achieve their goal of home ownership.
Delgadillo (2015) reported that 93% of program participants had no trouble keeping up
with their mortgage payments and when compared to a control group, IDA participants
were found to be more confident in their financial skills. Their findings, similar to the
findings of Rohe, Gorham, and Quercia (2005) reinforce the notion that economic literacy
training and effective case management contribute to the success of IDA programs.
Although there are extensive studies on IDA programs in general, and IDA home
ownership programs in particular, there is a gap in literature on residential mobility and
neighborhood quality, more so when it comes to IDA participants. It is critical to examine
21
achieving improved neighborhood quality or if they attain home-ownership as well as
improved opportunities through enhanced neighborhood qualities.
DATA ANALYSIS
Sources of Data
This study draws primary data for the analysis from three main sources. First,
publicly available data for first-time homebuyers from 1995 to 2015 who participated in
IDA programs in Forsyth County was received from Forsyth County Department of
Housing and Community Development. The total number of participants in the period
analyzed was 699, however, 106 participants lived outside Forsyth County prior to
purchasing their homes through the program, therefore, they were excluded from the
analysis resulting in a total of 595 participants for this study. The records include
information on participants’ old address, the address of houses purchased through the
program, and demographic characteristics of program participants such as age, race,
gender, household size and head of household marital status…
Secondly, demographic data at the block group level was gathered for the entire
county from United States Census Bureau. This stage of data collection focused on social,
economic, and physical indicators of neighborhood quality. Information collected
22
income, average home value, unemployment and owner-occupied housing. Although
each of these attributes independently does not paint a clear picture of the quality of life
in a neighborhood, when analyzed collectively, they paint a clearer picture of living
standards and opportunities available in a neighborhood. These attributes were gathered
for a period beginning in 1990 through 2016.
Finally, publicly available Geographic Information System (GIS) shapefiles for
Forsyth County at the census block group level was retrieved from the geographic
database of the United States Census Bureau. For the purpose of accurately visualizing
the findings of this study, three shapefiles corresponding to changes in census block
group delineation for the years 1990, 2000, and 2010 were used to map the outcome. The
results of homebuyers from 1995 to 1999 were visualized using 1990 block group
delineation, homebuyers’ results from 2000 to 2009 were visualized using 2000 block
group delineation and homebuyers’ results from 2010 to 2016 were visualized using 2010
block group delineation.
Methods
The analysis of neighborhood quality for IDA participants focused on a multi-step
process. First, a neighborhood quality index was developed to rank all block groups
within the county based on socio-economic indicators. Next, the rental addresses and the
23
score for the corresponding block groups. Finally, the neighborhood scores for the rental
housing location were compared to the scores for the location of purchased homes and
analyzed for the entire sample as well as different demographics within the sample using
student’s t-test to determine if the scores for different groups within the sample are
significantly different. Results were mapped to visualize the outcome spatially.
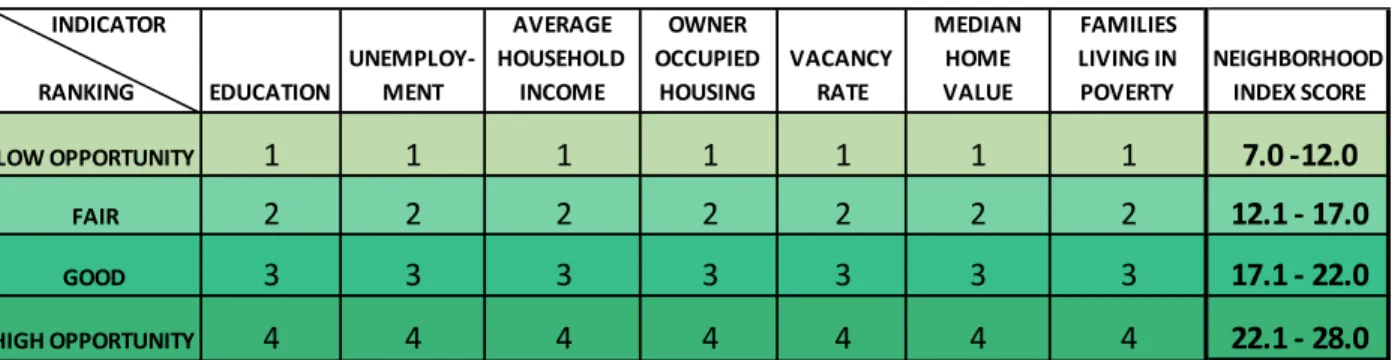
Neighborhood Quality Index
The neighborhood quality index was made up of indicators tied to socioeconomic
characteristics of residents and the community. These indicators include residents' level
of education, unemployment rate, average household income, proportion of
owner-occupied housing, vacancy rate, median home value, and proportion of families living in
poverty. The indicators were ranked by quartiles and each quartile was assigned a
corresponding score. For positive indicators, such as level of education, average
household income, proportion of owner-occupied housing and median home value, the
top quartile was assigned a score of 4, the second quartile was assigned a score of 3, the
third quartile was assigned a score of 2 and the bottom quartile was assigned a score of
1. To maintain a similar point structure, this scoring system was reversed for negative
indicators such as unemployment and proportion of families living in poverty with the
bottom quartile receiving a score of 4 and the top quartile receiving 1 point. Points for the
neighborhood quality indicators were summed up to achieve a neighborhood quality
24
and the minimum attainable score was 7. Block groups that scored within the range of
22.1 to 28 were considered high opportunity neighborhoods, scores within the range of
22 to 17.1 were considered good neighborhoods, scores from 17 to 12.1 were considered
fair while block groups that scored below 12 were considered low opportunity
neighborhoods.
Table 1: Neighborhood Quality Index
Note: Numbers 1 - 4 for each neighborhood indicator above corresponds to the quartile each block group falls into based on the total scores for all block groups in the county. 1 = bottom quartile and 4 = top quartile. The neighborhood index score reflects the total points for all seven indicators for each block group. 7 = minimum score while 28 = maximum score.
Neighborhood Change Score
The difference between the rental housing neighborhood score and the purchased
home neighborhood score indicates each participant’s neighborhood change score. The
neighborhood change score reflects the degree of improvement or decline in
neighborhood quality experienced by each participant upon transition to
home-ownership. Positive scores represent movement to better neighborhood while a score of
0 or below represents no change or decline in neighborhood quality for the participants.
Neighborhood change scores are tested across several demographic characteristics of
INDICATOR RANKING EDUCATION UNEMPLOY-MENT AVERAGE HOUSEHOLD INCOME OWNER OCCUPIED HOUSING VACANCY RATE MEDIAN HOME VALUE FAMILIES LIVING IN POVERTY NEIGHBORHOOD INDEX SCORE
LOW OPPORTUNITY 1 1 1 1 1 1 1 7.0 -12.0
FAIR 2 2 2 2 2 2 2 12.1 - 17.0
GOOD 3 3 3 3 3 3 3 17.1 - 22.0
25
participants to examine if there is significant difference in the degree of change
experienced by demographic groups.
Matching Participants to Neighborhood Score
The address for the participant's rental location as well as the addresses of the
purchased homes was geocoded using ArcGIS to obtain point data for each location. The
point data derived from each address was linked to a Federal Information Processing
Standard (FIPS) code which is unique to each geographic delineation in the country.
Using the FIPS code for all block groups in Forsyth County as a reference and unique
identifier for the addresses, the rental addresses and the addresses for purchased homes
of each participant was linked to the corresponding block group neighborhood score for
the appropriate year in which the participant’s home was purchased. With the linked
data, all participants were associated with a neighborhood score for their rental housing
location and the location of their purchased home.
Quantitative Data Analysis Approach
The study employed both independent and paired sample t-test to analyze the
outcome of IDA participants in terms of change in neighborhood quality experienced
after they transitioned from rental housing to home ownership. Both tests were analyzed
for a sample size of 595 participants at a significance level of 0.05. An independent t-test
26
among IDA participants in general upon purchase of their first homes. A paired sample
t-test was used to examine if there is significant relationship between change in
neighborhood quality experienced by IDA participants and age, race, marital status,
household size, and gender.
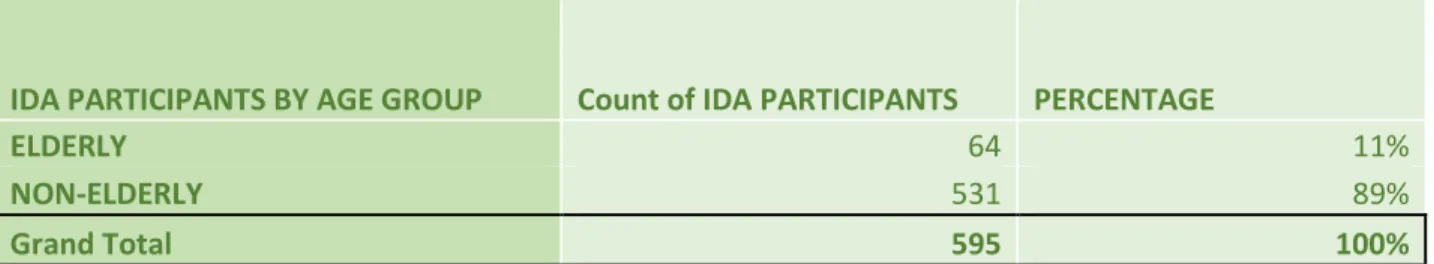
To determine the relationship between demographic characteristics of the
program participants on neighborhood quality, certain parameters were set to place
participants into appropriate groups. Age groups were split into elderly and non-elderly,
with the age range of 55 and above being classified as elderly while participants younger
than 55 were considered non-elderly. The rationale behind the age classification was
based on the age limit set by U.S. Department of Housing and Urban Development
(HUD) as the eligibility criteria for senior housing programs. 64 participants (11% of the
sample) were elderly while 532 participants (89% of the sample) were non-elderly.
Table 2: Age Composition of IDA Participants
IDA PARTICIPANTS BY AGE GROUP Count of IDA PARTICIPANTS PERCENTAGE
ELDERLY 64 11%
NON-ELDERLY 531 89%
Grand Total 595 100%
Note: Age classification is based on U.S. Department of Housing and Urban Development eligibility criteria for elderly housing. Elderly = Age 55 and above. Non-Elderly = below age 55.
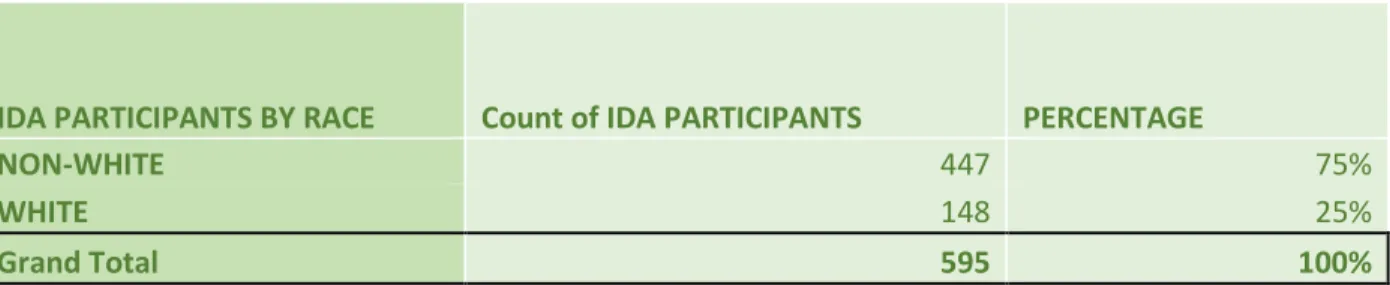
Racial classification was set by participant’s self-identified racial group.
27
identified as African-American, Asian, Hispanic, Native American and other minority
racial groups were classified as white. 447 participants (75% of the sample) were
non-white, with black participants comprising 90% of that sub-group (405 participants). 148
participants (25% of the sample) were white.
Table 3: Age Composition of IDA Participants
IDA PARTICIPANTS BY RACE Count of IDA PARTICIPANTS PERCENTAGE
NON-WHITE 447 75%
WHITE 148 25%
Grand Total 595 100%
Note: Racial classification based on participant’s self-identified racial group.
Marital status of participants was determined by participant’s identification as
single or married. Participants who were married or lived with a partner identified as
single while participants who were not married or did not live with a partner identified
as married. 481 participants (81% of the sample) were married while 114 participants
(19% of the sample) were single.
Table 4: Marital Status of IDA Participants
IDA PARTICIPANTS BY AGE
GROUP Count of IDA PARTICIPANTS PERCENTAGE
MARRIED 481 81%
SINGLE 114 19%
28
Classification of household size was carried out using the average household size
of the participants as a benchmark for splitting the group into categories. With an average
household size of 3, the group was split into household with a total number of 3 persons
or below and households with a total number above 3 persons. 480 participants (81% of
the sample) were from households with 3 people of fewer while 115 participants (19% of
the sample) were from households of more than 3 people.
Table 5: Household Size of IDA Participants
IDA PARTICIPANTS BY
HOUSEHOLD SIZE Count of IDA PARTICIPANTS PERCENTAGE
3 OR FEWER 480 81%
MORE THAN 3 115 19%
Grand Total 595 100%
Gender classification was determined by participants self-identified gender
identity. Participants who identified as female were classified as female while
participants who identified as male were classified as male. 488 participants (82% of the
sample) were female while 107 participants (18% of the sample) were male.
Table 6: Gender of IDA Participants
IDA PARTICIPANTS BY GENDER Count of IDA PARTICIPANTS PERCENTAGE
FEMALE 488 82%
29
Limitations of the Study
The scope of this study is limited to an in-group comparison among program
participants who move within Forsyth County only. It deliberately excludes IDA
program participants who bought their first homes in Forsyth County but moved from
surrounding counties such as Yadkin, Stokes and Davie County. This group of
participants is excluded as the neighborhood quality index developed for the study is
based on census data for Forsyth County alone and cannot be used to compare the quality
of neighborhoods outside the county.
This study examines the neighborhood quality were first-time homebuyers
through IDA programs purchase their home, it is imperative to highlight that the
neighborhood score associated with each participant in this study represents the quality
of the neighborhoods at the time they buy their home and all neighborhoods are subject
to change over time. It is unlikely that the neighborhoods examined in the study have
maintained the same condition since the program participants transitioned to home
ownership.
The location of the participant’s home and the participants housing tenure
examined in this study only reflect the situation at the time of purchase. Although IDA
program participants are acquainted with some level of financial literacy which may be
30
foreclosure or natural hazards cannot be neglected. It is also possible that program
participants have maintained ownership of their homes, attained higher socio-economic
status and moved on to even better neighborhoods.
The neighborhood quality index developed for this study ranks each block group
according to quartile for all neighborhood indicators examined. The study ranking only
recognizes change in neighborhood quality from one quartile to another and does not
account for neighborhood changes that may fall within the same quartile.
RESULTS
Old Neighborhood Quality versus New Neighborhood Quality
Table 7: Results - Old Neighborhood Score versus New Neighborhood Score
Pr(T < t) = 0.0000 Pr(|T| > |t|) = 0.0000 Pr(T > t) = 1.0000 Ha: mean(diff) < 0 Ha: mean(diff) != 0 Ha: mean(diff) > 0 Ho: mean(diff) = 0 degrees of freedom = 594 mean(diff) = mean(OLD_NEIGHBORHO~X - NEW_NEIGHBORHO~X) t = -11.4396 diff 595 -2.663866 .2328628 5.680134 -3.1212 -2.206531 NEW_NE~X 595 17.21345 .1777759 4.336419 16.8643 17.56259 OLD_NE~X 595 14.54958 .2024333 4.937878 14.15201 14.94715 Variable Obs Mean Std. Err. Std. Dev. [95% Conf. Interval] Paired t test
31
Table 7 shows the result of a paired sample t-test for old neighborhood quality versus
new neighborhood quality of IDA participants. Hypothesis 1 states that there is no
significant improvement in neighborhood quality of IDA program participants. The
hypothesis is rejected. There was a significant difference in the neighborhood scores for
participants’ old neighborhood (M = 14.5, SD = 0.20) and new neighborhood (M = 17.2,
SD = 0.17) conditions; t (594) = -11.4, p=0.000. The results suggest that participants of IDA
home-ownership program in Forsyth County NC experience significant change in
neighborhood quality. Specifically, the results suggest that IDA program participants in
Forsyth County NC move to better neighborhoods when they transition to
home-ownership.
Table 8: Neighborhood Outcome of IDA Home-ownership Program Participants
IDA
PARTICIPANTS NEIGHBORHOOD OUTCOME
Count of IDA
PARTICIPANTS PERCENTAGE
Average of OLD NEIGHBORHOOD SCORE
Average of NEW NEIGHBORHOOD SCORE
Average of NEIGHBORHOOD CHANGE SCORE DECLINED/NO
CHANGE 218 37% 18.3 15.0 -3.2
IMPROVED 377 63% 12.4 18.5 6.1
32
Figure 1: Purchased Home Location for IDA Participants (1990-1999)
33
Figure 3: Figure 2: Purchased Home Location for IDA Participants (2000 - 2009)
34
Figure 5: Purchased Home Location for IDA Participants (2010 - 2016)
35
Across all period examined in the study, the maps above reflect a concentration in rental
housing location in census block groups associated with lower quality neighborhoods
(shown in lighter shade of green), which are also located mostly in the central part of the
county. The maps showing location of purchased homes reflect a higher concentration of
participant’s location in census block groups that are associated with higher scores
(darker shade of green), reflecting higher neighborhood quality. This change indicates
that most IDA participants in the county move to higher quality neighborhoods when
they transition to from rental housing to home-ownership.
Neighborhood and Age of IDA Participants
New Neighborhood Score and Age of IDA Participants
Table 9: Result - New Neighborhood Score of IDA Participants by Age Range
Pr(T < t) = 0.0447 Pr(|T| > |t|) = 0.0894 Pr(T > t) = 0.9553 Ha: diff < 0 Ha: diff != 0 Ha: diff > 0 Ho: diff = 0 degrees of freedom = 593 diff = mean(ELDERLY) - mean(NON-ELDE) t = -1.7011 diff -.9745174 .5728769 -2.099632 .1505971 combined 595 17.21345 .1777759 4.336419 16.8643 17.56259 NON-ELDE 531 17.31827 .1875871 4.32265 16.94976 17.68677 ELDERLY 64 16.34375 .5483646 4.386917 15.24793 17.43957 Group Obs Mean Std. Err. Std. Dev. [95% Conf. Interval] Two-sample t test with equal variances
36
Table 9 shows the result of a paired sample t-test for new neighborhood score of IDA
participants by age range. Hypothesis 2a states that there is no significant difference in
neighborhood quality of IDA program participants by age. We fail to reject the
hypothesis. There no significant difference in the new neighborhood scores for elderly
participants (M = 16.3, SD = 0.54) and non-elderly (M = 17.3, SD = 0.18); t (593) = -1.7, p =
0.089. The results suggest that age does not have a significant effect on the quality of
neighborhoods in which IDA participants buy their homes.
Table 10: Neighborhood Score of IDA Participants by Age
IDA
PARTICIPANTS BY AGE GROUP
Count of IDA
PARTICIPANTS PERCENTAGE
Average of OLD NEIGHBORHOO D SCORE
Average of NEW NEIGHBORHOOD SCORE
Average of NEIGHBORHOOD CHANGE SCORE
ELDERLY 64 11% 14.6 16.3 1.7
DECLINED/NO
CHANGE 28 5% 19.3 14.3 -5.0
IMPROVED 36 6% 11.0 18.0 7.0
NON-ELDERLY 531 89% 14.5 17.3 2.8
DECLINED/NO
CHANGE 190 32% 18.1 15.2 -3.0
IMPROVED 341 57% 12.5 18.5 6.0
Grand Total 595 100% 14.5 17.2 2.7
37
Table 11: Neighborhood Change Score by Age
To further examine the relationship between age and neighborhood of IDA participants,
an independent t-test was carried out to examine if different age groups experienced
varying degree of neighborhood change. Table 11 shows the result of an independent
sample t-test for neighborhood change score of IDA participants by age. Hypothesis 2b
states that there is no significant difference in neighborhood change score of IDA
participants by age. We fail to reject the hypothesis. There is no significant difference in
the neighborhood change scores for elderly participants (M = 1.7, SD = 0.89) and
non-elderly participants (M = 2.7, SD = 0.23); t (593) = -1.4, p=0.159. The results suggest that
the likelihood of elderly participants of IDA home-ownership program in Forsyth County
NC to achieve higher improvement in neighborhood quality than their non-elderly
counterparts is not significant.
Pr(T < t) = 0.0795 Pr(|T| > |t|) = 0.1590 Pr(T > t) = 0.9205 Ha: diff < 0 Ha: diff != 0 Ha: diff > 0 Ho: diff = 0 degrees of freedom = 593 diff = mean(ELDERLY) - mean(NON-ELDE) t = -1.4102 diff -1.059028 .7509633 -2.533899 .4158434 combined 595 2.663866 .2328628 5.680134 2.206531 3.1212 NON-ELDE 531 2.777778 .2374953 5.472707 2.31123 3.244325 ELDERLY 64 1.71875 .8946126 7.156901 -.0689906 3.506491 Group Obs Mean Std. Err. Std. Dev. [95% Conf. Interval] Two-sample t test with equal variances
38
Figure 7: Neighborhood Change Score of IDA Participants by Age
Neighborhood and Race of IDA Participants
New Neighborhood Score and Race of IDA Participants
Table 12: Result - New Neighborhood Score of IDA Participants by Race
Table 12 shows the result of a paired sample t-test for new neighborhood score of IDA
participants by race. Hypothesis 3a states that there is no significant difference in
0.0 0.5 1.0 1.5 2.0 2.5 3.0 ELDERLY NON-ELDERLY
Average Neighborhood Change Score
of Participants
Total
Pr(T < t) = 0.0000 Pr(|T| > |t|) = 0.0000 Pr(T > t) = 1.0000 Ha: diff < 0 Ha: diff != 0 Ha: diff > 0 Ho: diff = 0 degrees of freedom = 593 diff = mean(NON-WHIT) - mean(WHITE) t = -4.1087 diff -1.667558 .4058594 -2.464655 -.8704618 combined 595 17.21345 .1777759 4.336419 16.8643 17.56259 WHITE 148 18.46622 .3382269 4.114708 17.7978 19.13463 NON-WHIT 447 16.79866 .2049228 4.332555 16.39592 17.20139 Group Obs Mean Std. Err. Std. Dev. [95% Conf. Interval] Two-sample t test with equal variances
39
neighborhood quality of IDA program participants by race. The hypothesis is rejected.
There is a significant difference in the new neighborhood scores for non-white
participants (M = 16.7, SD = 0.20) and white participants (M = 18.4, SD = 0.46); t (593) =
-4.1, p = 0.000. Specifically, the results suggest that the likelihood of non-white IDA
participants to buy homes in lower quality neighborhoods than their white counterparts
is significant.
Table 13: Neighborhood Score of IDA Participants by Race
IDA
PARTICIPANTS BY RACE
Count of IDA
PARTICIPANTS PERCENTAGE
Average of OLD NEIGHBORHOOD SCORE
Average of NEW NEIGHBORHOOD SCORE
Average of NEIGHBORHOOD CHANGE SCORE
NON-WHITE 447 75% 13.5 16.8 3.3
DECLINED/NO
CHANGE 144 24% 16.9 14.1 -2.8
IMPROVED 303 51% 11.8 18.1 6.3
WHITE 148 25% 17.8 18.5 0.6
DECLINED/NO
CHANGE 74 12% 21.0 16.9 -4.0
IMPROVED 74 12% 14.7 20.0 5.3
40
Neighborhood Change Score and Race of IDA Participants
Table 14: Result - Neighborhood Change Score by Race
Further examination of the relationship between race and neighborhood quality of IDA
participants required an independent t-test to analyze the degree of neighborhood
improvement experienced by each racial group. Table 14 shows the result of an
independent sample t-test for neighborhood change score of IDA participants by race.
Hypothesis 3b states that there is no significant difference in neighborhood change score
of IDA participants by race. We reject the hypothesis. There is a significant difference in
the neighborhood change scores for non-white participants (M = 3.3, SD = 0.25) and white
participants (M = 0.6, SD = 0.48); t (593) = 5.1, p=0.000. The results suggest that the
likelihood of neighborhood improvement for non-white participants of IDA
home-ownership program is significantly higher than their white counterparts.
Pr(T < t) = 1.0000 Pr(|T| > |t|) = 0.0000 Pr(T > t) = 0.0000 Ha: diff < 0 Ha: diff != 0 Ha: diff > 0 Ho: diff = 0 degrees of freedom = 593 diff = mean(NON-WHIT) - mean(WHITE) t = 5.1183 diff 2.700435 .5276081 1.664228 3.736643 combined 595 2.663866 .2328628 5.680134 2.206531 3.1212 WHITE 148 .6351351 .4837066 5.884545 -.320782 1.591052 NON-WHIT 447 3.33557 .2579352 5.453362 2.828651 3.84249 Group Obs Mean Std. Err. Std. Dev. [95% Conf. Interval] Two-sample t test with equal variances
41
Figure 8: Neighborhood Change Score of IDA Participants by Race
Neighborhood and Marital Status of IDA Participants
New Neighborhood Score and Marital Status of IDA Participants
Table 15: Result - New Neighborhood Score of IDA Participants by Marital Status
The result of a paired sample t-test for new neighborhood score of IDA participants by
marital status is shown in Table 15. Hypothesis 4a states that there is no significant
0.0 1.0 2.0 3.0 4.0
NON-WHITE WHITE
Average Neighborhood Change Score
of Participants
Total
Pr(T < t) = 0.0003 Pr(|T| > |t|) = 0.0006 Pr(T > t) = 0.9997 Ha: diff < 0 Ha: diff != 0 Ha: diff > 0 Ho: diff = 0 degrees of freedom = 593 diff = mean(NON-SING) - mean(SINGLE) t = -3.4338 diff -1.537221 .4476672 -2.416427 -.6580154 combined 595 17.21345 .1777759 4.336419 16.8643 17.56259 SINGLE 114 18.45614 .3725857 3.978127 17.71798 19.1943 NON-SING 481 16.91892 .1992258 4.369363 16.52746 17.31038 Group Obs Mean Std. Err. Std. Dev. [95% Conf. Interval] Two-sample t test with equal variances
42
difference in neighborhood quality of IDA program participants by marital status. The
hypothesis is rejected. There is a significant difference in the new neighborhood scores
for married participants (M = 16.9, SD = 0.19) and non-married participants (M = 18.4, SD
= 0.37); t (593) = -3.4, p = 0.000. Specifically, the results show that married IDA participants
are more likely to buy homes in lower quality neighborhoods than their single
counterparts.
Table 16: Neighborhood Score of IDA Participants by Marital Status
IDA
PARTICIPANTS BY AGE MARITAL STATUS
Count of IDA
PARTICIPANTS PERCENTAGE
Average of OLD NEIGHBORHOOD INDEX
Average of NEW NEIGHBORHOO D SCORE
Average of NEIGHBORHOOD CHANGE SCORE
MARRIED 481 81% 13.8 16.9 3.1
DECLINED/NO
CHANGE 161 27% 17.4 14.3 -3.1
IMPROVED 320 54% 12.0 18.2 6.2
NON-MARRIED 114 19% 17.6 18.5 0.8
DECLINED/NO
CHANGE 57 10% 20.9 17.1 -3.7
IMPROVED 57 10% 14.4 19.8 5.4
43
Neighborhood Change Score and Marital Status of IDA Participants
Table 17: Result - Neighborhood Change Score by Marital Status
To further examine the relationship between marital status and neighborhood quality of
IDA participants, an independent t-test was conducted to analyze the degree of
neighborhood improvement experienced by each group. Table 17 shows the result of an
independent sample t-test for neighborhood change score of IDA participants by marital
status. Hypothesis 4b states that there is no significant difference in neighborhood change
score of IDA participants by marital status. We reject the hypothesis. There is a significant
difference in the neighborhood change scores for married participants (M = 3.09, SD =
0.25) and non-married participants (M = 0.84, SD = 0.53); t (593) = 3.8, p=0.000. The results
suggest that the likelihood of married participants of IDA home-ownership program in
Pr(T < t) = 0.9999 Pr(|T| > |t|) = 0.0001 Pr(T > t) = 0.0001 Ha: diff < 0 Ha: diff != 0 Ha: diff > 0 Ho: diff = 0 degrees of freedom = 593 diff = mean(NON-SING) - mean(SINGLE) t = 3.8528 diff 2.253529 .5849104 1.104781 3.402277 combined 595 2.663866 .2328628 5.680134 2.206531 3.1212 SINGLE 114 .8421053 .5344198 5.706042 -.2166768 1.900887 NON-SING 481 3.095634 .2550393 5.593449 2.594503 3.596766 Group Obs Mean Std. Err. Std. Dev. [95% Conf. Interval] Two-sample t test with equal variances
44
Forsyth County NC to experience higher degree of improvement in neighborhood quality
than their single counterparts is significant.
Figure 9: Neighborhood Change Score of IDA Participants by Marital Status
Neighborhood and Household Size of IDA Participants
New Neighborhood Score and Household Size of IDA Participants
Table 18: Result - New Neighborhood Score of IDA Participants by Household Size
0.0 0.5 1.0 1.5 2.0 2.5 3.0 3.5 SINGLE MARRIED
Average Neighborhood Change Score
of Participants
Total
Pr(T < t) = 0.4387 Pr(|T| > |t|) = 0.8774 Pr(T > t) = 0.5613 Ha: diff < 0 Ha: diff != 0 Ha: diff > 0 Ho: diff = 0 degrees of freedom = 593 diff = mean(3 OR LES) - mean(MORE THA) t = -0.1544 diff -.0695652 .4505857 -.9545031 .8153726 combined 595 17.21345 .1777759 4.336419 16.8643 17.56259 MORE THA 115 17.26957 .4037055 4.329259 16.46983 18.0693 3 OR LES 480 17.2 .1982087 4.342536 16.81053 17.58947 Group Obs Mean Std. Err. Std. Dev. [95% Conf. Interval] Two-sample t test with equal variances
45
Table 18 shows the result of a paired sample t-test for new neighborhood score of IDA
participants by household size. Hypothesis 5a states that there is no significant difference
in neighborhood quality of IDA program participants by household size. We fail to reject
the hypothesis. There no significant difference in the new neighborhood scores for
participants from households of less than 3 persons (M = 17.2, SD = 0.19) and participants
from households of more than 3 persons (M = 17.3, SD = 0.40); t (593) = -0.15, p = 0.877.
The results suggest that household size does not result in significant difference in the
quality of neighborhoods in which IDA participants buy their homes.
Table 19: Neighborhood Score of IDA Participants by Household Size
IDA
PARTICIPANTS BY HOUSEHOLD SIZE
Count of IDA
PARTICIPANTS PERCENTAGE
Average of OLD NEIGHBORHOOD SCORE
Average of NEW NEIGHBORHOOD SCORE
Average of NEIGHBORHOOD CHANGE SCORE
3 OR LESS 480 81% 14.6 17.2 2.6
DECLINED/NO
CHANGE 175 29% 18.4 15.1 -3.3
IMPROVED 305 51% 12.5 18.4 5.9
MORE THAN 3 115 19% 14.2 17.3 3.0
DECLINED/NO
CHANGE 43 7% 17.9 14.8 -3.1
IMPROVED 72 12% 12.1 18.8 6.7
46
Neighborhood Change Score and Household Size of IDA Participants
Table 20: Result - Neighborhood Change Score by Household Size
To further examine the relationship between household size and neighborhood change
score of IDA participants, an independent t-test was carried out to examine if different
age groups experienced varying degree of neighborhood change. Table 20 shows the
result of an independent sample t-test for neighborhood change score of IDA participants
by age. Hypothesis 5b states that there is no significant difference in neighborhood
change score of IDA participants by household size. We fail to reject the hypothesis. There
is no significant difference in the neighborhood change scores for participants from 3 or
fewer persons (M = 2.6, SD = 0.26) and participants from households of more than 3
persons (M = 3.0, SD = 0.56); t (593) = -0.76, p=0.446. The results show that IDA participants
in Forsyth County NC who come from smaller households are not likely to experience
Pr(T < t) = 0.2234 Pr(|T| > |t|) = 0.4469 Pr(T > t) = 0.7766 Ha: diff < 0 Ha: diff != 0 Ha: diff > 0 Ho: diff = 0 degrees of freedom = 593 diff = mean(3 OR LES) - mean(MORE THA) t = -0.7611 diff -.4490036 .5899313 -1.607612 .7096052 combined 595 2.663866 .2328628 5.680134 2.206531 3.1212 MORE THA 115 3.026087 .5622854 6.029839 1.912204 4.13997 3 OR LES 480 2.577083 .2554312 5.596216 2.075179 3.078987 Group Obs Mean Std. Err. Std. Dev. [95% Conf. Interval] Two-sample t test with equal variances
47
significantly greater improvement in neighborhood quality than their counterparts from
larger households.
Figure 10: Neighborhood Change Score of IDA Participants by Household Size
Neighborhood and Gender of IDA Participants
New Neighborhood Score and Gender of IDA Participants
Table 21: Result - New Neighborhood Score of IDA Participants by Household Gender
17.16 17.18 17.20 17.22 17.24 17.26 17.28
3 OR LESS MORE THAN 3
Average Neighborhood Change Score
of Participants
Total
Pr(T < t) = 0.8424 Pr(|T| > |t|) = 0.3152 Pr(T > t) = 0.1576 Ha: diff < 0 Ha: diff != 0 Ha: diff > 0 Ho: diff = 0 degrees of freedom = 593 diff = mean(FEMALE) - mean(MALE) t = 1.0053 diff .4653554 .4628967 -.4437609 1.374472 combined 595 17.21345 .1777759 4.336419 16.8643 17.56259 MALE 107 16.83178 .4210738 4.355621 15.99696 17.6666 FEMALE 488 17.29713 .1961086 4.332181 16.91181 17.68245 Group Obs Mean Std. Err. Std. Dev. [95% Conf. Interval] Two-sample t test with equal variances
48
Table 21 shows the result of a paired sample t-test for new neighborhood score of IDA
participants by gender. Hypothesis 6a states that there is no significant difference in
neighborhood quality of IDA program participants by participant’s gender. We fail to
reject the hypothesis. There no significant difference in the new neighborhood scores for
female participants (M = 17.2, SD = 0.19) and male participants (M = 16.8, SD = 0.42); t
(593) = 1.00, p = 0.315. The results suggest that participant’s gender does not result in
significant difference in the quality of neighborhoods in which IDA participants buy their
homes.
Table 22: Neighborhood Score of IDA Participants by Gender
IDA
PARTICIPANTS BY GENDER
Count of IDA
PARTICIPANTS PERCENTAGE
Average of OLD NEIGHBORHOOD SCORE
Average of NEW NEIGHBORHOOD SCORE
Average of NEIGHBORHOOD CHANGE SCORE
FEMALE 488 82% 14.4 17.3 2.9
DECLINED/NO
CHANGE 170 29% 18.0 14.9 -3.1
IMPROVED 318 53% 12.5 18.6 6.1
MALE 107 18% 15.3 16.8 1.6
DECLINED/NO
CHANGE 48 8% 19.3 15.6 -3.6
IMPROVED 59 10% 12.0 17.8 5.8
49
Neighborhood Change Score and Gender of IDA Participants
Table 23: Result - Neighborhood Change Score by Gender
Table 23 shows the result of an independent sample t-test for neighborhood
change score of IDA participants by gender. Hypothesis 6b states that there is no
significant difference in neighborhood change score of IDA participants by gender. The
hypothesis is rejected. There is a significant difference in the neighborhood change scores
for female participants (M = 2.90, SD = 0.25) and male participants (M = 1.57, SD = 0.58); t
(593) = 2.18, p=0.029. The results suggest that the likelihood of female participants of IDA
home-ownership program in Forsyth County NC to experience higher degree of
improvement in neighborhood quality than their male counterparts is significant.
Pr(T < t) = 0.9855 Pr(|T| > |t|) = 0.0291 Pr(T > t) = 0.0145 Ha: diff < 0 Ha: diff != 0 Ha: diff > 0 Ho: diff = 0 degrees of freedom = 593 diff = mean(FEMALE) - mean(MALE) t = 2.1876 diff 1.3222 .6044159 .135144 2.509256 combined 595 2.663866 .2328628 5.680134 2.206531 3.1212 MALE 107 1.579439 .5886479 6.089021 .4123876 2.746491 FEMALE 488 2.901639 .2519096 5.564865 2.406676 3.396603 Group Obs Mean Std. Err. Std. Dev. [95% Conf. Interval] Two-sample t test with equal variances
50
Figure 11: Neighborhood Change Score of IDA Participants by Gender
In summary, this study finds that IDA participants in Forsyth County, North
Carolina experience significant improvement in neighborhood quality when they
transition from rental housing to home-ownership with an average of 6.1 points increase
in neighborhood quality. The results show race and marital status to have the most
significant impact on the outcome of participants. White and non-married participants
move to neighborhoods with significantly higher scores than non-white and married
participants. Household size, age and gender of participants were not linked to
significant difference in neighborhood change experienced by IDA participants.
16.4 16.6 16.8 17.0 17.2 17.4
FEMALE MALE
Average Neighborhood Change Score
of Participants
51
DISCUSSION
Evaluating the outcome of IDA participants in Forsyth County North Carolina
between 1990 and 2016, it is evident that the majority of program participants (63%)
experience significant improvement in neighborhood quality (an average of 6.1 points
increment) upon purchase of their first home. This change is critical as improved
neighborhood quality and associated opportunities are highly correlated with upward
socio-economic mobility for both children and adults which is one of the underlying goals
of Individual Development Account programs.
The positive outcome of IDA participants in Forsyth County was found to affect
different demographic groups in varying degree. White and single participants continue
to benefit from better neighborhood quality than their non-white and married
counterparts, however, the non-white and married participants made significantly
greater improvement in terms of the neighborhood change score when we compared the
neighborhoods in which they lived with the location of the homes they purchased.
This varying degree of improvement could stem from the fact that white
participants already lived in higher opportunity neighborhoods, to begin with. The
average initial neighborhood score for white participants was 17.8 while their non-white
counterparts had and an initial neighborhood score of 13.5. Similarly, single participants
52
and initial neighborhood score of 13.8. Although non-white participants were associated
with a relatively lower new neighborhood score (16.8) than their white counterparts
(18.5), they made an average improvement of 3.3 points compared to an average
improvement of 0.8 points for white participants. In the same way, married participants
were associated with relatively lower new neighborhood score (16.9) than their
non-married counterparts (18.5) but they achieved a higher score in terms of neighborhood
change (3.1) than non-married participants (0.8).
There was no significant difference in terms of new neighborhood quality score
based on household size, age, and gender. However, female participants were found to
have significant improvement in terms of neighborhood change score than their male
counterparts. Despite having no significant difference in new neighborhood score, female
participants recorded an average neighborhood change score of 2.9 points while their