TIME SPENT READING OUTSIDE SCHOOL AND COMPREHENSION: A LONGITUDINAL ANALYSIS
By
William A. Robertson
Honors Thesis Department of Public Policy
University of North Carolina at Chapel Hill
March 25, 2015
Approved:
____________________________________ Dr. Steven W. Hemelt, Chair
Abstract
The purpose of this thesis is to determine whether or not reading outside of school is
associated with changes in reading comprehension performance. My study addresses this
question by examining student participants of the National Educational Longitudinal Study of
1988 (NELS:88) in their eighth and tenth grade years. Using nationally representative data from
both student questionnaires and cognitive tests to construct the independent and dependent
variables of interest, I estimate a series of multivariate regressions to examine the relationship
between time spent reading outside of school and reading comprehension. Using probability
weights, the study can be generalized to the entire United States. The analyses provide empirical
evidence time spent reading outside of school is associated with a 0.27 point increase in reading
test scores for every additional hour tenth graders spent reading, holding all other factors
constant. Moreover, non-linear regressions reveal that the greatest increases in reading
comprehension occur in the first few hours a student reads outside of school on a weekly basis,
holding all else constant. All else held equal, the first hour a student spends reading each week
outside of school in tenth grade is associated with a 1.13 point increase in reading test scores.
These findings support policies that encourage reading outside of school in the later grades for
Acknowledgements
I would like to thank Dr. Hemelt, the chair of my Honors Thesis. Dr. Hemelt’s
unparalleled knowledge of statistical analysis and education policy has consistently challenged
me to produce quality research. He has also empowered me to be a lifelong consumer of
scholarly work as my research design professor. I would also like to thank Dr. Gitterman, my
second reader. There is a good chance I would never have written this thesis or even declared
the public policy major without Dr. Gitterman’s enthusiasm for teaching public policy 101. I
would like to acknowledge my co-advisee, Ms. Tasia Harris, as well. Not every person who
writes a thesis has the chance to get peer feedback. Tasia’s comments were very helpful in
supplementing advice from Dr. Hemelt. Finally, I would like to thank all the other public policy
faculty I have had the opportunity to take classes with: Dr. Christine Durrance, Dr. Douglas
Mackay, Dr. John Scott, and Dr. Jeremy Moulton. The lessons learned from their classes have
Table of Contents
Abstract ... 2
Acknowledgements ... 3
Table of Contents ... 4
List of Tables ... 6
Chapter 1. Reading Comprehension Significance ... 7
Reading Comprehension Interventions ... 8
Policy Significance of Prospective Results ... 9
Framework ... 11
Chapter 2. Reading Comprehension Literature Review ... 13
Summer Learning ... 13
Time Spent Outside of School ... 14
Time Spent Reading and Reading Growth ... 15
Project READS ... 16
Other Relevant Studies ... 18
What We Can Learn: Time Spent Reading ... 19
Chapter 3. Methods ... 21
National Educational Longitudinal Study Design... 21
Sample Selection ... 21
Data Collection Instruments... 22
Model 1. Eighth Grade Reading Behavior and Performance ... 23
Model 2. Tenth Grade Reading Behavior and Performance ... 24
Differences from Previously Employed Methods ... 27
Internal Validity ... 28
Chapter 4. Results ... 31
Descriptive Statistics ... 31
Model 1 Results: Base Year Regression of Time Spent Reading and Test Scores ... 34
Model 2 Results: First Follow Up Regression of Time Spent Reading and Test Scores ... 38
Relationship to Previous Studies ... 43
Chapter 5. Conclusions ... 44
Study Limitations ... 45
Omitted Variable Bias ... 45
Self-Report Bias ... 45
Generalizability ... 46
Encouraging Reading at the Institutional Level ... 47
Opportunities for Future Scholarship ... 48
References ... 50
Appendix A. Distribution of How Much Time Eighth Graders Sampled Spent Reading ... 52
List of Tables
Table 1. Descriptive Statistics... 33
Table 2. Eighth Grade Test Score Associations (Linear) ... 36
Table 3. Eighth Grade Test Score Associations (Non-Linear) ... 37
Table 4. Tenth Grade Test Score Associations (Linear) ... 41
Chapter 1. Reading Comprehension Significance
One of the most important tasks of today’s educators is to ensure that students learn how
to read. In today’s society, reading affects almost everything that citizens do. It affects how well
civil society can grow through processes like news consumption. It also makes people more
competitive in the United States job market. The AARP summarizes well the importance of
reading comprehension:
The ability to read with understanding, also known as reading comprehension, is critical to successful employment. If you cannot fully understand the instructions on how to apply for a job, you are at a disadvantage. Many jobs require reading as part of the duties. There are reports, memos, emails and safety requirements that are part of day to day functions of the job. Poor reading skills will cause you to lag behind other workers because it takes you more time to understand and interpret what you are reading (AARP Worksearch, 2014).
Whether it is basic functions such as being able to understand emails or something more
complex like analyzing legal documents and contracts, reading is important in practical ways.
Clearly the benefits of good reading comprehension extend to both the personal and professional
spheres. Recognizing the value of reading, the United States has encouraged states to ensure
students are able to achieve increasing proficiency in reading comprehension by establishing
conditional funding through laws like the No Child Left Behind Act, and encouraging innovative
new methods of learning by funding experimental programs like Race to the Top.
At the same time, illiteracy continues to be a problem for many Americans.
Approximately 32 million adults or 14 percent of the population in the U.S. cannot read. About
21 percent of adults in the U.S. read below a 5th grade level, and 19 percent of high school
graduates cannot read (Crum, 2013). These literacy rates have remained fairly consistent since
collective student math and literacy, and remains a top concern for policy makers across the
country. Illiteracy is connected with many undesirable policy outcomes. For example, the
Department of Justice determined that 85 percent of all juveniles who interface with the juvenile
court system are functionally illiterate, and over 70 percent of inmates in America's prisons
cannot read above a fourth grade level (Crum, 2013). Given the potential to decrease negative
social consequences such as crime, as well as the potential to make citizens more productive and
engaged in society, policy makers across America should want to ensure successive cohorts of
students are able to read at a higher level than their preceding cohorts.
Reading Comprehension Interventions
Research groups, for profit companies, and policy makers have all sought to address the
problem of low reading achievement and stagnant growth in such achievement through a
combination of state standards such as the Common Core, and curricula such as the Open Court
Reading Program or Success for All. These initiatives address learning in the classroom with
great detail, and have been analyzed through different studies. At the same time, issues with
student achievement in reading comprehension have persisted in spite of these efforts to improve
student growth. Open Court Reading is a good example of the issue. Although the Open Court
Reading Program has been lauded for its statistical and practical ability to improve reading
achievement in classrooms, it has not been able to widely impact reading achievement as
reflected in the aforementioned literacy rates (Borman, Dowling & Schneck, 2008: 402). Policy
makers must speculate on why this might be for many different programs, whether it is political
disagreement over curricula across schools, improper implementation in classrooms, or perhaps
an issue with the validity of studies. With so much effort being expended on school
policies. One of the major problems with reading comprehension research today is that is does
not lend itself towards considering such alternatives. There is a limited amount of knowledge
relating learning outcomes to activities outside of school. This is particularly problematic with
regard to unstructured activities distinct from school requirements like homework or summer
reading. As a result, one potential area for reading comprehension growth that remains mostly
unexplored is reading outside of school.
Time spent outside of school is a private space, and thus it has remained a mystery in
terms of the exact role that it plays in learning. Some studies have attempted to survey what
types of activities children undertake, and have found weak relationships between time spent
reading outside of school and reading comprehension growth, though each has produced
statistically significant (Anderson, Wilson & Fielding, 1988: 285) or near statistically significant
relationships (Taylor, Frye, & Maruyama, 1990: 360). Research has also generally been targeted
towards younger grades such as fifth grade (Anderson, Wilson & Fielding, 1988: 287), making it
unclear what the effect of time spent reading outside of school can have on students in eighth
through tenth grades, as students get closer to realizing important goals in life, such as entering
the labor force. This study will attempt to examine the relationship between time reading outside
of school by students as they reach eighth and tenth grade and reading achievement.
Policy Significance of Prospective Results
This study will provide policy makers with the preliminary answers to their questions
about reading at home among students in eighth and tenth grade, and whether encouraging such
reading is worth the effort of educators. Currently, much attention in public policy is given to
engaging students in school through new educational interventions, while little effort has been
from such interventions has prompted ongoing discussions about educational effectiveness, with
one recurring concern being that the home environment for many students does not prepare them
for success. By determining the strength of the relationship between time spent reading outside
of school and reading comprehension growth, policy makers can then make an informed decision
about whether current educational initiatives are sufficient in scope by only targeting school
activity.
The results of this study will have direct bearing on the alternatives policy makers will
face in the current educational environment. Should the results of the study determine a strong
relationship exists between reading outside school and reading comprehension, policy makers
will need to account for that in the curricula that they design. Reading interventions in the home,
such as summer reading programs or tutoring would be worth considering in greater detail.
More importantly, new initiatives to encourage reading outside of school would be supported by
the results of this study, which will focus on reading not done for school but for the student.
Although more information would be needed before such initiatives could be developed, this
study would be the first to offer insight into the benefit of a sustained effort to encourage
students to read on their own.
A negligible effect in the study would have important implication as well, since policy
makers would have validation in their assertions that the school needs to be the center of focus
for educational development in reading comprehension. This result from the study would be a
useful follow up to previous studies. Data on time spent reading outside of school and reading
comprehension scores has been recorded over the past couple of decades, yet has remained
untapped as a source of new studies. Prominent studies of the past also have been limited in
restricted themselves to selected schools and classrooms in specific communities such as east
central Illinois (Anderson, Wilson & Fielding, 1988: 287), rather than studying students
nationwide. Studies in time spent reading also generally only examine students for shorter time
spans, such as a few months (Anderson, Wilson & Fielding, 1988: 285). In this study I will
diverge from this practice which has dominated existing research by using longitudinal survey
data and a more robust, representative group of American students to examine and more
concretely establish the significance of the relationship between time spent reading outside
school and reading achievement.
Framework
In this study I will focus on the following research question: what is the relationship
between time spent reading outside of school not counting school work and reading
comprehension, holding all other factors constant? Chapter 2 will begin with an overview of
existing literature on reading comprehension. By looking at what the focus of reading
comprehension research has been, and what the results and methodologies of the most relevant
studies are, the role of this thesis in contributing new knowledge to research will be established.
Following the literature review, methods used in this study will be considered in Chapter 3. The
methods section will analyze and explain key features of the National Educational Longitudinal
Survey, which will be used to provide data for the analysis. It will also detail the style of
analysis that will be employed to answer the research questions, including how the time spent
reading outside of school and reading comprehension variables in the dataset will be
operationalized, what types of controls will be employed, and ultimately how the data will be
regressed to establish whether a relationship between variables does exist. Chapter 4 will display
through regression and determine what level of significance exists between the variables, as well
as the extent to which controls add context to this relationship. Following this, the results will
be related back to previous research discussed in the literature review, and discuss the internal
validity of the results will be considered. Chapter 5 will conclude by discussing the way in
which the findings relate back to the predication that time spent reading by students outside of
school positively affects reading comprehension. The generalizability of the study will be
considered, as well as policy implications of the results regarding encouragement of reading
outside of school. Finally, recommendations for further research on reading comprehension will
Chapter 2. Reading Comprehension Literature Review
The literature on reading comprehension and reading achievement is extremely expansive
and diverse, given the interest many different policy stakeholders have in reading outcomes for
students. Since the mid-twentieth century, a subset of such literature focuses on the role that
time spent reading plays in reading growth. This literature review will focus on the key pieces of
research that have and will continue to shape the academic discussion of reading comprehension
for years to come. Next, I outline how this study contributes new knowledge to an already rich
body of literature.
Summer Learning
One of the landmark studies of the 20th century was the Heyns (1978) study of summer
learning in Atlanta. In this study, she measured the growth in academic achievement of 3,000
sixth and seventh grade students by assessing them in the fall, spring, and the successive fall.
Gains from spring to fall are indicative of summer learning. This study was constructed as a
natural experiment, with some students receiving schooling in the summer and others not, sorted
based on family background and financial means. In part two of the author’s work, she also
collected information from study participants on their activities outside the classroom to analyze
their effects on learning in concert with the testing undertaken (Heyns, 1978).
Several major findings can be attributed to this work. First, most non-school activities do
not have an effect on reading achievement. Second, the one activity that students undertake over
the summer that indicates independent positive effects on reading achievement is time spent
reading. Heyns determined this by using number of books read and number of hours spent
reading on a typical day as measures of reading, then using regression of spring and fall tests to
that book reading explained a larger portion of the variance in reading skills than socioeconomic
status (Heyns, 1978).
Heyns’ study is one of the lardmark studies in reading comprehension. Research over the
past 35 years has continually been shaped based on her work. At the same time, there are issues
with the study that have warranted further study by researchers. One problem with her work is
that her research principally focused on the effect of not being in school on reading
comprehension more broadly, rather than whether time spent reading over the summer can
promote educational growth. Another problem is that researchers have had to use new data and
methods to expand generalizability of results to different age cohorts, regions of the United
States, assessment periods, and so on to build on the correlational evidence provided in her
study.
Time Spent Outside of School
The next major study undertaken to determine the effect of reading outside of school on
reading growth was Anderson, Wilson & Fielding (1988). The group sought to determine how
much reading school children actually do, and what relationship time spent reading has with
reading achievement. The study participants were “155 fifth-grade students, 52 from two
classrooms in a village school and 103 from five classrooms in a school in a middle-class area of
a small city” (Anderson, Wilson & Fielding, 1988: 287). Study participants were asked to
complete forms surveying how much time they spent on various activities outside of school. A
question on the survey could have been “I spent ____ minutes listening to music” or “I spent
____ minutes reading a book. The book was called ____. The book was written by ____.”
(Anderson, Wilson & Fielding, 1988: 287). Students completed these forms in periods ranging
To measure reading comprehension, three different types of comprehension tests were
administered to students before and after the surveys. Students were tested using the
Metropolitan Achievement Test, a vocabulary test, and a reading speed test. Percentile scores
were then calculated and compared with pretest data on each student from their schools. The
main finding of the study was that reading books was the best predictor of gains in reading
achievement, relative to other activities studied such as listening to music, playing sports, etc. At
the same time, most children did little to no book reading, implying parents and teachers should
emphasize this more for better reading comprehension scores.
There were several limitations to the Anderson et al study. First, the sample
underrepresented minorities and blue collar families. Performance by children on the reading
comprehension test was also above the national average. These factors, combined with the fact
that the study took place in Eastern Illinois, threaten the generalizability of the study. The
second issue was compliance. Certain schools were better about collected data than others.
Finally, some of the children in the city school discovered the investigators were particularly
interested in reading. This could have resulted in response bias that exaggerated the effect of
reading.
Time Spent Reading and Reading Growth
The next major study to follow Anderson, Wilson & Fielding (1988) was Taylor,
Maruyama & Frye (1990). Unlike the Anderson study, this work focused one hundred and
ninety-five 5th and 6th grade students. It was also targeted towards examining reading both in and
outside the classroom. The students were in two intermediate schools in a suburban school
consisted of above average readers, 6 consisted of average readers, and 2 consisted of below
average readers (Taylor, Frye, & Maruyama, 1990: 353).
Students kept daily reading logs from mid-January through mid-May. They filled them
out at the end of each 50 minute reading period in class, assigning times to readings assigned by
the teacher and readings they self-selected. They also record times based on whether that
reading was done in the classroom or outside of school. Students filled out the logs on average
about 75% of the time. To assess reading comprehension, the researchers administered the
comprehension section of the Gates-MacGinitie Reading Tests, Level D, Form 1 to all students
at the end of the study to investigate the impact of time spent reading on students' reading growth
(Taylor, Frye, & Maruyama, 1990: 356).
Although the study provided evidence that reading in the classroom helped with
comprehension growth, the study was unable to provide statistically significant evidence that
reading at home improved reading comprehension. The effect did approach significance
however. Additionally, students were found to read 15 minutes per day at home on average (SD
= 13.6). This is a very small amount of reading time.
The researchers identify the primary weakness in their study, discussing the possible
unreliability of the self-report measure, particularly of time spent reading at home. The students
in the study were also mostly average or above average readers. Teachers and others interested
in policy would find this problematic, because frequently it is students with lower levels of
comprehension that need attention (Taylor, Frye, & Maruyama, 1990: 360).
Project READS
A new working paper on time spent reading outside the classroom was released by the
spent reading has been undertaken by Jonathan Guryan, James S. Kim, and David M. Quinn,
seeking to answer the question: does reading during the summer build reading skills? The major
difference between this study and previous reading comprehension studies is that it actually
created a randomized experiment. The researchers “implemented a voluntary scaffolded summer
reading program called Project READS (Reading Enhances Achievement During Summer) for
2nd and 3rd graders in 463 classrooms in 59 public schools in 7 North Carolina school districts in
the spring and summer of 2013” (Guryan, Kim, & Quinn, 2014: 4). Like previous research, the
project was focused on primary grades. The treatment group of students in these classrooms
were given reading comprehension lessons in the spring, their parents were invited to an
afterschool event to learn about the program, the students were mailed 10 books each week over
the summer, and each student was encouraged to read the book and mail back a tri-fold with
reading comprehension questions on it (Guryan, Kim, & Quinn, 2014: 4). Students assigned to
the control group received no books during the summer, and participated in six mathematics
lessons during the spring while the treatment students participated in the reading lessons
(Guryan, Kim, & Quinn, 2014: 4). Each group was tested in the spring for reading
comprehension and then tested again in the fall post treatment.
There were several main findings in the recent experimental study. First, intent to treat
analyses showed no significant difference in the gain in reading comprehension scores for
treatment and control students in second grade. In third grade, the gain for treatment students
over control students was significant for girls but not for boys. Second, the difference in results
by gender was not attributable to a difference in the number of books read, raising the possibility
that “on average when 3rd grade girls read during the summer, they do so in a productive way
suggest that the amount of time spent critically reading a work is just as important to building
reading skills in the early grades as the number of books a child reads
The advantages of this study is that it went beyond simple correlational research.
Previous studies indicated that a strong correlate of reading skills is the time a child spends
reading outside of school. Using an experiment, the researchers were able to study time spent
reading as a causal mechanism through Project READS. The experimenters used a
well-constructed research design and were able to say a lot about the relationship between time spent
reading and reading comprehension scores. They also thoughtfully addressed the problem that
critical reading versus non-critical reading plays in confounding the results of such a study. In
terms of research design, this experiment could be considered a gold standard in pushing forward
reading comprehension research and possible interventions for reading outside of school, and
should challenge future researchers to carefully construct their own works.
Other Relevant Studies
Over the nearly thirty five years between the Heyns study and Project READS, several
other studies have contributed to the literature on reading comprehension that are worth
mentioning. The first of these studies was the Wilkinson et al study conducted in 1988. This
study focused on silent reading in classrooms, but was unable to find evidence to support a
positive effect between silent reading and reading comprehension. The Taylor et al study built
on this work.
Project READS cited two other studies for their correlational evidence supporting time
spent reading outside of school as a positive achievement factor. The first was a sociological
study by Hofferth and Sandberg. Like the Anderson et al study, the researchers examined time
that time spent reading outside of school was associated with reading comprehension such that it
strongly predicted achievement on the Woodcock-Johnson Achievement Test (Hofferth &
Sandberg, 2001).
The other study cited in the development of project reads was the Fryer and Levitt study
(2006). In this study, researchers found that a one standard deviation increase in the number of
children’s books in the home was associated with a 0.115 standard deviation increase in reading
scores, controlling for socioeconomic status and other background characteristics.
What We Can Learn: Time Spent Reading
There are several ways in which I intend to have this study contribute to the excellent
body of work on time spent reading. First, I want to change the source of data and the
demographics of the students under observation. For this study, I will use the National
Educational Longitudinal Survey (NELS), which collected data on students starting in 1988 from
eighth grade to post-secondary outcomes. In most reading comprehension literature, datasets
such as the Early Childhood Longitudinal Survey of Kindergarten and the National Assessment
of Educational Progress have been employed, mostly focusing on studying reading
comprehension in primary grades. This trend focusing on younger grades has continued even in
to the most current research, such as Project READS. The NELS has valuable data that can be
analyzed for secondary students. This dataset has questions that can be employed to construct a
regression that will analyze the relationship between time spent reading and reading
comprehension growth that has not previously been utilized in other research.
Additionally, the NELS is a nationally representative survey of American students. This
means that the findings of this study will be generalizable to the United States, and that it will be
experiments like Project READS have higher internal validity than this study due to
experimental design, even it cannot be generalized to the United States, since all the schools in
the study were in North Carolina. The tradeoff of less internal validity through secondary
analysis for more external validity, while not ideal, does create room for a more meaningful
contribution in this work.
The most important way in which I will contribute to reading comprehension research is
the longitudinal analysis of my data. Previous studies have not tracked reading growth over
more than a year. Using regression analysis, I will examine growth in student reading
comprehension over two years, which is a longer period of time than all previous studies.
Longitudinal analysis will also allow me to control for other factors that previous studies could
not, such as ability. While my study will not be an experimental design like Project READS, it
should provide strong evidence that supports a causal link between time spent reading and
Chapter 3. Methods
In this study I conduct a secondary data analysis using data from the National
Educational Longitudinal Study (NELS:88) to address the research question: what is the
relationship between time spent reading outside of school and reading achievement, holding all
other factors constant? In order to address my research question using NELS, I will perform a
two different regressions that operationalize specific explanatory variables that directly address
how much time a student spends reading outside of school per week. I will then establish a clear
measure of reading comprehension using standardized test scores listed in the dataset. I will also
create a robust set of control variables to test the statistical significance of the relationship
between my independent and dependent variables. The controls will minimize statistical noise,
net out confounding factors, and ensure that the coefficient representing change in time spent
reading at home is as close to its true value as possible.
National Educational Longitudinal Study Design
The NELS:88 dataset looks at survey responses and test scores from a representative
sample of students across the United States of America first assessed in the spring of the
1997-1988 school year. For the study participants, this would have been while they were in eighth
grade and about to transition in to high school. The dataset also has follow up questions and
responses, as well as test scores, in the 1989-1990 school term during tenth grade. The dataset
has a second follow up in twelfth grade and postgraduate outcomes, but this study only uses the
eighth and tenth grade waves.
Sample Selection
In order to achieve a nationally representative sample of students using the individual
probability design. In the first stage, 1,734 schools were selected to participate in the study, with
1,052 schools agreeing to participate. Within those schools, 26,435 students were randomly
selected to participate in the study, with 24,599 eighth grade students participating (Ingels et al,
1990, p. 9). The first follow up determined that of the students originally selected, 25,988 were
eligible to participate in the tenth grade wave. The follow up reached 3,967 high schools, with
75% of base year participants attending 23% of the selected schools (Ingels et al, 1992, p. 38).
Data Collection Instruments
The NELS:88 data collection instruments consist of several different parts. First is the
student survey. In both the base year and the first follow up, students were given surveys
collecting information about their family background, school life, school work, activities, etc.
Responses to these questions to not have an explicit bound on time, but in can be assumed based
on the way in which the questions were administered that the responses address the previous
school year. For eighth grade, students were given 45 minutes to complete their survey in the
classroom (Ingels et al, 1990, p. 13). In tenth grade, students were given an hour to complete the
survey and either did it at an in school or off campus survey session (Ingels et al, 1992, p. 27).
After completing the student questionnaires, each student was then given a battery of
cognitive tests in four subject areas. In both the base year and the first follow up, the entire
testing session included 116 items to be completed in 85 minutes (Ingels et al, 1990, p. 13). For
the base year, the reading comprehension test had 21 items to be completed in 21 minutes. The
test consisted of five short passages followed by comprehension and interpretation questions
(Ingels et al, 1990, p. 13). In the follow up year, the test also had 21 items to be answered in 21
minutes. Similarly, the test “consisted of five short passages followed by comprehension and
27). One major difference between the follow up year and the base year however was that two
versions of the reading test were developed, and they vary in the degree of difficulty (Ingels et al,
1992, p. 27), necessitating the use of a standardized score for comparison.
Model 1. Eighth Grade Reading Behavior and Performance
The explanatory variable in my first regression will be based off the study’s variable
BYS80: how much reading do you do on your own? This variable is categorical, with each
response being a range of time a student spends reading per week in hours. In order to provide
for an analysis over time later in the study, this variable will have to be made continuous by
identifying the central value in each category and assigning all students in that category to that
particular value. This would mean a student who answered they spend 4-5 hours a week reading
would be assigned the continuous value of 4.5 hours a week spent reading. Anyone missing in
the wave will be removed from the analysis. The coefficient of this equation for my variable of
interest will represent how much reading achievement changes with each one-hour change in
reading time outside of school, holding all other factors constant. In an alternative analysis of
the eighth grade results, the hours spent per week reading will be broken up into individual
indicator variables, with no reading done each week as the reference category.
The response variable of the first regression will measure the effect of the explanatory
variable based on standardized test scores recorded in the students’ eighth-grade year (the base
year of the study). Together, the basic regressions will follow the pattern below:
𝑌(𝑡𝑒𝑠𝑡𝑠𝑐𝑜𝑟𝑒8)𝑖𝑠𝑡 = 𝛽0+ 𝛽1(𝑟𝑒𝑎𝑑8) + 𝜖
𝑌(𝑡𝑒𝑠𝑡𝑠𝑐𝑜𝑟𝑒8)𝑖𝑠𝑡
= 𝛽0+ 𝛽1(𝑟𝑒𝑎𝑑1ℎ𝑟_8) + 𝛽2(𝑟𝑒𝑎𝑑2ℎ𝑟_8) + 𝛽3(𝑟𝑒𝑎𝑑3ℎ𝑟_8)
Model 2. Tenth Grade Reading Behavior and Performance
Following this regression, a second regression will be undertaken to assess the effect time
spent reading has on test scores from the base year to the first follow up in the NELS dataset. In
order to create this second regression, parallel variables for the first follow up will need to be
created. This will be done using F1S43: reading done per week on own outside of school. This
variable will be made continuous like BYS80 to create a time spent reading variable for tenth
grade, and any respondent that did not complete both the base year and follow up responses to
each of these variables will be excluded from the analysis. The coefficient will be the change in
reading comprehension that results from each hour read per week outside of school by the
student at the tenth grade level, holding all other factors constant. Like the first set of equations,
the analysis will also be done using indicator variables, following the format in the first analysis.
The tenth grade standardized test score variable, F12XRSTD, will be used as the outcome
variable for the second regression. One major way in which this regression will diverge from the
first however is that the eighth grade test score will be used as a control. The coefficient for this
control represents the association a one percent increase in an eighth grade student’s test score
has with that same student’s tenth grade test score, holding all other factors constant. This
control will allow for a more critical, causally driven discussion of growth in reading ability over
time as a result of time spent reading by the student outside of school by comparing students
with similar eighth grade test scores. The regressions for growth based on time spent reading
will follow the formats below.
𝑌(𝑡𝑒𝑠𝑡𝑠𝑐𝑜𝑟𝑒10)𝑖𝑠𝑡 = 𝛽0+ 𝛽1(𝑡𝑒𝑠𝑡𝑠𝑐𝑜𝑟𝑒8) + 𝛽2(𝑟𝑒𝑎𝑑10) + 𝜖
𝑌(𝑡𝑒𝑠𝑡𝑠𝑐𝑜𝑟𝑒10)𝑖𝑠𝑡 = 𝛽0+ 𝛽1(𝑡𝑒𝑠𝑡𝑠𝑐𝑜𝑟𝑒8) + 𝛽3(𝑟𝑒𝑎𝑑1ℎ𝑟_10 ) + 𝛽4(𝑟𝑒𝑎𝑑2ℎ𝑟_10 )
Control Variables
In order to ensure that the effect of time spent reading by a student outside of school does
not become confounded by other factors that could affect reading comprehension and
performance, several other control variables will be created. The only major controls that will be
continuous in each equation are time spent on English homework during the base year in hours
per week (BYS79C), time spent doing English homework during the follow up year in hours per
week (F1S36D2), and annual family income measured in thousands of dollars (BYFAMINC).
The homework controls will both account for one way in which students spend their time outside
of school, and for a possible source of growth in reading comprehension. The annual family
income variable will be added because this socioeconomic factor controls for differences in
opportunity between students, based on economic resources.
One key control variable that ought to be added in addition to time spent on English
homework each week in hours is parental involvement. Parents can motivate students to perform
in a variety of situations, including reading more often, since they can influence how children
spend their time. One of the best ways to measure parental involvement is how often parents
check their student’s homework. In this study, parents will be coded as involved in their
student’s activities if the student indicates they “sometimes” or “often” check the student’s
homework. They will be coded as not involved for responses of “rarely” or “never”. This will
be done for the eighth grade analyses using BYS38A, and tenth grade analyses using F1S100A.
Outside controls that will measure household characteristics such as the controls
previously mentioned (parental involvement, student motivation, income, etc.), school effects
will also be considered. For all equations, two measures will capture the effect of the student’s
measured in students and made continuous based off G8ENROL. The second school effect will
be the percentage of students at a school that qualify for free lunch. This variable will be made
based off G8LUNCH, and will be made continuous as well. Together these school effects will
control for differences in school resources and opportunities available to different students.
The rest of the control variables will capture geographic, socioeconomic and
demographic characteristics of students. Where a student lives, demographic factors, and
socioeconomic status are all critical controls because they predetermine educational
opportunities and other factors, particularly once students reach secondary education. The
following control variables will be organized as indicator variables. The first indicator variables
will control for urbanicity. Using the variable G8URBAN for eighth graders and G10URBAN
for tenth graders, indicator variables will be created showing the difference in test scores for
suburban and rural students as compared to the urban student.
The next control variable that will be created will be for race, using the RACE variable of
the NELS. The reference category for this variable will be white students. Indicator variables
for race will be used to compare Black students, Hispanic students, and an “other” category,
which includes both Asian/pacific islanders and native Americans.
Finally, gender will be considered using F1N2, with males being the reference category
and females being assigned an indicator variable. Since a person’s race and gender remain
constant, the same variables used in the base year can be used in the first follow up. Taken
together, the following regressions with controls will be used for analysis:
𝑌(𝑡𝑒𝑠𝑡𝑠𝑐𝑜𝑟𝑒8)𝑖𝑠𝑡
= 𝛽0+ 𝛽1(𝑟𝑒𝑎𝑑8) + 𝛽2(ℎ𝑜𝑚𝑒𝑤𝑜𝑟𝑘8) + 𝛽3(𝑝𝑎𝑟𝑒𝑛𝑡𝑖𝑛𝑣8) + 𝛽4(𝑠𝑢𝑏𝑢𝑟𝑏𝑎𝑛)
+ 𝛽5(𝑟𝑢𝑟𝑎𝑙) + 𝛽6(𝑏𝑙𝑎𝑐𝑘) + 𝛽7(ℎ𝑖𝑠𝑝𝑎𝑛𝑖𝑐) + 𝛽8(𝑜𝑡ℎ𝑒𝑟) + 𝛽9(𝑓𝑒𝑚𝑎𝑙𝑒)
𝑌(𝑡𝑒𝑠𝑡𝑠𝑐𝑜𝑟𝑒8)𝑖𝑠𝑡
= 𝛽0+ 𝛽1(𝑟𝑒𝑎𝑑1ℎ𝑟_8 ) + 𝛽2(𝑟𝑒𝑎𝑑2ℎ𝑟_8 ) + 𝛽3(𝑟𝑒𝑎𝑑3ℎ𝑟_8 )
+ 𝛽4(𝑟𝑒𝑎𝑑4_5ℎ𝑟_8 ) + 𝛽5(𝑟𝑒𝑎𝑑6ℎ𝑟_8 ) + 𝛽6(ℎ𝑜𝑚𝑒𝑤𝑜𝑟𝑘8) + 𝛽7(𝑝𝑎𝑟𝑒𝑛𝑡𝑖𝑛𝑣8)
+ 𝛽8(𝑠𝑢𝑏𝑢𝑟𝑏𝑎𝑛) + 𝛽9(𝑟𝑢𝑟𝑎𝑙) + 𝛽10(𝑏𝑙𝑎𝑐𝑘) + 𝛽11(ℎ𝑖𝑠𝑝𝑎𝑛𝑖𝑐) + 𝛽12(𝑜𝑡ℎ𝑒𝑟)
+ 𝛽13(𝑓𝑒𝑚𝑎𝑙𝑒) + 𝛽14(𝑓𝑎𝑚𝑖𝑛𝑐) + 𝛽15(𝑒𝑛𝑟𝑜𝑙𝑙𝑚𝑒𝑛𝑡8) + 𝛽16(𝑓𝑟𝑒𝑒𝑙𝑢𝑛𝑐ℎ8) + 𝜖
𝑌(𝑡𝑒𝑠𝑡𝑠𝑐𝑜𝑟𝑒10)𝑖𝑠𝑡 = 𝛽0+ 𝛽1(𝑡𝑒𝑠𝑡𝑠𝑐𝑜𝑟𝑒8) + 𝛽2(𝑟𝑒𝑎𝑑10) + 𝛽3(ℎ𝑜𝑚𝑒𝑤𝑜𝑟𝑘10) + 𝛽4(𝑝𝑎𝑟𝑒𝑛𝑡𝑖𝑛𝑣10) + 𝛽5(𝑠𝑢𝑏𝑢𝑟𝑏𝑎𝑛) + 𝛽6(𝑟𝑢𝑟𝑎𝑙) + 𝛽7(𝑏𝑙𝑎𝑐𝑘)
+ 𝛽8(ℎ𝑖𝑠𝑝𝑎𝑛𝑖𝑐) + 𝛽9(𝑜𝑡ℎ𝑒𝑟) + 𝛽10(𝑓𝑒𝑚𝑎𝑙𝑒) + 𝛽11(𝑓𝑎𝑚𝑖𝑛𝑐)
+ 𝛽12(𝑒𝑛𝑟𝑜𝑙𝑙𝑚𝑒𝑛𝑡8) + 𝛽13(𝑓𝑟𝑒𝑒𝑙𝑢𝑛𝑐ℎ8) + 𝜖
𝑌(𝑡𝑒𝑠𝑡𝑠𝑐𝑜𝑟𝑒10)𝑖𝑠𝑡 = 𝛽0+ 𝛽1(𝑡𝑒𝑠𝑡𝑠𝑐𝑜𝑟𝑒8) + 𝛽2(𝑟𝑒𝑎𝑑1ℎ𝑟_10 ) + 𝛽3(𝑟𝑒𝑎𝑑2ℎ𝑟_10 )
+ 𝛽4(𝑟𝑒𝑎𝑑3ℎ𝑟_10 ) + 𝛽5(𝑟𝑒𝑎𝑑4_5ℎ𝑟_10 ) + 𝛽6(𝑟𝑒𝑎𝑑6_5ℎ𝑟_10 ) + 𝛽7(𝑟𝑒𝑎𝑑8_5ℎ𝑟_10 ) + 𝛽8(𝑟𝑒𝑎𝑑10ℎ𝑟_10 ) + 𝛽9(ℎ𝑜𝑚𝑒𝑤𝑜𝑟𝑘10) + 𝛽10(𝑝𝑎𝑟𝑒𝑛𝑡𝑖𝑛𝑣10) + 𝛽11(𝑠𝑢𝑏𝑢𝑟𝑏𝑎𝑛) + 𝛽12(𝑟𝑢𝑟𝑎𝑙) + 𝛽13(𝑏𝑙𝑎𝑐𝑘) + 𝛽14(ℎ𝑖𝑠𝑝𝑎𝑛𝑖𝑐) + 𝛽15(𝑜𝑡ℎ𝑒𝑟) + 𝛽16(𝑓𝑒𝑚𝑎𝑙𝑒) + 𝛽17(𝑓𝑎𝑚𝑖𝑛𝑐)
+ 𝛽18(𝑒𝑛𝑟𝑜𝑙𝑙𝑚𝑒𝑛𝑡8) + 𝛽19(𝑓𝑟𝑒𝑒𝑙𝑢𝑛𝑐ℎ8) + 𝜖
Differences from Previously Employed Methods
The use of the NELS dataset will be a departure from previous studies of reading growth.
It will be employed to examine a much more diverse, representative population of American
students both in both cross sectional and longitudinal regression analysis. Unlike studies of the
past, ability and time spent on homework will be more carefully controlled in the second
regression equation, to ensure classroom learning and academic ability do not confound the
study. Also, the demographics of students will be robustly accounted for in the equation in order
to more carefully deduce the true effect of time spent reading.
The other major advantage of this study is that it will utilize a much larger sample size
than previous studies, which focused on select classrooms in specific schools and communities
rather than the broader educational community. The NELS dataset is a nationally representative
sample of students, and as such will account for the diversity of student experiences and help
reading comprehension. Ideally, a larger sample size will address other issues as well, such as
minimizing the impact of biased results of individual respondents in the study.
In order to ensure that such a dataset is nationally representative, the regressions will also
be presented using weights from NELS. For the first model using only base year variables,
BYQWT will be used as a proportion weight in the first model to account for the inverse of the
probability of selection into the NELS sample and non-response adjustment (Ingles, 1992, p. 33).
BYQWT projects the population of approximately 3,008,080 eighth graders in public, private,
and Catholic schools in 1988 (Ingles, 1992, p. 33). Since the second model incorporates eighth
grade test scores with tenth grade variables, the follow up year panel weight F1PNLWT will be
added to account for longitudinal, proportional weighting. F1PNLWT was developed only for
those students that provided complete data in both the first year follow up and base year waves,
and also accounted for inverse probability of selection and non-response adjustment over both
waves. The panel weight projects a population 3,007,812 tenth graders in public, private, and
Catholic schools (Ingels et al, 1992, p. 47).
This study’s methodology takes the opportunity to focus on students in the later grades as
well, given that younger grades often are the focus of reading comprehension studies. The most
widely cited studies of reading comprehension such and the Anderson et al. (1988) and Taylor et
al. (1990) studies focus on evaluating students in elementary or early middle school. Using
NELS will target a different age group from past studies, which should provide new results not
accounted for in existing research.
Internal Validity
There are several important concerns with respect to internal validity in this study that
participants, many of them will be excluded from the regression equation due to not answering
some of the questions that feed in to regression variables. If a student participates in eighth
grade but not tenth grade, then their results will not be considered in the study. Demographic
factors must also be properly accounted for as well. Although attrition will reduce the number of
respondents whose data can be used, the number of participants should not be reduced to the
point that the study is no longer representative of the student population in America. Using
weights for regressions, the equations will be adjusted to account for differences between the
sample and population characteristics.
The second major concern with the validity of the study in question is self-reporting bias.
It is possible that the students could deliberately overestimate the amount of time that they
actually spend reading on a week to week basis. They could also not have a good idea of how
long they actually read. In the end though, this limitation is something that has to be accepted as
part of the study because there is no other way to collect infallible data in a student’s home
without violating personal privacy through observation. Even in studies that collect data through
primary observation, there is still a chance for bias and limited ability to verify the truthfulness
of the claims, as seen in previous studies where some students deduced interest in time spent
reading on the part of the investigators (Anderson, Wilson & Fielding, 1988).
The final concern in this study that must be addressed is the possibility of ambiguous
temporal precedence. In the first regression, there is no way to know if the amount a student
reads outside school affects reading comprehension, or vice versa. Given that the first regression
will produce interesting results, but cannot stand alone in determining causality due to this
constraint, the second regression, which controls for academic ability by using a student’s eighth
administered to eighth graders in the spring of 1988, and the first follow ups were administered
in the spring of 1990, at the end of tenth grade. Therefore, both the eighth grade reading test
score and time spent reading in tenth grade measure variables that occurred before the
administration of the tenth grade reading test. This resolves the possible problem with reverse
causation in a cross sectional evaluation by also considering the research question in a
Chapter 4. Results
Chapter four is organized into four sections. The first section will discuss descriptive
statistics about the samples of interest. Attention will also be given to the distribution of time
spent reading outside of school by students in eighth and tenth grade, as well as the distribution
of eighth and tenth grade reading comprehension scores. The second and third sections of results
will present and interpret the results of the two regression models outlined in the methods
section. The second section will focus on eighth graders’ time spent reading outside of school in
relation to their reading comprehension score. The third section will focus on tenth graders’ time
spent reading and how it affects tenth grade reading comprehension scores, controlling for past
performance in eighth grade. Finally, the fourth section will discuss how the results relate to
previous studies.
Descriptive Statistics
Of the 26,435 students initially selected to participate in the National Educational
Longitudinal Study, only about a third of the students had fully usable data that could fit the
regression models (N=8,678). Table 1 presents the mean and standard deviation of all variables
utilized in the two regressions, with time spent reading presented as both continuous and
indicator variables.
The average amount of time that eighth graders in 1988 spent per week reading outside of
school was found to be 1.92 hours. In tenth grade, the average amount of time that students
spent reading outside of school per week rose slightly to 2.30 hours. In appendices A and B, the
distributions (by percent) of how many hours students spend reading each week outside of school
in eighth and tenth grade are presented graphically to illustrate the observation highlighted by the
positively skewed, with a small group of students reading a large amount of time each week and
a large majority of students reading two hours or less each week.
The average eighth grade test score was 51.61, with a standard deviation of 9.41. The
lowest score was 31.92 and the highest score was 70.15. The average tenth grade test score,
similar to the eighth grade test score, has a mean value of 51.52 and a standard deviation of 9.49.
The low score was 30.60 and the highest score was 68.80. As explained in the methods section,
this standardization is particularly important in the first follow up year because two reading
Table 1. Descriptive Statistics
Variable Mean Standard
Deviation
Time Spent Reading Outside of School (hrs per week)
Eighth Grade 1.92 1.75
Eighth Grade- 1 Hour 0.33 0.47
Eighth Grade- 2 Hours 0.21 0.41
Eighth Grade- 3 Hours 0.11 0.31
Eighth Grade- 4.5 Hours 0.07 0.25
Eighth Grade- 6 Hours 0.09 0.28
Tenth Grade 2.30 2.36
Tenth Grade- 1 Hour 0.32 0.47
Tenth Grade- 2 Hours 0.21 0.41
Tenth Grade- 3 Hours 0.12 0.32
Tenth Grade- 4.5 Hours 0.09 0.29
Tenth Grade- 6.5 Hours 0.04 0.19
Tenth Grade- 8.5 Hours 0.02 0.13
Tenth Grade- 10 Hours 0.04 0.19
Outcomes:
Eighth Grade Reading Comprehension Score 51.61 9.41 Tenth Grade Reading Comprehension Score 51.52 9.49
Controls:
Annual Family Income (Thousands of Dollars) 41.06 34.87
Female 0.53 0.50
Black 0.09 0.28
Hispanic 0.11 0.31
Other (Asian Pacific Islander or American Indian) 0.08 0.27 Eighth Grade Hours Spent on English Homework per Week 1.09 1.27
Eighth Grade Parent Involvement 0.73 0.44
Eighth Grade Suburban Student 0.43 0.50
Eighth Grade Rural Student 0.33 0.47
Eighth Grade Enrollment (By School) 191 125
Eighth Grade Percent Free Lunch Students (By School) 21.57 21.59 Tenth Grade Hours Spent on English Homework per
Week 1.83 2.10
Tenth Grade Parent Involvement 0.56 0.50
Tenth Grade Suburban Student 0.41 0.49
Tenth Grade Rural Student 0.33 0.47
Model 1 Results: Base Year Regression of Time Spent Reading and Test Scores
The first linear regression model for the base year was run with no factors that would be
associated with student motivation (measured by hours spent on English homework), parental
involvement, or family resources (annual household income). Under this model, an increase of
one hour of reading outside school per week is associated with a 1.52 point increase in reading
score, holding all other factors constant. The second linear model withheld school effects, such
as eighth grade enrollment at a school and percentage of students who qualify for free lunch.
Without school effects but including family factors, an increase in one hour of reading outside
school per week is associated with a 1.47 point increase in reading score, holding all other
factors constant. This suggests that the controls of excluded in the first model do have an impact
on reading.
The last two linear regressions of base year variables are saturated regressions including
all factors. The first regression was unweighted, and the second regression included the base
year probability weight. The fully saturated regressions of eighth grade students yielded results
that strongly associated increases in time spent reading outside of school with increases in
reading comprehension test scores. In the weighted, composite linear model, an increase of one
hour per week of reading is associated with a 1.47 point increase in eighth grade reading
comprehension score, holding all other factors constant. The unweighted model produced
similar results; an increase of one hour per week of reading for eighth grade students was
associated with a 1.42 point increase in eighth grade reading comprehension score, all other
factors held constant. The unweighted regressions follow this pattern for all subsequent models,
Given the possibility that the relationship between time spent reading outside of school
and reading comprehension is not linear, a second set of regressions for the base year equation
was also undertaken, where students who spent no time reading outside of school each week
served as the reference category and each level of reading was assigned its own indicator.
Without assigning household effects, a student who read one hour each week in eighth grade
could be expected to have a score 2.55 points greater than their counterpart who did not read
outside of school, holding all other factors constant. Assigning household effects but not school
effects, that association dropped to 2.44 points. In the composite weighted equation, the
association was 2.41 points.
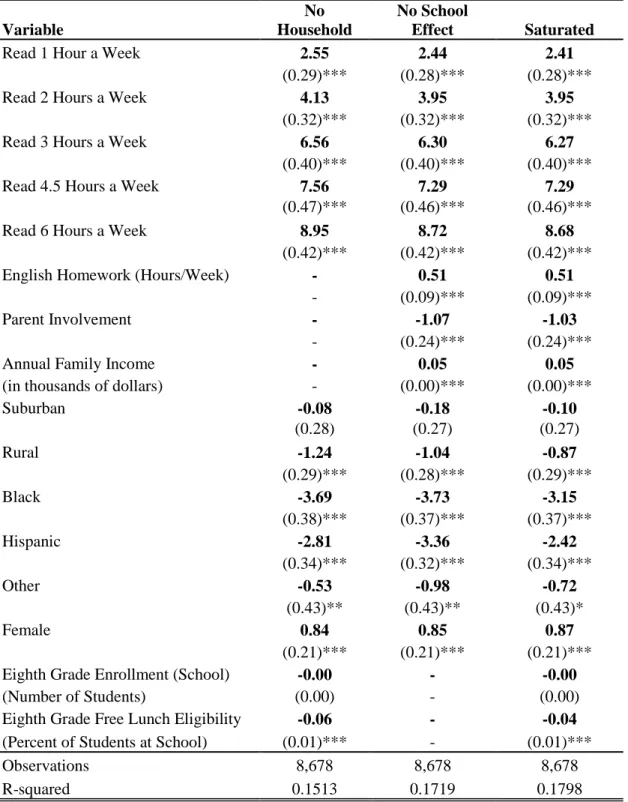
The indicator regression suggests that the two greatest increases in reading
comprehension are in the transition from zero to one hour of reading outside of school each
week, and two to three hours of reading each week. In the first instance, the gain is
approximately 2.41 points. The increase from two to three hours each week yields an additional
2.32 point increase relative to students that do not read at all, holding all other factors constant.
In both cases these associations are larger than the linear association.
More broadly, the more time a student spends reading in hours per week, the greater the
association with a higher reading comprehension score. At the highest level in the composite
regression, a student who read nearly six hours a week outside school would be associated with a
score 8.63 points higher than their counterpart who did not read outside of school, holding all
other factors constant. This is almost a whole standard deviation from the average test score in
Table 2. Eighth Grade Test Score Associations (Linear) Variable No Household No School
Effect Unweighted Weighted
Reading (Hours/Week) 1.52 1.47 1.42 1.47
(0.06)*** (0.06)*** (0.05)*** (0.06)***
English Homework (Hours/Week) - 0.54 0.58 0.53
- (0.09)*** (0.07)*** (0.09)***
Parent Involvement - -1.00 -0.92 -0.97
- (0.24)*** (0.21)*** (0.24)***
Annual Family Income - 0.05 0.05 0.05
(in thousands of dollars) - (0.00)*** (0.00)*** (0.00)***
Suburban -0.12 -0.14 -0.18 -0.14
(0.28) (0.27) (0.24) (0.27)
Rural -1.26 -1.07 -1.02 -0.88
(0.29)*** (0.28)*** (0.26)*** (0.29)***
Black -3.67 -3.70 -2.81 -3.13
(0.37)*** (0.37)*** (0.34)*** (0.37)***
Hispanic -2.82 -3.37 -2.16 -2.43
(0.34)*** (0.32)*** (0.32)*** (0.34)***
Other -0.52 -0.97 -0.01 -0.70
(0.43)* (0.43)** (0.35) (0.42)*
Female 0.94 0.95 0.77 0.97
(0.21)*** (0.21)*** (0.19)*** (0.21)*** Eighth Grade Enrollment (School) -0.00 - -0.00 -0.00
(Number of Students) (0.00) - (0.00)*** (0.00)
Eighth Grade Free Lunch Eligibility -0.06 - -0.05 -0.04 (Percent of Students at School) (0.01)*** - (0.00)*** (0.01)***
Observations 8,678 8,678 8,678 8,678
R-squared 0.1468 0.1681 0.1896 0.1760
Robust standard errors in parentheses:
* significant at 10%; ** significant at 5%; *** significant at 1%
Table 3. Eighth Grade Test Score Associations (Non-Linear) Variable No Household No School
Effect Saturated
Read 1 Hour a Week 2.55 2.44 2.41
(0.29)*** (0.28)*** (0.28)***
Read 2 Hours a Week 4.13 3.95 3.95
(0.32)*** (0.32)*** (0.32)***
Read 3 Hours a Week 6.56 6.30 6.27
(0.40)*** (0.40)*** (0.40)***
Read 4.5 Hours a Week 7.56 7.29 7.29
(0.47)*** (0.46)*** (0.46)***
Read 6 Hours a Week 8.95 8.72 8.68
(0.42)*** (0.42)*** (0.42)*** English Homework (Hours/Week) - 0.51 0.51
- (0.09)*** (0.09)***
Parent Involvement - -1.07 -1.03
- (0.24)*** (0.24)***
Annual Family Income - 0.05 0.05
(in thousands of dollars) - (0.00)*** (0.00)***
Suburban -0.08 -0.18 -0.10
(0.28) (0.27) (0.27)
Rural -1.24 -1.04 -0.87
(0.29)*** (0.28)*** (0.29)***
Black -3.69 -3.73 -3.15
(0.38)*** (0.37)*** (0.37)***
Hispanic -2.81 -3.36 -2.42
(0.34)*** (0.32)*** (0.34)***
Other -0.53 -0.98 -0.72
(0.43)** (0.43)** (0.43)*
Female 0.84 0.85 0.87
(0.21)*** (0.21)*** (0.21)*** Eighth Grade Enrollment (School) -0.00 - -0.00
(Number of Students) (0.00) - (0.00)
Eighth Grade Free Lunch Eligibility -0.06 - -0.04 (Percent of Students at School) (0.01)*** - (0.01)***
Observations 8,678 8,678 8,678
R-squared 0.1513 0.1719 0.1798
Note: All equations are weighted
Robust standard errors in parentheses:
* significant at 10%; ** significant at 5%; *** significant at 1%
Model 2 Results: First Follow Up Regression of Time Spent Reading and Test Scores
The second set of reading comprehension regressions allows for the ability to control
academic ability by using a student’s eighth grade test score as a predictor of tenth grade results.
In order to demonstrate the effect this has on the results, the first linear regression run was done
without academic ability. In this model, a one hour increase in time spent by a tenth grader
reading outside of school each week is associated with a 0.84 increase in reading comprehension
score, holding all other factors constant. In this first regression, the r2 value is approximately
0.14.
In the next linear model (Table 4), household effects were excluded but academic ability
was controlled for. This dramatically changed the results of the equation. In the second model,
each additional hour spent reading outside of school is associated with a 0.27 point increase in
reading comprehension score, holding all other factors constant. Additionally, the r2 value
increased to approximately 0.62. This dramatic increase in the r2 value and simultaneous
decrease in the test score association suggests that a large part of effects for hours spent reading
outside of school detected in the first model are actually driven by the omitted variable of general
student ability. Thus controlling for baseline academic performance is essential for exploring the
relationship between reading outside of school and later reading performance.
The last important observation to note is that the gain in reading comprehension gains
does not change in the saturated, weighted linear regression, remaining at 0.27 for each
additional hour spent reading outside of school. This suggests that academic ability, more than
any other control, needs to be accounted for. At the same time, the association of time spent
reading outside of school and reading comprehension remains statistically significant at the
In order to be consistent with the first model, additional regressions were run with each
level of reading assigned an indicator variable and students who spent no time each week reading
outside school in tenth grade serving as the reference category. Table 5 shows the results of
these regressions. As with the tenth grade linear model, the first regression did not include
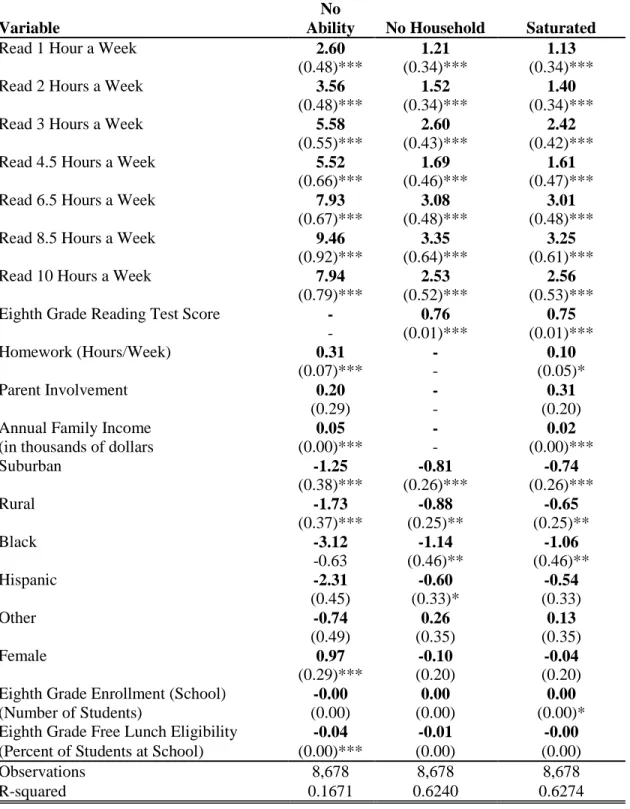
academic ability and had a relatively low r2 value of approximately 0.17. Like in the base year,
the effects are tremendous. A student who read one hour a week outside of school would be
associated with a test score 2.60 points higher than their counterpart who did not read at all,
holding all other factors constant. Students who read 8.5 hours would be associated with a
staggering 9.46 point increase in reading comprehension scores.
Once academic ability is controlled for, scores drop once again as in the linear model.
Ignoring household effects and holding all other factors constant, students who read 1 hour a
week would score 1.21 points higher than their counterparts who did not read at all in the
weighted regression. In the composite weighted regression, that association drops again to 1.13
points. Similar decreases in associations occur at all levels. Both regressions have an r2 value of
approximately 0.62.
There are several important trends to consider. First, the associations of reading outside
of school each remain statistically significant at the p≤0.01 level, suggesting there is a positive
effect between the variables. Additionally, there are several levels of reading comprehension
that yield significantly greater gains than the linear model suggests. The increase in reading
outside school from zero to one hour each week increases a student’s test score by 1.13 points,
holding all other factors constant. The increase from two to three hours yields a 1.02 increase
(2.42 point association at 3 hours) in reading comprehension score holding all other factors
regression, the increase from zero to one hour a week of reading outside of school should be 0.27
points, instead of 1.13 points, holding all else constant. The association between three hours
spent reading outside of school and reading scores (holding all else constant) should only be 0.81
Table 4. Tenth Grade Test Score Associations (Linear)
Variable
No
Ability No Household Saturated
Reading (Hours/Week) 0.84 0.27 0.27
(0.04)*** (0.04)*** (0.04)*** Eighth Grade Reading Test Score - 0.77 0.75
- (0.01)*** (0.01)***
Homework (Hours/Week) 0.33 - 0.11
(0.06)*** - (0.05)**
Parent Involvement 0.36 - 0.41
(0.22) - (0.21)*
Annual Family Income 0.05 - 2.81
(in thousands of dollars) (0.00)*** - (0.00)***
Suburban -0.92 -0.84 -0.76
(0.27)*** (0.27)*** (0.27)***
Rural -1.25 -0.90 -0.66
(0.29)*** (0.25)*** (0.25)**
Black -3.61 -1.13 -1.05
(0.39)*** (0.48)** (0.48)**
Hispanic -2.50 -0.61 -0.55
(0.38)*** (0.33)* (0.33)*
Other -0.67 0.26 0.12
(0.43) (0.35) (0.34)
Female 1.16 -0.06 -0.01
(0.21)*** (0.20) (0.20) Eighth Grade Enrollment (School) 0.00 0.00 0.00 (Number of Students) (0.00) (0.00) (0.00)* Eighth Grade Free Lunch Eligibility -0.04 -0.01 0.00 (Percent of Students at School) (0.01)*** (0.00)*** (0.00)
Observations 8,678 8,678 8,678
R-squared 0.1423 0.6208 0.6248
Note: All Equations are weighted
Robust standard errors in parentheses:
* significant at 10%; ** significant at 5%; *** significant at 1%
Table 5. Tenth Grade Test Score Associations (Non-Linear)
Variable
No
Ability No Household Saturated
Read 1 Hour a Week 2.60 1.21 1.13
(0.48)*** (0.34)*** (0.34)***
Read 2 Hours a Week 3.56 1.52 1.40
(0.48)*** (0.34)*** (0.34)***
Read 3 Hours a Week 5.58 2.60 2.42
(0.55)*** (0.43)*** (0.42)***
Read 4.5 Hours a Week 5.52 1.69 1.61
(0.66)*** (0.46)*** (0.47)***
Read 6.5 Hours a Week 7.93 3.08 3.01
(0.67)*** (0.48)*** (0.48)***
Read 8.5 Hours a Week 9.46 3.35 3.25
(0.92)*** (0.64)*** (0.61)***
Read 10 Hours a Week 7.94 2.53 2.56
(0.79)*** (0.52)*** (0.53)*** Eighth Grade Reading Test Score - 0.76 0.75
- (0.01)*** (0.01)***
Homework (Hours/Week) 0.31 - 0.10
(0.07)*** - (0.05)*
Parent Involvement 0.20 - 0.31
(0.29) - (0.20)
Annual Family Income 0.05 - 0.02
(in thousands of dollars (0.00)*** - (0.00)***
Suburban -1.25 -0.81 -0.74
(0.38)*** (0.26)*** (0.26)***
Rural -1.73 -0.88 -0.65
(0.37)*** (0.25)** (0.25)**
Black -3.12 -1.14 -1.06
-0.63 (0.46)** (0.46)**
Hispanic -2.31 -0.60 -0.54
(0.45) (0.33)* (0.33)
Other -0.74 0.26 0.13
(0.49) (0.35) (0.35)
Female 0.97 -0.10 -0.04
(0.29)*** (0.20) (0.20) Eighth Grade Enrollment (School) -0.00 0.00 0.00 (Number of Students) (0.00) (0.00) (0.00)* Eighth Grade Free Lunch Eligibility -0.04 -0.01 -0.00 (Percent of Students at School) (0.00)*** (0.00) (0.00)
Observations 8,678 8,678 8,678
R-squared 0.1671 0.6240 0.6274
Note: All Equations are weighted Robust standard errors in parentheses: