Self-efficacy for eating a healthy diet can moderate the impact of stress on diet quality
by
Phillip Dobson
Honors Thesis
Department of Nutrition
University of North Carolina at Chapel Hill
2019
Approved:
_______________________________ Advisor
ABSTRACT
Introduction. Family child care home (FCCH) providers are individuals who care for children in their own home. This group has been identified as at-risk for high stress and poor sleep quality,
contributing to poor health behaviors. High self-efficacy for the diet may moderate the
relationship between these risk factors and diet quality. Little research has examined how these
factors may relate to one another when describing the health of FCCH providers.
Methods. We utilized baseline data on FCCH providers from the cluster-randomized control trial Keys to a Healthy Family Child Care Home. We estimated correlations between
self-reported perceived stress, sleep quality, diet self-efficacy and diet quality. A linear regression
including interaction terms was run to assess how diet self-efficacy may moderate the
relationships between perceived stress and sleep quality, respectively, and diet quality.
Results. Perceived stress and sleep quality were not significantly correlated with diet quality in this population. However, diet self-efficacy was identified as a moderator of the association
between perceived stress and diet quality. With high diet self-efficacy, increasing perceived
stress was associated with improved diet quality.
Conclusion. Improving self-efficacy may be one critical strategy for improving the health of a population at-risk for poor behaviors. As FCCH providers care for many children and model
ACKNOWLEDGEMENTS
I’m very pleased to take the opportunity to thank Dianne Ward, Derek Hales, and Regan
Burney for their endless feedback and support on this project. I’m incredibly grateful to them and
the rest of the Children’s Healthy Weight Research Group for teaching me the ins and outs of
research over the past two years. I’d also like to thank Chris Wiesen of the Odum Institute for his
expertise and assistance during data analysis. I definitely wouldn’t have finished this project
without support from my parents and my friend Christopher Dalton. Finally, I feel honored to
present findings regarding the health of family child care home providers in North Carolina: a
very big thanks to them for their participation in this project and for the work they do to care for
TABLE OF CONTENTS
INTRODUCTION ... 1
METHODS ... 4
Recruitment ... 4
Measures ... 5
Data analyses... 8
RESULTS ... 10
DISCUSSION ... 14
INTRODUCTION
Obesity is a growing public health concern, and there is evidence to suggest that it
disproportionately affects women. In the United States, obesity increased consistently for women
from 2005 to 2014, culminating in a 40% prevalence for women, compared to only 35% in men.1 A group of women particularly susceptible to poor diet quality, potentially increasing
obesity risk, are early childhood educators (ECEs). Over 95% of those working as ECEs in the
United States are women, and their pay is low; in 2016, their average weekly income was $621
compared to the overall national average for women of $749.2 Income inequality within a population is associated with a greater prevalence of obesity among women, independent of
average calorie intake.3 Indeed, multiple studies of women who work in early education show a high prevalence of overweight and obesity.4-6 One study of a nutrition intervention trial in child care centers in North Carolina found that up to two-thirds of ECEs were classified as obese.6
High job-related or overall stress has been associated with poor diet quality, lack of
physical activity, and weight gain in women.7-9 ECEs often report above average depressive symptoms and diagnosed depression.5-6,11 Citing their many stressors, ECEs describe frequent sleep disturbances11 and get less than the recommended amount of sleep.6 In turn, low quality sleep contributes to weight gain and decreased appetite control.11-12
A child’s time spent in child care has been shown to correlate with an increased BMI by
opportunity to influence the trajectory of the health of children under their care. Given the
influence of child care, as well as the obvious implications of obesity on individual health, it is
important to address determinants of obesity in this at-risk population.
Bandura’s Social Cognitive Theory (SCT) posits that social-cognitive factors, such as
self-efficacy, are central to the adoption of beneficial health behaviors such as improved diet.16 Self-efficacy captures an individual’s perceived capability to accomplish a specific action.17 Indeed, improvements in self-efficacy have been shown to positively affect consumption of fat,
fiber, and fruits and vegetables.18 In another study, participants’ weight changed concomitantly with self-efficacy over 18 months; participants lost weight overall as their self-efficacy
increased, and subsequently regained weight as self-efficacy decreased.19
SCT argues further that, in individuals with high self-efficacy, stressors are more likely to
induce coping behaviors than anxiety.17 According to a survey administered to ECEs in Texas, as many as 71% are attempting to improve their diet and lose weight.4 Unfortunately, reported self-efficacy is low. They lack the knowledge and confidence to discern nutrition information, which
results in dietary behaviors that are not conducive to their weight-loss goals.4 Amongst ECEs, there is great need for improved diet as well as a readiness to change, but the problem of obesity
perpetuates. Improving their knowledge and self-efficacy could be key to improving the health of
this population in the face of high stress and poor sleep.
Intervention may be particularly important for family child-care home (FCCH) providers,
who care for children in their own home. Their average income is lower than their center-based
specifically and what contributes to their diet quality. This paper seeks to fill the gap in the
research for this important sub-population of ECEs.
The purpose of this study is to elucidate the impact of sleep, stress, and self-efficacy on
diet quality in FCCH providers using baseline data from the Keys to a Healthy Family Child
Care Home intervention implemented in FCCHs in North Carolina. It is hypothesized that high
stress and poor sleep will be correlated with poor diet quality in the FCCH providers.
Self-efficacy may be central to the ability of an FCCH provider to overcome these barriers. Thus, the
moderating effect of self-efficacy on the relationship between stress and sleep and diet quality,
respectively, will be assessed. It is hypothesized that self-efficacy will act as a moderator and
that high self-efficacy in an FCCH provider will contribute to high diet quality, even in instances
METHODS
This cross-sectional study used baseline data from the two-arm, cluster-randomized
control trial Keys to Healthy Family Child Care Homes (Keys). Keys examined the effect of a
three-part childhood obesity prevention intervention delivered to FCCH providers over 9 months.
It was designed to improve child diet quality and physical activity and was implemented by
researchers from the University of North Carolina at Chapel Hill and Duke University. All study
protocols were approved by both Institutional Review Boards. Specific details on study protocol
and recruitment are published elsewhere.21-22 Relevant study details are described below.
Recruitment
To recruit potential participants, licensed FCCHs were identified through a publicly
available database on the NC Division of Child Development website.23 Then, community partners who work with FCCHs were contacted to introduce Keys to FCCH providers. FCCHs
were then sent an informational flyer via mail and email with an invitation to participate in Keys.
Subsequently, project staff contacted FCCH providers by phone to discuss project details, gauge
interest, and determine eligibility. In order to be eligible for inclusion, FCCHs were required to
have at least two children between the ages of 1.5 and 4 years enrolled, serve at least one meal
and one snack, be open year-round, and have been in business for two years with no plans to
close in the following year. Eligible FCCH providers were delivered welcome packet materials,
including consents for enrolled children 1.5- to 4-years old. Consent from at least two children
home visits (Monday/Wednesday or Tuesday/Thursday) were scheduled. During these on-site
visits, FCCH providers filled out surveys for the baseline data relevant to this study.
Measures
1. Demographics
FCCH providers’ demographic information was collected using a survey. The providers
reported personal characteristics such as age, race, sex, and income.
2. Diet quality
Provider diet quality was assessed using the 2000 Brief Block Food Frequency
Questionnaire (FFQ). Multiple studies found high correlations between a reduced and full
version of the original FFQ, justifying the use of a shortened version.24 The Brief Block FFQ is a dietary recall using 72 commonly consumed foods from the National Health and Nutrition
Examination Survey III,25 designed to assess usual dietary intake. Providers recalled how often and what portions of these foods were consumed over the past 3 months. Surveys were sent to
NutritionQuest for data entry, and servings per day adjusted for typical daily kilocalorie intake
were calculated.
Using data from NutritionQuest, a modified 2010 Healthy Eating Index (HEI) score was
calculated using similar scoring to the daily 2010 HEI.26-27 The modified HEI consisted of 12 dietary components – including both adequacy components (whole fruit, total fruit, total
vegetables, greens and beans, whole grains, dairy, seafood and plant protein, total protein, and
fatty acids) and moderation components (refined grains, sodium, and empty calories).
Component scores were estimated by comparing the adjusted servings per day from the FFQ to
calculate cup equivalents, and minimum and maximum scores were set to compute each
component score. Finally, component scores were summed to produce a final modified total HEI
score from 0 to 100, where higher scores indicated better diet quality.
3. Sleep quality
Sleep quality was assessed using the nine-item Sleep Problems Index from the Medical
Outcomes Study sleep scale.28 Providers rated how often in the past week they experienced specific sleep problems on a 1 (none of the time) to 6 (all of the time) scale. Then, the responses
were recoded to a 0 to 100 value, with relevant items reverse coded. The Sleep Problems Index
was calculated as an average of the nine items, ranging in possible scores from 0 to 100, with
higher scores corresponding to more sleep issues.29 The Sleep Problems Index has repeatedly been shown to have good internal consistency and satisfactory construct validity in previous
studies of adults with neuropathic pain,30 diabetic peripheral neuropathy,31 fibromyalgia,32 and restless leg syndrome.33 Internal consistency was high among Keys participants as well
(Cronbach’s alpha = 0.82).
4. Perceived stress
Provider stress was assessed using the 10-item version of the Perceived Stress Scale
(PSS).34 The PSS has demonstrated acceptable internal consistency, as well as construct validity.34-35 The PSS consisted of statements about the frequency of stressful thoughts and feelings over the past month. Providers responded on a 1 to 5 scale, where 1 was “never” and 5
summed. Scores ranged from 10 to 50, such that higher scores represented higher perceived
stress. PSS internal consistency was good among Keys participants (Cronbach’s alpha = 0.84).
5. Diet self-efficacy
In order to evaluate provider self-efficacy, providers responded to a 24-item
questionnaire containing statements relating to their perceived confidence to overcome specific
challenges to healthy eating and make healthy food choices. Each item was scored on a 1 to 5
scale, where 1 was “not at all confident” and 5 was “extremely confident.” Five self-efficacy
subscales were created – nutrition action, nutrition coping, fat reduction, fruit and vegetable
consumption, and dietary fiber – by averaging responses to relevant survey items.
Items used to develop subscales for nutrition action and coping self-efficacy were first
used in the Berlin Risk Appraisal and Health Motivation Study (BRAHMS), which examined
social-cognitive determinants of preventive nutrition.36 Nutrition action refers to a participant’s perceived ability to develop a plan of action and adopt new dietary behaviors, while nutrition
coping is a measure of a participant’s perceived capability to anticipate and dissolve barriers that
arise during behavior change. BRAHMS found that the self-efficacy scales for nutrition action
and coping had good internal consistency. Cronbach’s alpha for the present study was 0.90 and
0.93 for nutrition action and coping, respectively. Subscales for self-efficacy in fat reduction,
fruit and vegetable consumption, and dietary fiber were calculated using items from a study on
psychosocial measures and dietary behaviors.37 This study found that these three subscales demonstrated both internal consistency and test-retest reliability. In the present study,
Cronbach’s alpha for the fat reduction, fruit and vegetable consumption, and dietary fiber
As correlations among all five subscales were high (r = 0.56-0.88), a diet self-efficacy
score was created to capture participant’s self-efficacy for various aspects of healthy eating in
one global measure. To create the diet self-efficacy score, the subscales described above were
summed. This new score ranged from 5 to 25. Higher scores indicated an individual felt more
confident in her overall nutrition knowledge and capabilities. Internal consistency for this global
diet self-efficacy score was excellent (Cronbach’s alpha = 0.91).
6. Body mass index (BMI)
Provider height and weight were measured during the day-long home visits. According to
standard protocol, at least two measurements were taken for both height and weight, averaged,
and used to calculate BMI in kg/m2.
Data analyses
Descriptive statistics were reported for both FCCH provider demographics and key study
measures. A Pearson correlation matrix was used to examine the associations between all three
predictors (sleep quality, perceived stress, and diet self-efficacy) and the outcome (total HEI).
The potential moderating effect of diet self-efficacy on diet quality was explored with an
additional linear regression to predict HEI score. This model was run in two blocks. Provider
BMI and income were selected as covariates a priori due to their potential effects on diet quality
and associations with sleep quality and perceived stress. The first block included terms for sleep
quality, perceived stress, and diet self-efficacy. The second block added interaction terms for
both perceived stress and sleep quality with diet self-efficacy. Variables were centered prior to
direction of the moderating effect was determined by creating a two-way interaction plot in
Microsoft Excel 2016.
Individuals with missing data for any relevant measure were excluded from the models.
The regression model was tested for linearity, multivariate normality, homoscedasticity, and
absence of multicollinearity. Significance was set at p<0.05. Analyses were completed using
RESULTS
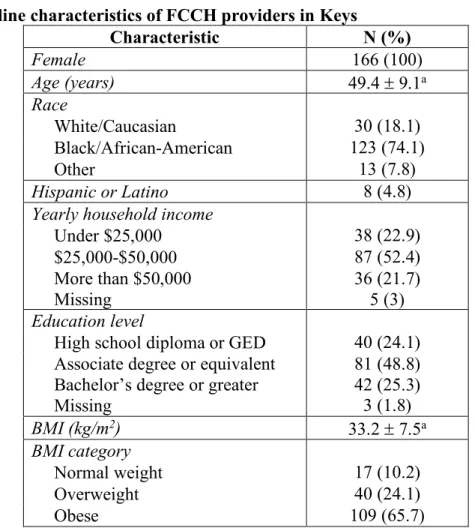
Baseline characteristics of the FCCH providers in Keys are reported in Table 1. The
sample consisted of entirely female providers with a mean age of 49.4 years. The providers were
majority Black/African-American (74.1%), non-Hispanic (95.2%), and obese (65.7%). Yearly
household income was more variable, with just over half the providers reporting an income
between $25,000 and $50,000. Finally, almost three-quarters of the Keys providers had received
an associate degree or greater.
Table 1. Baseline characteristics of FCCH providers in Keys
Characteristic N (%)
Female 166 (100)
Age (years) 49.4 ± 9.1a
Race
White/Caucasian 30 (18.1)
Black/African-American 123 (74.1)
Other 13 (7.8)
Hispanic or Latino 8 (4.8)
Yearly household income
Under $25,000 38 (22.9)
$25,000-$50,000 87 (52.4)
More than $50,000 Missing
36 (21.7) 5 (3)
Education level
High school diploma or GED 40 (24.1)
Associate degree or equivalent Bachelor’s degree or greater
81 (48.8) 42 (25.3)
Missing 3 (1.8)
BMI (kg/m2) 33.2 ± 7.5a
BMI category
Normal weight 17 (10.2)
Overweight 40 (24.1)
Obese 109 (65.7)
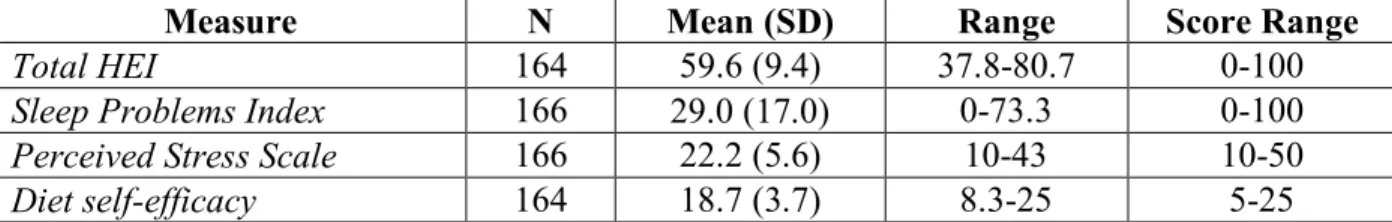
Table 2 presents the descriptive statistics for measures of diet quality, sleep quality,
perceived stress, and diet self-efficacy. Correlations were estimated between total HEI and
provider sleep quality, perceived stress, and diet self-efficacy. These correlations are presented in
Table 3. All correlations were in the expected direction; however, only diet self-efficacy was
significantly related to total HEI score (r = 0.33, p<0.01). A significant correlation was also
found between perceived stress and sleep quality, (r = 0.39, p<0.01) such that higher perceived
stress was associated with more sleep problems. Additionally, higher perceived stress was
associated with lower diet self-efficacy (r = 0.32, p<0.01).
Table 2. Descriptive statistics for diet quality, sleep quality, perceived stress, and diet self-efficacy
Measure N Mean (SD) Range Score Range
Total HEI 164 59.6 (9.4) 37.8-80.7 0-100
Sleep Problems Index 166 29.0 (17.0) 0-73.3 0-100
Perceived Stress Scale 166 22.2 (5.6) 10-43 10-50
Diet self-efficacy 164 18.7 (3.7) 8.3-25 5-25
Table 3. Correlation matrix
Sleep Problems Index Perceived Stress Scale Diet self-efficacy Perceived
Stress Scale 0.39* - -
Diet
self-efficacy -0.04 -0.32* -
Total HEI -0.09 -0.11 0.33*
*p<0.01
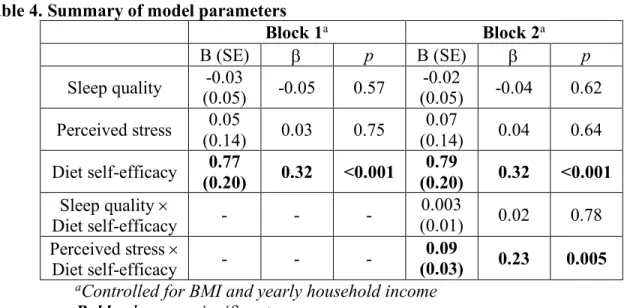
The potential moderating effect of self-efficacy was assessed with another linear
regression in two blocks, controlled for BMI and income. The first block was significant
(b=0.31, p<0.001). Next, interaction terms were added for sleep quality ´ diet self-efficacy and
perceived stress ´ diet self-efficacy. Inclusion of these terms increased the adjusted R2 value to 0.124. The overall model was significant [F(8,149)=3.78, p<0.001] and revealed a significant
interaction between perceived stress and diet self-efficacy (b=0.23, p=0.005), but no significant
interaction between sleep quality and diet self-efficacy (p=0.78). Table 4 summarizes the model
parameters.
Table 4. Summary of model parameters
Block 1a Block 2a
B (SE) b p B (SE) b p
Sleep quality (0.05) -0.03 -0.05 0.57 (0.05) -0.02 -0.04 0.62
Perceived stress (0.14) 0.05 0.03 0.75 (0.14) 0.07 0.04 0.64
Diet self-efficacy (0.20) 0.77 0.32 <0.001 (0.20) 0.79 0.32 <0.001 Sleep quality ´
Diet self-efficacy - - -
0.003
(0.01) 0.02 0.78 Perceived stress ´
Diet self-efficacy - - -
0.09
(0.03) 0.23 0.005 aControlled for BMI and yearly household income
Bold values are significant
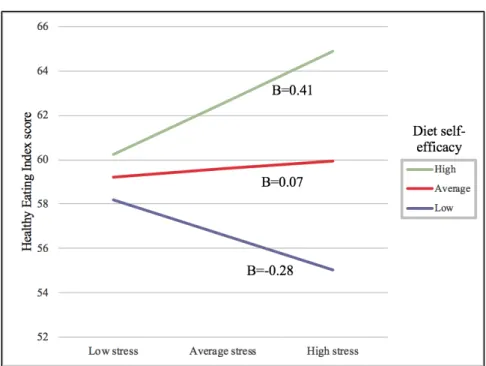
The significant interaction between perceived stress and diet self-efficacy is illustrated in
Figure 1, where high and low refer to 1SD above and below the mean, respectively. When diet
self-efficacy was low, perceived stress was associated with lower diet quality (B=-0.28).
Alternatively, when diet self-efficacy was high, perceived stress was associated with higher diet
DISCUSSION
The purpose of this study was to examine the relationship between sleep quality,
perceived stress, diet self-efficacy, and diet quality in FCCH providers. Diet self-efficacy was the
only factor with a statistically significant correlation with diet quality. However, the significant
interaction between perceived stress and diet self-efficacy could be important to understanding
what contributes to diet quality in this population.
Despite the body of literature describing the relationship between stress and diet,
perceived stress was not significantly correlated to diet quality scores in this population of FCCH
providers. While perceived stress and diet quality were not significantly correlated, we did find
that diet self-efficacy moderated the perceived stress-diet quality relationship. At low levels of
diet self-efficacy, perceived stress was associated with poor diet quality; at high levels of diet
self-efficacy, the opposite relationship was observed. This result provides support to Bandura’s
assertion that individuals with high self-efficacy are able to surmount stress to overcome
challenges,17 in this case potentially allowing individuals to maintain a healthy diet despite stress.
It has been shown that self-efficacy moderates the process of translating intention to
consume fruit and vegetables into action.38 It is possible that self-efficacy could similarly moderate an individual’s response to stressors that frequently arise during dietary behavior
one’s vulnerability to stress-induced eating. Our results hint at self-efficacy as a potential
underlying factor within the individual-difference model.
The individual-difference model of stress-induced eating best explains why diet
self-efficacy may prevent the decline in diet quality with increasing stress. However, the results from
this study also show that with high diet self-efficacy, high perceived stress is associated with
better diet quality. While research is needed to determine whether an increase in stress over time
could confer improvements in diet quality, a proposed mechanism was suggested (Figure 2).
Bandura suggests that those with high self-efficacy overcome stress by coping and
exercising control.17 For behaviors relating to the diet, coping may often take the form of self-regulatory behaviors (for example, calorie counting or daily weighing). Several studies
demonstrate that the effects of self-efficacy on dietary and weight outcomes are mediated
through self-regulatory behaviors such as goal setting and self-monitoring.18,40 A systematic review of mediators of dietary behavior change finds that self-regulation is a better mediator of
long-term changes than self-efficacy alone.41
Figure 2. Proposed effect of stress on diet quality with high diet self-efficacy
Conversely, it has also been demonstrated that the effects of self-regulatory behaviors
such as goal setting on dietary behaviors can be mediated by self-efficacy.42 Through SCT, Bandura describes self-efficacy assessments as an ongoing and reciprocal process.17 When an individual takes a self-regulatory action, the results of that choice are evaluated in future
assessments of efficacy. If successful, efficacy increases and contributes to more
self-regulatory behaviors. The cycle continues, and in the face of mounting stress, efficacious
individuals are able to not only cope, but ultimately initiate behaviors to improve their diet.
This is not to suggest that stress is a useful means to improve the diet of individuals with
high self-efficacy, but instead explains a potential mechanism for how individuals could
overcome stress. In fact, the correlation between diet self-efficacy and perceived stress in this
study suggests that increasing levels of perceived stress are associated with lower levels of diet
self-efficacy. In practice, most individuals, especially women, revert to coping behaviors that are
detrimental to health, such as overeating, when triggered by stress.43
Stress is an inevitability in the world of early childhood education. Providers describe
their stress to be related to dealings with parents, the health of the children under their care,
demands of caring for many children across developmental stages, and public perceptions of
their role.10 Improving their self-efficacy may help to prevent these multiple stressors from impacting their health negatively.
Although hypothesized, this study did not find that sleep quality was related to provider
diet quality. There are several potential explanations for this. First, slow wave sleep is the sleep
measure most often associated with sleep quality and resulting health outcomes.11 It is possible that the items contained within the Sleep Problems Index do not capture issues that result in
may be explained by the varied definitions and measurements by which it is assessed.44 Future work should focus on standardizing how sleep health is defined using components of
satisfaction, daytime alertness, timing, efficiency, and duration.45
It is important that ongoing research continue to utilize sleep as a measure of overall
health. Improvements in the consistency and sufficiency of sleep have been shown to improve
both psychological strain and self-regulating behavior.46 Due to the reciprocal relationship between sleep and stress, it would be inappropriate in many cases to separate them when
explaining their contributions to health.47 Indeed, more sleep problems contributed to high perceived stress among the FCCH providers.
The present study takes an additional step towards describing the determinants of the
health of FCCH providers, a group at risk for high stress, poor sleep, and obesity. The
implications of intervening in this group should not be underestimated. The amount of time that
children spend under the care of ECEs, including FCCHs, implicate them as potential models for
beneficial health behaviors. One survey of ECEs in Georgia found that almost 80% do not
believe their health has an impact on the quality of their care.48 This is not to say that ECEs with poor health behaviors do not provide high quality care in many domains. However, interventions
in this population should seek to inform ECEs of their potential impact and encourage them to
include child health promotion in their definition of quality care. These messages are likely to be
well-received: many providers report confidence in their ability to help children with improving
in healthy eating and physical activity.49 Their confidence in their own abilities, however, is lacking.4,49 Improving provider self-efficacy could benefit both provider and child.
The issues that contribute to the health of ECEs are complex and should be considered in
contribute individually and together towards their health. Future work should consider
“philosophical, psychological, physiological, organizational science and sociological sources” to
holistically contribute to provider health.50 Indeed, though this study addresses several
determinants of provider health, many of these factors are not considered. Although our model
accounts for only 12% of the variance in diet quality, highlighting the complexity of this
behavior, self-efficacy is a modifiable factor that should be included in interventions for
improving both provider and child diet quality.
It is important to remember that these results are cross-sectional and should be interpreted
with caution. Future work could determine more explicitly how diet self-efficacy may moderate
the effect of stress on diet quality over time. We acknowledge that, while important, it was
outside the scope of this study to fully explore the potentially competing reciprocal effect of diet
itself on both sleep quality and perceived stress. There is evidence that specific foods and
macronutrients contribute to the quality of one’s sleep.51 Research is less conclusive, but growing, on how one’s diet can affect perceived stress as well.52
This study did not collect an objective measure of sleep quality which may explain the
lack of association between sleep quality and diet quality among FCCHs. Perceived stress and
diet self-efficacy were assessed via self-report as well, but the scales were well validated and are
ideal methods for collecting information on social-cognitive factors. However, diet quality was
measured via self-report and creation of a modified HEI score that has not been validated.
This study utilized data from a convenience sample of FCCH providers recruited for a
larger intervention trial. Perceived stress levels and diet self-efficacy for this group may have
been different than the typical ECE population. However, this sample was fairly representative
Finally, though the FCCH population was expected to be at increased risk for poor diet quality,
this sample had an average HEI score of 59.6, nearly identical to that of the larger American
population.54 This score may not be representative of the FCCH population at large, but is much less than ideal, suggesting there is certainly still work to be done to improve their diet quality.
FCCH providers frequently experience work-related stressors that make it difficult to
manage their own diet quality and overall health. With their close relationships to families and
time spent caring for children, intervening to improve the health of this population may benefit
more than the providers alone. Although this study provided some insight into how self-efficacy
may moderate the association between FCCH provider stress and diet quality, more work is
needed to describe the nature of these relationships and to ultimately develop specific strategies
REFERENCES
1. Flegal KM, Kruszon-Moran D, Carroll MD, Fryar CD, Ogden CL. Trends in obesity among adults in the united states, 2005 to 2014. JAMA. 2016;315(21):2284-2291.
2. Bureau of Labor Statistics. Women in the Labor Force: A Databook; Bureau of Labor Statistics: Washington, DC, USA, 2017.
3. Pickett KE, Kelly S, Brunner E, Lobstein T, Wilkinson RG. Wider income gaps, wider waistbands? an ecological study of obesity and income inequality. J Epidemiol Community Health. 2005;59(8):670-674. doi: 59/8/670 [pii].
4. Sharma S, Dortch KS, Byrd-Williams C, et al. Nutrition-related knowledge, attitudes, and dietary behaviors among head start teachers in Texas: A cross-sectional study. Journal of the Academy of Nutrition and Dietetics. 2013;113(4):558-562.
5. Whitaker RC, Becker BD, Herman AN, Gooze RA. The physical and mental health of head start staff: The Pennsylvania head start staff wellness survey, 2012. Prev Chronic Dis. 2013;10:E181. doi: 10.5888/pcd10.130171 [doi].
6. Linnan L, Arandia G, Bateman LA, Vaughn A, Smith N, Ward D. The health and working conditions of women employed in child care. International journal of environmental research and public health. 2017;14(3):283.
7. Mouchacca J, Abbott GR, Ball K. Associations between psychological stress, eating, physical activity, sedentary behaviours and body weight among women: A longitudinal study. BMC Public Health. 2013;13(1):828.
8. Block JP, He Y, Zaslavsky AM, Ding L, Ayanian JZ. Psychosocial stress and change in weight among US adults. Am J Epidemiol. 2009;170(2):181-192.
9. Moore CJ, Cunningham SA. Social position, psychological stress, and obesity: A systematic review. Journal of the Academy of Nutrition and Dietetics. 2012;112(4):518-526.
10. Faulkner M, Gerstenblatt P, Lee A, Vallejo V, Travis D. Childcare providers: Work stress and personal well-being. Journal of Early Childhood Research. 2016;14(3):280-293.
11. Gonnissen HK, Adam TC, Hursel R, Rutters F, Verhoef SP, Westerterp-Plantenga MS. Sleep duration, sleep quality and body weight: Parallel developments. Physiol Behav.
12. Chaput J. Sleep patterns, diet quality and energy balance. Physiol Behav. 2014;134:86-91.
13. Benjamin SE, Rifas-Shiman SL, Taveras EM, et al. Early Child Care and Adiposity at Ages 1 and 3 Years. Pediatrics. 2009;124(2):555-562. doi: 10.1542/peds.2008-2857.
14. Benjamin-Neelon SE, Vaughn AE, Tovar A, Østbye T, Mazzucca S, Ward DS. The family child care home environment and children's diet quality. Appetite. 2018;126:108-113.
15. Federal Interagency Forum on Child and Family Statistics. America’s Children: Key
National Indicators of Well-Being, 2018. Washington, DC: U.S. Government Printing Office.
16. Bandura A. Social foundations of thought and action. Englewood Cliffs, NJ. 1986;1986.
17. Bandura, A., Freeman, W. H., & Lightsey, R. Self-efficacy: The exercise of control. WH Freeman & Company, NY. 1997.
18. Anderson ES, Winett RA, Wojcik JR, Williams DM. Social cognitive mediators of change in a group randomized nutrition and physical activity intervention: Social support, self-efficacy, outcome expectations and self-regulation in the guide-to-health trial. Journal of health psychology. 2010;15(1):21-32.
19. Warziski, M. T., Sereika, S. M., Styn, M. A., Music, E., & Burke, L. E. Changes in self-efficacy and dietary adherence: the impact on weight loss in the PREFER study. Journal of behavioral medicine. 2008; 31(1), 81-92.
20. Whitebook M, McLean C, Austin LJ. Early childhood workforce index, 2016. Center for the Study of Child Care Employment, University of California at Berkeley. 2016.
21. Ward DS, Vaughn AE, Burney RV, Ostbye T. Recruitment of family child care homes for an obesity prevention intervention study. Contemp Clin Trials Commun. 2016;3:131-138. doi: 10.1016/j.conctc.2016.05.001 [doi].
22. Østbye T, Mann CM, Vaughn AE, et al. The keys to healthy family child care homes
intervention: Study design and rationale. Contemporary Clinical Trials. 2015;40:81-89. doi: //doi.org/10.1016/j.cct.2014.11.003.
23. North Carolina Division of Child Development. Child Care Facility Search Site. http://ncchildcaresearch.dhhs.state.nc.us/search.asp. Accessed, 2013.
24. Block G, Hartman AM, Naughton D. A reduced dietary questionnaire: Development and validation. Epidemiology. 1990;1(1):58-64. http://www.jstor.org/stable/20065625.
26. Guenther PM, Casavale KO, Reedy J, et al. Update of the healthy eating index: HEI-2010.
Journal of the Academy of Nutrition and Dietetics. 2013;113(4):569-580.
27. Guenther, P. M., Kirkpatrick, S. I., Reedy, J., Krebs-Smith, S. M., Buckman, D. W., Dodd, K. W., ... & Carroll, R. J. The Healthy Eating Index-2010 is a valid and reliable measure of diet quality according to the 2010 Dietary Guidelines for Americans. The Journal of
nutrition. 2014; jn-113.
28. Stewart AL. Measuring functioning and well-being: The medical outcomes study approach.
Duke University Press; 1992.
29. Spritzer K, Hays R. MOS sleep scale: A manual for use and scoring, version 1.0. Los Angeles, CA. 2003:1-8.
30. Hays RD, Martin SA, Sesti AM, Spritzer KL. Psychometric properties of the medical outcomes study sleep measure. Sleep Med. 2005;6(1):41-44.
31. Viala-Danten M, Martin S, Guillemin I, Hays RD. Evaluation of the reliability and validity of the medical outcomes study sleep scale in patients with painful diabetic peripheral
neuropathy during an international clinical trial. Health and Quality of Life outcomes. 2008;6(1):113.
32. Cappelleri JC, Bushmakin AG, McDermott AM, et al. Measurement properties of the medical outcomes study sleep scale in patients with fibromyalgia. Sleep Med.
2009;10(7):766-770.
33. Allen RP, Kosinski M, Hill-Zabala CE, Calloway MO. Psychometric evaluation and tests of validity of the medical outcomes study 12-item sleep scale (MOS sleep). Sleep Med.
2009;10(5):531-539.
34. Cohen S, Kamarck T, Mermelstein R. A global measure of perceived stress. J Health Soc Behav. 1983:385-396.
35. Cohen, S., & Williamson G. Perceived stress in a probability sample of the United States. Spacapan, S. and Oskamp, S (Eds.). The Social Psychology of Health. Newbury Park, CA: Sage, 1988.
36. Schwarzer R, Renner B. Social-cognitive predictors of health behavior: Action self-efficacy and coping self-efficacy. Health psychology. 2000;19(5):487.
37. Norman GJ, Carlson JA, Sallis JF, Wagner N, Calfas KJ, Patrick K. Reliability and validity of brief psychosocial measures related to dietary behaviors. International Journal of
38. Richert J, Reuter T, Wiedemann AU, Lippke S, Ziegelmann J, Schwarzer R. Differential effects of planning and self-efficacy on fruit and vegetable consumption. Appetite. 2010;54(3):611-614.
39. Greeno, C. G., & Wing, R. R. Stress-induced eating. Psychological bulletin. 1994; 115(3), 444.
40. Linde JA, Rothman AJ, Baldwin AS, Jeffery RW. The impact of self-efficacy on behavior change and weight change among overweight participants in a weight loss trial. Health Psychology. 2006;25(3):282.
41. Teixeira, P. J., Carraça, E. V., Marques, M. M., Rutter, H., Oppert, J. M., De Bourdeaudhuij, I., ... & Brug, J. (2015). Successful behavior change in obesity interventions in adults: a systematic review of self-regulation mediators. BMC medicine, 13(1), 84.
42. Povey R, Conner M, Sparks P, James R, Shepherd R. Application of the theory of planned behaviour to two dietary behaviours: Roles of perceived control and self-efficacy. British Journal of Health Psychology. 2000;5(2):121-139.
43. Mezuk, B., Ratliff, S., Concha, J. B., Abdou, C. M., Rafferty, J., Lee, H., & Jackson, J. S. Stress, self-regulation, and context: Evidence from the health and retirement survey. SSM-population health. 2017; 3, 455-463.
44. Krystal, A. D., & Edinger, J. D. Measuring sleep quality. Sleep medicine. 2008; 9, S10-S17.
45. Buysse, D. J. Sleep health: can we define it? Does it matter?. Sleep. 2014; 37(1), 9-17.
46. Barber, L. K., & Munz, D. C. Consistent-sufficient sleep predicts improvements in self -regulatory performance and psychological strain. Stress and Health. 2011; 27(4), 314-324.
47. Benham, G. Sleep: an important factor in stress-health models. Stress and Health. 2010; 26(3), 204-214.
48. Baldwin D, Gaines S, Wold JL, Williams A, Leary J. The health of female child care providers: Implications for quality of care. J Community Health Nurs. 2007;24(1):1-17.
49. Lindsay, A. C., Greaney, M. L., Wallington, S. F., & Wright, J. A. Easier said than done: a qualitative study conducted in the USA exploring Latino family child care home providers as role models for healthy eating and physical activity behaviours. BMJ open. 2017; 7(11), e018219.
51. Peuhkuri, K., Sihvola, N., & Korpela, R. Diet promotes sleep duration and quality. Nutrition research. 2012; 32(5), 309-319.
52. Stevenson, R. J. Psychological correlates of habitual diet in healthy adults. Psychological bulletin. 2017; 143(1), 53.
53. Child Care Services Association. Working in Early Care and Education in North Carolina: 2015 Workforce Study. December 2015.’
54. National Center for Health Statistics, What We Eat in America/National Health and Nutrition Examination Survey, 2013-2014. Healthy Eating Index-2015, U.S. Department of