U.S. Immigration Policy and Public Opinion
Between 2007 and 2016
By Amy Burton
Honors Thesis
Department of Political Science University of North Carolina at Chapel Hill
Approved:
Acknowledgements
Special thank you to my advisor, Dr. Hetherington, and readers, Dr. Summerlin-Long and Dr. Maxwell, for guiding me through this thesis.
Table of Contents
Acknowledgements ... 1
Abstract ... 3
Background ... 4
Discriminatory Immigration Practices ... 4
Bracero Agreement and IRCA ... 6
1990s, 2000s, and 2010s ... 7
The DREAM Act and DACA ... 8
Immigration Theory ... 9
Immigration & Public Opinion Today ... 10
This Thesis ... 11
Data and Methods ... 12
Dataset Assembly ... 12
Data Cleaning & Manipulation ... 21
Results ... 22
Limitations ... 57
Major Takeaways and Implications ... 60
Abstract
In the last few decades, immigration policy has once again risen to the forefront of United States politics. A 2018 Gallup poll found that up to a fifth of U.S. residents identify immigration as “the most important problem” facing the country.1 Despite high issue prioritization in the mass public, political elites have been unable to implement policy changes to confront what the public views as a problem.
This thesis aims to better understand a) how the voting population’s immigration policy preferences have shifted in the last decade, b) how politics, geography, and immigrant
interaction play a role in these shifts, and c) how other major discernable factors such as state median age and unemployment rate covary with policy preferences. In order to understand these concepts, it is necessary to provide a brief account of U.S. immigration history, explore some of the existing theoretical frameworks, and consider the disconnect between public policy and public opinion.
Background
The U.S. is often called “a nation of immigrants” because most U.S. citizens, excluding Native Americans, descend from other nations and heritages. Throughout history, the U.S. has heavily relied on immigrants for much of the country’s economic and population growth. However, I place the phrase in “scare quotes” because the U.S. has historically accepted only certain types of “desirable” immigrants. This section explores the history of U.S.
immigration policy to understand how it informs today’s immigration policy debate.
Discriminatory Immigration Practices
The U.S. has always favored certain groups of immigrants over others, a strange irony for “a country of immigrants.” For example, U.S. founders Benjamin Franklin and Thomas
Jefferson -- both of British heritage -- wrote of German inferiority in their respective works. Jefferson critiqued Germans for choosing to settle in clusters, writing that they should instead choose to distribute themselves amongst the population in order to assimilate.2 Franklin took a more direct approach, characterizing German immigrants to the U.S. as “generally of the most ignorant Stupid Sort of their own Nation” in a letter written in 1753.3 Though this
anti-German sentiment was not translated into law, many other influential political figures with anti-immigrant views successfully translated their views into policy.
2 Thomas Jefferson and H. A. Washington, The Writings of Thomas Jefferson: Being His Autobiography,
Correspondence, Reports, Messages, Addresses, and Other Writings, Official and Private, (New York, John C. Riker, 1853).
3 Benjamin Franklin, Founders Online: From Benjamin Franklin to Peter Collinson, (National Archives and
Racially discriminatory laws and practices have marred the United States’ immigration policy history. Just three years after signing the Constitution, the 1790 Naturalization Act moved to exclude non-white naturalization.4 Eight years later, the Alien Friends Act and Alien Enemies Act each worked to legalize deportation.5 The same year brought the Sedition
Act, which criminalized false criticisms of the U.S. government. These four acts
foreshadowed a long line of restrictive policies meant to favor particular types of immigrants and exclude others.
Four policies shaped the immigration scene of the 1800s: the Immigration Act of 1864, the Naturalization Act of 1870, the Asian Exclusion Act, and the Chinese Exclusion Act. The Immigration Act of 1864 encouraged immigration due to post-Civil War labor shortages, and the Naturalization Act of 1870 allowed African American residents to naturalize. These two policies promoted immigration and resulted in a higher naturalization rate than had
previously been recorded. The latter two, the Asian Exclusion Act of 1875 and Chinese Exclusion Act of 1882, laid the groundwork for explicit discrimination against individuals from Asia who hoped to immigrate to the United States. These Exclusion Acts persisted until the 1943 Magnuson Act, which repealed the Exclusion Acts, created a path to citizenship for Chinese residents, and permitted slightly more than 100 Chinese immigrants per year.
The 1900s yielded different policies aimed to attract particular demographics and target newly-introduced quotas. For example, the Johnson-Reed Act of 1924 favored immigration
4 D’Vera Cohn, How U.S. Immigration Laws and Rules Have Changed through History, (Pew Research Center,
2015).
5 Daniel J. Tichenor, Dividing Lines: The Politics of Immigration Control in America, (New Jersey, University
from northern and western European countries while the 1952 Immigration and Nationality Act removed race as a disqualifier altogether.6 This era of policy saw a shift in racial preferences, moving the policy-based racial discrimination away from Asia and towards Mexico and Central America. Throughout this time period, racial discrimination within immigration also became less overt.
Bracero Agreement and IRCA
Congressional committees, bureaucracies, and interest groups comprise “iron triangles”. In the 1930s, an iron triangle based in the south and southwest parts of the U.S. supported Mexican labor importation. The entities believed that Mexican labor was the optimal choice because laborers could return to Mexico and as such would not settle in the United States.7 Franklin D. Roosevelt’s Bracero Agreement of 1942 formalized this triangle to mitigate farm labor shortages during World War II.8 The program allowed Mexican individuals to visit the U.S. to complete short-term agricultural work. Despite being the U.S.’s largest guest worker program, the Bracero Program developed a controversial reputation because farmers
exploited it to contract cheaper labor. In 1964, Congress ended the Bracero Program after years of contentious extensions.
Throughout the 1960s and 1970s, more Mexican individuals entered the U.S. in search of greater economic opportunity.9 Many of the men became “economic agents” for their
families back in Mexico, which prompted further migration to the United States. Eventually,
6U.S. Department of State, The Immigration Act of 1924 (The Johnson-Reed Act).
U.S. citizens and their government noticed this mass migration. By the late 1970s, the U.S. began taking steps to control the situation.
The Immigration Reform and Control Act of 1986 (IRCA) has been one of the most relevant pieces of U.S. immigration policy to date. The legislation, signed into law by Ronald Reagan and sometimes derisively referred to as the Reagan Amnesty, granted a path to citizenship for the undocumented individuals who had continuously resided in the U.S. since 1982. IRCA also legalized certain agricultural workers, penalized employers who knowingly hired undocumented individuals, and increased U.S. border enforcement by building walls at the most prolific entrance points.10,11
1990s, 2000s, and 2010s
Following IRCA, immigration policy became more accepting and sought to provide
exceptions for particular circumstances. Under President H.W. Bush, the Immigration Act of 1990 altered immigration policy and transformed it into the structure we see today, though minor variations have been implemented throughout the years. This act increased the annual immigration cap to 700,000 total individuals and created the Diversity Visa, which acts as a lottery for applicants around the world wherein winners are granted a path to citizenship. Temporary Protected Status allows immigrants from disaster-ridden countries to seek temporary refuge in the U.S. until their home country can support them again.
Since the reforms of the late 1980s and early 1990s, little immigration reform has passed through Congress. The sparse policy that has been written into law largely revolves around border security and program modernization to account for today’s technologically-advanced society. For example, the Secure Fence Act of 2006 authorized about 700 miles of fences along the U.S-Mexico border but has not been carried out due to lack of funding.12 There have been a number of failed pushes to further increase border patrol and improve border security between the U.S. and Mexico.
The DREAM Act and DACA
The Development, Relief, and Education for Alien Minors Act, or the DREAM Act, is an unsuccessful U.S. legislative proposal that has been reintroduced multiple times throughout the last two decades. If passed, the legislation would create a conditional path to citizenship for certain undocumented immigrants who were brought to the U.S. in their youth.
In response to Congress’ inability to act, President Obama enacted a program called Deferred Action for Childhood Arrivals, or DACA, in 2010. Starting in 2012, individuals who entered the U.S. without documentation after 1981 while under the age of 16 became eligible to enroll in the program. DACA provides program participants with work authorization and temporarily prevents deportation. Participants must re-enroll every two years, and program acceptance depends on good standing.13
DACA stands in a unique space separate from other immigration policy issues. Unlike most immigration initiatives of the last fifty years, it has become a highly partisan issue. President Barack Obama implemented it, and Republicans, most notably President Donald Trump, have castigated it. As a result, many people have developed strong opinions about the program. Fake news sources circulate misinformation about DACA, which more reputable news sources rarely dispute effectively. Additionally, DACA benefits from having ambitious college-aged participants who bring positive attention to the program. This combination of high issue relevance, public opinion polarization, and misinformation pervasiveness separates DACA from the remainder of immigration policy.
Immigration Theory
There are two distinct aspects of the immigration process: first, the physical movement from country of origin to the new “host” country; and second, the integration into the host
country’s society and culture.14 For policymakers, the former is termed “immigration theory”
while the latter is “immigrant theory”. Each state implements its own policies pertaining to immigrant integration within society, resulting in a wide range of policies that interact with one another. Statewide immigrant policies also interact with federal immigration policy. In some cases, the interactions are antagonistic while in others they are more synergistic.
Immigration policy can either be expansive or restrictive. An expansive one promotes immigration and a restrictive one looks to limit or cut off immigration, especially from certain regions. According to Tichenor, no “neutral option” exists because any effort to
maintain the status quo inevitably creates new structures to combat change, which, in turn, changes the structure of immigration.15 Immigration policy can also be expansive or restrictive towards immigrant rights, wherein expansive policy strives to grant immigrants close to full citizenship rights and restrictive policy does not.16 The U.S.’s consistently high
intake of immigrants points to an expansive policy overall, but the limitations put on certain geographic areas point to restrictive tendencies.
Immigration & Public Opinion Today
An issue’s salience for the public depends on context. This thesis’ second sentence, which noted that a fifth of U.S. residents believed immigration was the most important problem at the moment, illustrates this point exceedingly well. The Gallup poll is administered monthly, and the salience of immigration has differed significantly over time. The results from July 2018 found that 22% prioritized immigration, but, in June, that percentage was less than half of that at 10%.17 While immigration policy is clearly still important, public opinion shifts
constantly because it is contextualized by current events. Thus, public opinion cannot be measured at one time; it must instead be aggregated and viewed over time to understand how the context has changed.
Generally speaking, public opinion polls find that U.S. residents view immigrant groups more positively as generations pass. For example, many groups that immigrated to the U.S. about a century ago were discriminated against and strongly disliked at the time of
15 Daniel J. Tichenor, Dividing Lines: The Politics of Immigration Control in America, 7.
16 Terri Givens and Adam Luedtke. The Politics of European Union Immigration Policy: Institutions, Salience,
and Harmonization, (Policy Studies Journal, 2004).
immigration, but today are considered a benefit to society. In the same vein, the general populace views today’s immigrant groups more negatively.
Historical literature suggests that U.S. immigration policy and public opinion are often at odds with one another.18 When the public supported expansive policy, government was more likely to have implemented a comparatively restrictive policy, and vice versa.
A number of other factors influence immigration public opinion. Many of these influences were included as control variables in the analysis in order to pinpoint covariation. They are listed and explained in the Data and Methods section.
This Thesis
Just as new immigration legislation has been limited in recent decades, so has research on immigration policy. Most recent research has focused on the impact of immigration via theoretical research or utilizing an economic-based approach. The latter, in particular, extends an everlasting debate on the economic advantage or disadvantage of immigration. Through all of this, research and society itself do not fully understand society’s opinion of immigration, nor does academic research approach U.S. immigration from a geographic, state-based perspective. This thesis endeavors to explore immigration policy public opinion using a quantitative approach and the state as the unit of analysis.
18
Data and Methods
This section outlines the thesis dataset assembly process and the methods used to analyze the data. To access the full dataset and Stata do-file, please contact Amy Burton at
[email protected]. Two Excel files exist: one optimized for Excel, “Burton Excel”, and the other for Stata, “Burton Stata”.
Dataset Assembly
CCES Survey Questions
I first worked to identify data that measures public opinion about immigration policy. Because this analysis takes place at the state level, data collections needed to be sufficiently large to include enough respondents in all fifty states to make meaningful comparisons. The Cooperative Congressional Election Study, or CCES, fulfilled these requirements. The CCES is a national stratified sample survey of approximately 50,000 people that measures public opinion on a variety of issues.19 In order to accurately discern how elections shift public
opinion, each “wave” of the CCES conducted during an election year consists of two sub-waves, one before the election and another afterward. For non-election years, the survey has a single wave during the same time period. Because this study focuses on the importance of changing political context to understanding public opinion, it is also helpful that the CCES has asked the same questions about immigration across multiple waves.
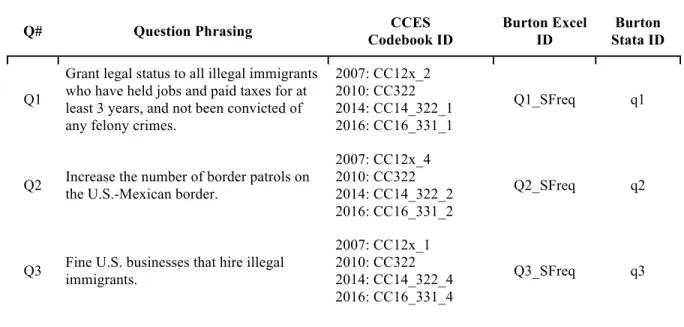
Specifically, the CCES includes three questions about immigration across four waves of the data collection: 2007, 2010, 2014, and 2016. The three questions are as follows:
Table 1. CCES questions and associated IDs
Q# Question Phrasing CCES
Codebook ID Burton Excel ID Burton Stata ID Q1
Grant legal status to all illegal immigrants who have held jobs and paid taxes for at least 3 years, and not been convicted of any felony crimes.
2007: CC12x_2 2010: CC322 2014: CC14_322_1 2016: CC16_331_1
Q1_SFreq q1
Q2 Increase the number of border patrols on the U.S.-Mexican border.
2007: CC12x_4 2010: CC322 2014: CC14_322_2 2016: CC16_331_2
Q2_SFreq q2
Q3 Fine U.S. businesses that hire illegal immigrants.
2007: CC12x_1 2010: CC322 2014: CC14_322_4 2016: CC16_331_4
Q3_SFreq q3
Because CCES data are collected at the individual level, I aggregated individuals’ responses to the three questions by state using Stata’s cross-tabulation command, which is coded as “tab var1 var2”. The binary outputs of each question made for three columns of interest for each question: number of individuals per state who selected “yes” (Q1_S), number of individuals per state who selected “no” (Q1_NS), and total individuals per state who responded to the survey (Q1_R). After being copied to Excel, the sum of Q1_S and Q1_NS served as a data entry check with total individuals responded.
Political Lean
Over the last decade, immigration has become an increasingly partisan political issue. As such, it is important to control for the partisan composition of a state to avoid attributing the effect of partisanship to variables of interest. Given that the Republican party has become the anti-immigration party, I suspect that states that vote more Republican will also be less supportive of immigration. However, I could not create a standard variable to represent political lean. Of the CCES survey years, only 2016 is a presidential election year, so I would have needed to utilize state elections in order to get the most time-specific results. Because state election political platforms vary so widely, I recognized that I could not compare the %Democrat in Alabama to the same in %Hawaii. Hawaii’s Democratic candidate would run on a far more progressive platform than Alabama’s. Therefore, I needed to use Presidential elections in a way that represented non-election years.
Region
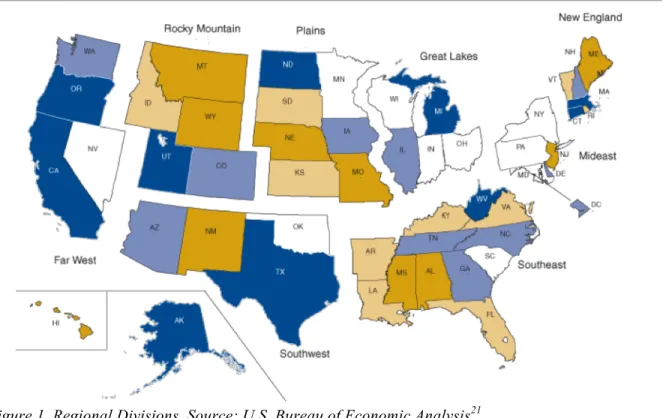
States’ geographic situation also has the potential to be important to understanding immigration attitudes. A 2017 study found that anti-immigration policies proliferate regionally in the U.S., particularly in the Southeast region.20 Here, I use the U.S. Bureau of Economic Analysis’ preset regional division (see below, Figure 1). This particular map represents this study’s regions for two reasons: first, the federal government has fewer outside motivations that could introduce bias into the study; second, the map grouped
Arizona, New Mexico, and Texas together in the Southwest category. These three states have the most miles directly connected to the U.S.-Mexico border, which acts as a relevant
component of geography in this study. I suspect that the Southwest region will have more polarized policy views, but am unsure whether they will be pro- or anti-immigration.
20 Yalidy Matos, "Geographies of Exclusion: The Importance of Racial Legacies in Examining State-Level
Figure 1. Regional Divisions. Source: U.S. Bureau of Economic Analysis21
The Far West category includes Hawaii and Alaska. For the regressions, Southeast
intentionally serves as the reference category for the model in order to form a null to which the other categories can be compared. The Southeast acts as the null due to the region’s suspected anti-immigrant sentiment.
Legal Permanent Resident Measures
A 2004 NPR poll found that native-born U.S. citizens who interact with immigrants less are more likely to view immigrants negatively.22 For this study, the measure %Legal Permanent Residents captures the potential amount of interaction that respondents have with
immigrants. A higher percentage of legal permanent residents in a state increases the chances that non-immigrants will have the opportunity to interact with immigrants.
The number of legal permanent residents (LPRs) by state was taken from the Department of Homeland Security, LPR 2016, Table 4. Because states vary widely by population, I divided the number of LPRs by the total population per state, which I found through the American Community Survey (ACS). I repeated this process for the four waves of CCES data.
Other Variables of Interest
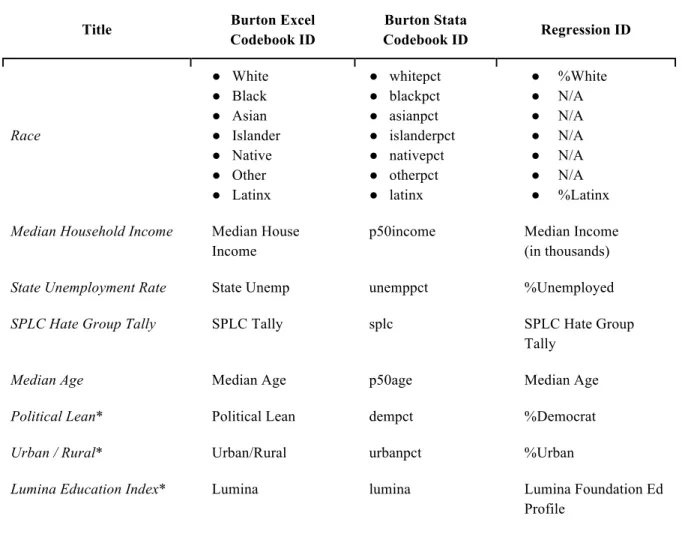
Table 2. Control variables and associated IDs
Title Burton Excel
Codebook ID
Burton Stata
Codebook ID Regression ID
Race ● White ● Black ● Asian ● Islander ● Native ● Other ● Latinx ● whitepct ● blackpct ● asianpct ● islanderpct ● nativepct ● otherpct ● latinx ● %White ● N/A ● N/A ● N/A ● N/A ● N/A ● %Latinx
Median Household Income Median House Income
p50income Median Income (in thousands)
State Unemployment Rate State Unemp unemppct %Unemployed
SPLC Hate Group Tally SPLC Tally splc SPLC Hate Group
Tally
Median Age Median Age p50age Median Age
Political Lean* Political Lean dempct %Democrat
Urban / Rural* Urban/Rural urbanpct %Urban
Lumina Education Index* Lumina lumina Lumina Foundation Ed
Profile
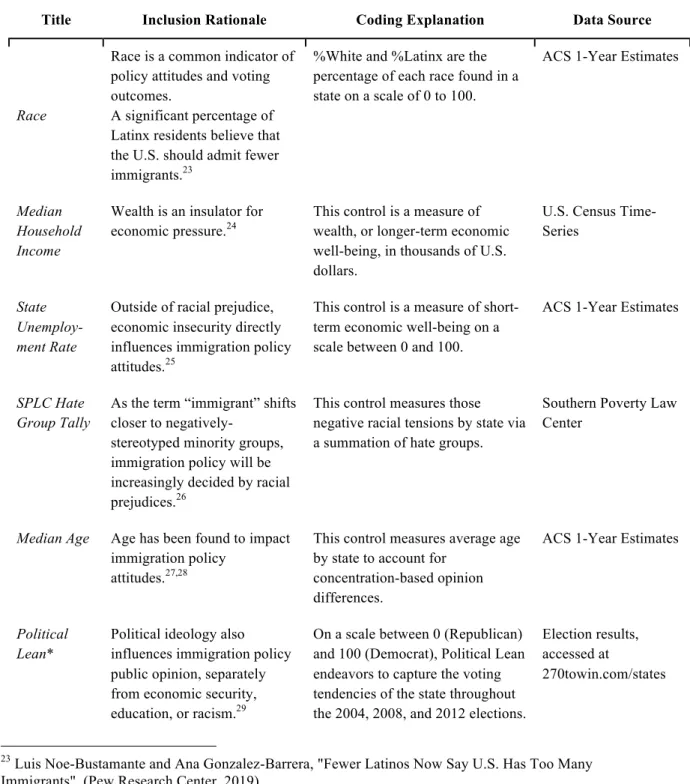
Table 3. Control Variables, Inclusion Rationales, Coding Explanations, and Data Sources
Title Inclusion Rationale Coding Explanation Data Source
Race
Race is a common indicator of policy attitudes and voting outcomes.
A significant percentage of Latinx residents believe that the U.S. should admit fewer immigrants.23
%White and %Latinx are the percentage of each race found in a state on a scale of 0 to 100.
ACS 1-Year Estimates
Median Household Income
Wealth is an insulator for economic pressure.24
This control is a measure of wealth, or longer-term economic well-being, in thousands of U.S. dollars.
U.S. Census Time-Series
State Unemploy- ment Rate
Outside of racial prejudice, economic insecurity directly influences immigration policy attitudes.25
This control is a measure of short-term economic well-being on a scale between 0 and 100.
ACS 1-Year Estimates
SPLC Hate Group Tally
As the term “immigrant” shifts closer to
negatively-stereotyped minority groups, immigration policy will be increasingly decided by racial prejudices.26
This control measures those negative racial tensions by state via a summation of hate groups.
Southern Poverty Law Center
Median Age Age has been found to impact immigration policy
attitudes.27,28
This control measures average age by state to account for
concentration-based opinion differences.
ACS 1-Year Estimates
Political Lean*
Political ideology also influences immigration policy public opinion, separately from economic security, education, or racism.29
On a scale between 0 (Republican) and 100 (Democrat), Political Lean endeavors to capture the voting tendencies of the state throughout the 2004, 2008, and 2012 elections.
Election results, accessed at
270towin.com/states
23 Luis Noe-Bustamante and Ana Gonzalez-Barrera, "Fewer Latinos Now Say U.S. Has Too Many
Immigrants", (Pew Research Center, 2019).
24 Burns and Gimpel, "Economic Insecurity", 205. 25 Ibid, 204.
26 Ibid, 204.
27 Charles R. Chandler and Yung-Mei Tsai, "Social Factors Influencing Immigration Attitudes: An Analysis of
Data from the General Social Survey", (The Social Science Journal 38, no. 2, 2001) 177-88.
28 Katherine Fennelly, "Why Immigration Worries Americans – Especially Rural Residents" (Scholars Strategy
Network - Basic Facts, 2012).
Urban / Rural*
Increasing rurality has been linked with stronger anti-immigrant attitudes.30
On a scale between 0 (rural) and 100 (urban), this variable looks at population distribution by state.
U.S. Census, 2010
Lumina Education Index*
Increased education has been linked to higher levels of tolerance for immigrants.31
On a scale between 0 (uneducated) and 100 (well-educated), this variable evaluates states by their educational systems and attainment.
Lumina Foundation
Although the meaning of many of the variables is self-evident, one requires more explanation.
Lumina Education Index
The Lumina Foundation is an education foundation “committed to making opportunities for learning beyond high school available to all”.32 One of their initiatives, Stronger Nation, used
2016 data to measure post-secondary educational attainment by state as an index measuring from 0 to 100. This index had a national average of 46.9, which showed that the index was not too stringent or lenient. This control functions as a proxy for average educational
attainment. I anticipate that higher educational attainment will be linked with higher support for pro-immigration policy and less support for anti-immigration policy.
30 Katherine Fennelly and Christopher Federico, "Rural Residence as a Determinant of Attitudes Toward US
Immigration Policy" (International Migration 46, no. 1, 2008), 151-90.
Data Cleaning & Manipulation
Following data collection, the data underwent iterative cleaning. Part of this process included assistance from data visualization librarian Lorin Bruckner and Odum Institute ResearchHub Statistical Consultant Bailey.
After importing the Excel file into Stata, I estimated a series of ordinary least squares regression models. The mean response by state by year to CCES questions served as the dependent variable with the remaining variables cast as explanatory variables. From the race category, I included only whitepct and latinxpct as controls due to concerns about collinearity causing statistical problems if I included other race variables. Though the two variables exhibited some collinearity, I felt confident that enough variation existed to find any discernable racially-based patterns.
Results
Recall that the Cooperative Congressional Election Study (CCES) asked three questions to better understand public opinion about immigration. These questions also allow me to identify factors that influence these opinions. The CCES prefaced the three questions in the same way: “Should the U.S. government enact the following policy: [Question #]” Study participants responded either yes or no.
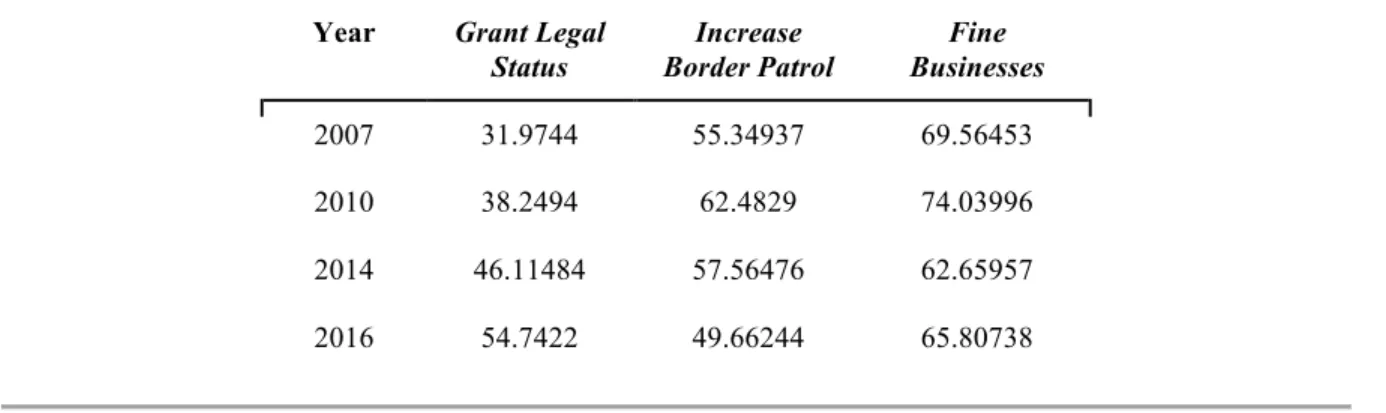
To begin, I looked at CCES question support by year, which is shown below in Table 4. From this, I garnered an understanding of the general trends within each CCES question of interest.
Table 4. CCES Question Percentage Support by Year
Year Grant Legal Status
Increase Border Patrol
Fine Businesses
2007 31.9744 55.34937 69.56453
2010 38.2494 62.4829 74.03996
2014 46.11484 57.56476 62.65957
2016 54.7422 49.66244 65.80738
The first policy of interest is:
Effectively, this survey question asks whether people support granting legal status for undocumented immigrants. It does not use the inflammatory language or key phrases that prompt a party response rather than a personal opinion. This phrasing can be both an asset and a limitation because, while this question reveals how individuals feel about the topic when presented dispassionately, immigration is often not presented as such in real political dialogue.
As shown in Figure 2, which appears to the right, public support for granting legal status increases steadily between 2007 and 2016. In 2007, the average statewide support for the policy was 31.97%; in 2016, this number increased by 22.77 percentage points to 54.74% support. 2007 had a wide range of responses: Massachusetts recorded 50.45% public support while Wyoming recorded 11.11%. In 2010, the average support in a state rose to 38.25%, with Vermont showing the most support at 63.04 and Idaho showing the least at
27.38%. 2014’s results showed heightened public support again with a state average of 46.11%. Hawaii had the highest support for granting legal status with 60.22%, and South Dakota had the lowest with 35.34% public support. 2016 recorded the highest average state support of the four years at 54.74%. The most supportive state was Maryland (60.67%) and the least supportive was West Virginia (46.62%).
Because there are three years between waves 1 and 2, four years between waves 2 and 3, and only two years between waves 3 and 4, the approximately 8-point gap between each wave means that the question has garnered support at a higher rate between the last two waves than in previous iterations.
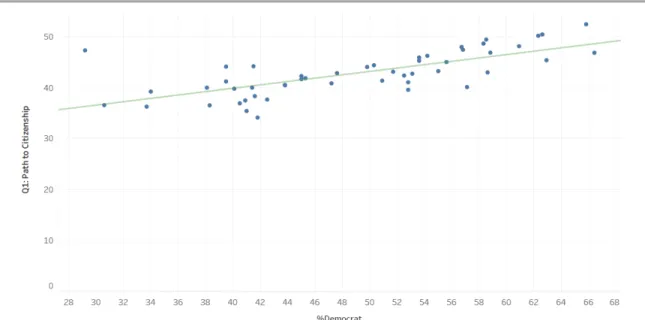
Figure 3. Granting Legal Status Percentage Support by Percent Democrat Line of Best Fit: Q1 Support = 0.33*%Dem +26.61 | R2=0.52
Figure 3 shows that more Democrat-leaning states have higher support for granting legal status. For example, states with higher Republican voting tendencies such as Wyoming and Idaho are shown on the left half of the graph and have 36.60 and 36.31 percent average support for this policy, respectively. On the other hand, Hawaii and Vermont tend to vote for Democrats at high rates; these states have 46.87 and 65.80 percent average support for granting legal status. The two states closest to the 50% x-axis marker, swing states Florida and Virginia, have 44.09% and 44.42% public support, respectively. Both political lean and public support vary widely in this figure, and the trend line captures a large amount of covariation.
with 47.34% public support for granting legal status. This high support could be attributed to Utah’s religious uniquity or the state’s significantly younger median age.
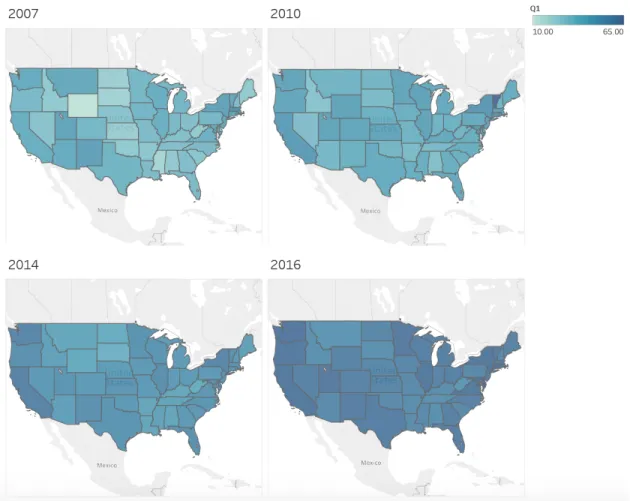
Figure 4. Geographic visualization of public support for granting legal status per wave of the CCES
Note first how the map gradually darkens throughout the four iterations, which reflects the increased support for the policy. Second, the Midwest has slightly lighter colors throughout the visualization. Perhaps this is due to a sense of resentment from agricultural workers in the region. Because of this difference, regions will likely have a significant impact on attitudes, even after controlling for other factors in a regression.
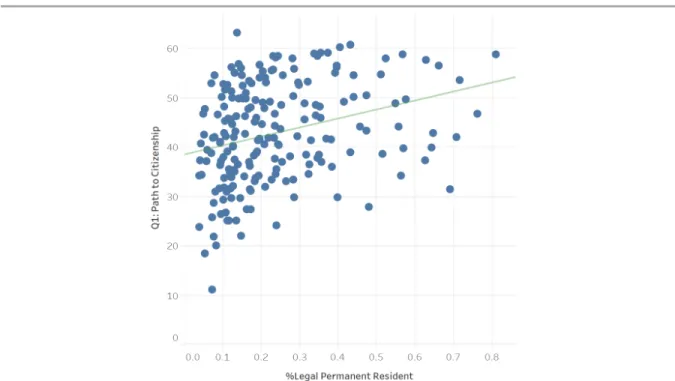
permanent residents within each state. Below, I plot this measure across states with the percentage of people from those states who support granting legal status.
Figure 5. Granting Legal Status Percentage Support by Percent Legal Permanent Resident Line of Best Fit: Q1 Support = 18.23*%LPR + 38.41 | R2=0.09
0.0393 (West Virginia) to 0.8097 (New York). This limited range of %LPR, wide range of public support, and wide variation from the trend line confirms that %LPR likely does not strongly influence public support for granting legal status.
The second policy from the CCES is:
“Increase the number of border patrols on the U.S.-Mexican border”.
Unlike the previous model, higher responses here signal anti-immigration policy views. Additionally, note that the question measures the proportion of individuals who want to increase, not maintain, patrols.
This policy’s public opinion is not necessarily an inversion of the previous one, which suggests that citizens think about immigration issues in different ways. For example, in the 1980s, IRCA created both a path to citizenship and a physical barrier to stop new individuals from crossing over the border. This policy strove to improve life for those already in the U.S. but simultaneously cut off the opportunity for people to continue exploiting the system.
Public opinion on increasing border patrol looks to have fluctuated throughout the study period. The first year of interest, 2007, had an average public support level of 55.35%. In this year, Vermont had significantly less support than other states with 28.00% public support. Wyoming (72.22%) had the highest support of any state. 2010 recorded 62.48% support on average with a much smaller range of responses. Alabama (69.84%) had the highest support and Vermont (50.00%) had the lowest
support. In 2014, the average state had 57.56% of the Figure 6. Increasing Border
public’s support. State support ranged from Hawaii with 47.31% to Mississippi with 66.40%. Finally, 2016 showed the average as 49.66%, with state public support percentages ranging from 43.53% (California) to 57.58% (West Virginia).
2007 stands as a time of high variation and low consensus on the topic; as time passes, this variation decreases. In 2010, both increasing border patrol and fining businesses had higher public support for their respective policies than in any other CCES wave. This is likely due to the Great Recession and its economic stressors; the event triggered a seemingly short wave of anti-immigrant sentiment. Following 2010, support for increasing border patrol has dropped steadily. This decrease in support led to a 2016 average of 49.7%, which creates a distinct split within U.S. residents who do and do not support the proposed policy.
Figure 7. Increase Border Patrol Percentage Support by Percent Democrat Line of Best Fit: Q2 Support = -0.31*%Dem +71.23 | R2=0.49
As Figure 7 shows, increasing Democrat sway results in lower support for increasing border patrol. The two most Republican-leaning states, Utah and Wyoming, had 53.69% and 59.48% respective public support for the policy. On the right-hand side of the figure, Vermont and Hawaii were the most Democrat-leaning and had 44.11 and 47.05 percent public support, respectively. Florida and Virginia took the central ground with 57.18% and 55.74%, respectively. Figure 7 may be better represented by a quadratic equation or other curved equation given the scatterplot’s inverted U shape.
States with direct access to the border, California, New Mexico, Arizona, and Texas, were not outliers on this question. Texas and Arizona polled only slightly above the line of best fit while California and New Mexico fell below the line. However, given that Texas and
line of best fit with only these four states yields a stronger relationship between increase border patrol and %Democrat.
To better understand the regional differences in public support for increasing border patrol, I made a geographic visualization to compare state public support over time. I expect that the Midwest will maintain more anti-immigrant sentiment than their regional neighbors.
Unlike granting legal status, increased border patrol experiences both growth and decline in public support during this time period. As explained above, the increase in public support in 2010 likely points to the Great Recession; the decrease in support since that period
corresponds with the economic recovery that has taken place since then. 2016’s map shows significantly lower support for the policy than any other iteration, including 2007.
In 2007, 2014, and 2016, the Midwest region has some of the darkest colors, signaling higher public support for increased border patrol. Comparatively, the Far West region, New Mexico, and Vermont have lighter colors than their surroundings throughout all four waves.
Figure 9. Increase Border Patrol Percentage Support by Percent Legal Permanent Resident Line of Best Fit: Q2 Support = -13.98*%LPR +59.61 | R2=0.11
As expected, higher levels of %LPR by state correlates with lower public support for increased border patrol. In 2010, Wyoming recorded 58.02% public support with 0.0801% LPR within the state’s population. New Jersey in 2007 had a significantly higher %LPR of 0.64% and a lower public support percentage of 51.56.
Though the trend line seems to capture most of the data’s variation, it’s worth noting that the points are largely clustered on the left half of the graph, signifying lower %LPRs. For
A fewer number of points on the right-hand side of the graph likely have more influence over the trend line. Just as in the previous CCES policy question, the small range of %LPRs limits the practical application of this relationship.
This graph’s outlier is Vermont in 2007 with a %LPR of 0.1273 and the lowest public support of any state at 28.00%. In 2016, Vermont’s support had increased to 45.45%. The four points furthest to the right are New York over the four waves with the furthest right being in 2016.
The CCES phrased the third question as:
“Fine businesses that hire illegal immigrants.”
Like the previous question, this is also a measure of anti-immigrant sentiment. Unlike either of the other questions, this CCES question relates to the business aspect of immigration. Some people might support fining business if they harbor negative feelings towards immigrants or if they dislike businesses and want to see them held accountable. As such, answers to this question are the least likely to conform to a party platform.
The 2010 iteration of the CCES had a lower sample size than the other waves of the study. This especially applies to this third question, wherein some of the states’ 2010 results had to be omitted due to low sample size. I withheld these results from both the geographic
visualizations. In addition, the subsequent regression has 48 of the 50 data points from the 2010 wave; the other waves had large sample sizes, which allowed me to include all states.
Figure 10 shows majority support for fining businesses that hire undocumented immigrants. In 2007, the average state had 69.56% support for fining businesses, with Kansas (82.42%) measuring the highest support and Vermont (48.00%) showing the least. 2010’s surge of anti-immigrant support led to a higher mean of 74.04%. In this year, Idaho (94.12%) and Nevada (92.59%) had the highest support while Alaska (25.00%) and Hawaii (40.00%) had the lowest. 2014 showed the lowest levels of support for fining
businesses out of the four years with an average of 62.66% support; here, South Dakota had the highest support with 72.18% and New York had the lowest with 51.77%. In 2016, the average increased to 65.81%, which is only 5 percentage points lower than the 2007 survey’s average. South Dakota showed the most support for fining businesses with 80.00% and Vermont showed the lowest with 54.55%.
Fine businesses has an unknown trend and points to a general lack of consensus among the general populace. The wide range of public support percentages has no obvious path forward and may vary in any number of ways in future surveys as public knowledge about fining businesses oscillates.
Figure 11. Fine Businesses Percentage Support by Percent Democrat Line of Best Fit: Q3 Support = -0.20*%Dem +76.90 | R2=0.09
Figure 11 shows a weak negative correlation between increasing Democrat support and support for fining businesses. While the trend line captures the general direction of movement as %Democrat increases, it does not capture the majority of variation in public support. Likewise, %Democrat fails to differentiate states’ public support for this CCES question. Wyoming and Iowa, for example, respectively record 71.42% and 71.53% public support for fining businesses, but Wyoming leans strongly Republican with %Democrat at 30.60% while Iowa leans slightly Democrat at 52.50%.
Three states with moderate Republican lean, Nebraska, Alaska, and Montana, have
Given that partisanship is not strongly related to support for fining businesses, other variables must play a more sizable role. Because anti-immigrant policies can cluster subnationally, region could account for this variation. To test this theory, I created the same geographic visualization as in the previous CCES questions. I hypothesize that states without access to a coast or country border will have higher levels of support because their lower levels of immigrant interaction will make these states less sympathetic when considering immigrant-focused policies.
As with increased border patrol, this geographic visualization shows that fining businesses experienced a significant bump in support in the 2010 iteration, but support dipped in subsequent surveys. States with direct access to a border look to have only minimally lower support for fining businesses. Besides this, Figure 12 does not uncover any additional major trends of interest.
Perhaps %LPR will play a larger role in explaining support for fining businesses that hire illegal immigrants. I expect that higher %LPR will result in lower support for fining
Figure 13. Fine Businesses Percentage Support by Percent Legal Permanent Resident Line of Best Fit: Q3 Support = -11.65*%LPR +70.76 | R2=0.05
As with previous graphs comparing %LPR to public support, the narrow range in %LPR limits the utility of the wide range in public support. Fining businesses, unlike the other CCES questions studied, looks to have a stronger, possibly significant, correlation with %LPR.
A fair number of outliers litter the graph, such as Alaska in 2010 with 25% support and Hawaii in 2010 with 40% support. Despite these outliers, this trend is still significant and should be further explored in the multivariate model.
These three CCES policy questions all have intriguing correlations with political lean, region, and %LPR. In order to better understand which variables have a stronger influence, I ran an OLS regression for each question. Regression allows me to account for the independent influence of a range of different variables in the same model while controlling for the influence of the others. In addition to the three variables I have analyzed above in detail, I include a number of other variables as controls.
Table 5. Regression Outputs, Granting Legal Status
Variable Coefficient
(Std Error)
t P>|t| 95% Confidence Intervals
%Legal Permanent Res. 5.819359
(4.009141)
1.45 0.148 -2.091306 13.73002
%White .0689927
(.048927)
1.41 0.160 -.027548 .1655333
%Latinx -.0218178
(.0659809)
-0.33 0.741 -.1520084 .1083728
%Democrat .3608528*
(.0832277)
4.34 0.000 .1966315 .5250742
%Urban -.027958
(.0423591)
-0.66 0.510 -.1115391 .0556232
%Unemployed -.2376582
(.1627055)
-1.46 0.146 -.5587017 .0833853
Median Income (in thousands) -.0018328 (.0704339)
-0.03 0.979 -.14081 .1371444
Median Age -.9637013*
(.2587527)
-3.72 0.000 -1.474261 -.4531416
SPLC Hate Group Tally .0117466
(.026784)
0.44 0.661 -.0411025 .0645957
Lumina Foundation Ed Profile .2396803* (.1033099)
2.32 0.021 .0358337 .4435269
Year 2.52122*
(.1179728)
21.37 0.000 2.288441 2.753999
Regional Analysis
Far West -.5813038
(1.67818)
Rocky Mtns -1.527376 (1.692094)
-0.90 0.368 -4.866142 1.811391
Southwest .6564126
(1.883164)
0.35 0.728 -3.059365 4.372191
Plains -3.854415*
(1.470184)
-2.62 0.009 -6.755319 -.953512
Great Lakes -.1896941
(1.584697)
-0.12 0.905 -3.31655 2.937161
Mideast -.1183279
(1.656519)
-0.07 0.943 -3.386901 3.150245
New England .3224711
(1.982636)
0.16 0.871 -3.589582 4.234524
Constant -5024.016
(234.1646)
-21.46 0.000 -5486.06 -4561.973
The results of the regression model largely follow expectations as it relates to the influence of key variables in the model. Take the influence of party. In this model, for every 1% increase in Democrat lean, the state’s support for granting legal status increased by 0.36 of a percentage point. The most Republican-leaning state, Utah (29.2%), and the most Democrat-leaning state, Hawaii (66.4%), therefore have a 13.39 percentage-point gap in public opinion based solely on political lean, other things being equal.
Year has the strongest covariation within this model, with each passing year resulting in a 2.5 percentage point increase in support for granting legal status. Over the span of 2007 to 2016, this becomes a sizeable increase in support measuring 22.5 percentage points.
Although age has not been a central focus thus far, it is influential within this model. As the median age of a state rises by 1 year, statewide support for granting legal status drops by 0.96 percentage points. This becomes practically significant when looking at the wide range of median ages; for example, Texas’s low median age of 33.2 and Maine’s high median age of 41.7 would have a 8.16 percentage-point difference due to median age.
Lumina Foundation’s Education Profile also found statistical significance. For every
Surprisingly, Plains is the singular region with a statistically significant relationship for this CCES question. States in this region, which include North Dakota, South Dakota, Nebraska, Kansas, Minnesota, Iowa, and Missouri, consistently recorded support for granting legal status about 3.85 percentage points lower than the Southeast. Because no other region in the U.S. differed significantly from the Southeast, this public opinion difference is also
applicable to the Far West, Rocky Mountains, Southwest, Great Lakes, Mideast, and New England regions. I hypothesized that the Southeast would poll as the least immigrant-friendly, so Plains is an unexpected result. This anti-immigrant sentiment could be due to lower immigrant exposure throughout the region. Alternatively, the Plains’ overwhelmingly agricultural role could indicate that agricultural workers place immigrants in a negative light.
Several variables do not hold statistical significance; these include %Unemployed, %Urban, and Median Income. %Unemployed and %Urban become significant in the latter two
models, so their lack of significance here prompts special interest. Unemployment’s triviality here means that economic fluctuations are unlikely to impact public support. Also, the fact that urban and rural environments hold the same views suggests that increases in support are not due to a loud minority in either geographic subsect. Year also accounts for more of the covariation in this model before dropping to a less significant (though still relevant) position for the latter two CCES questions. Together, these variables confirm that granting legal status has a support system separate from other immigration policy topics.
Table 6. Regression Outputs, Increase Border Patrol
Variable Coefficient
(Std Error)
t P>|t| 95% Confidence Intervals
%Legal Permanent Res. -8.144355
(4.521466)
-1.80 0.073 -17.06592 .7772074
%White -.02948
(.0551793)
-0.53 0.594 -.1383574 .0793975
%Latinx -.0265591
(.0744125)
-0.36 0.722 -.1733867 .1202684
%Democrat -.4462427*
(.0938633)
-4.75 0.000 -.6314498 -.2610357
%Urban .1049522*
(.0477721)
2.20 0.029 .0106903 .199214
%Unemployed 1.546644*
(.1834975)
8.43 0.000 1.184575 1.908714
Median Income (in thousands) .0625212 (.0794346)
0.79 0.432 -.0942157 .2192582
Median Age 1.060798*
(.2918185)
3.64 0.000 .4849943 1.636602
SPLC Hate Group Tally .0177285
(.0302067)
0.59 0.558 -.0418741 .0773311
Lumina Foundation Ed Profile -.072086 (.1165117)
-0.62 0.537 -.3019819 .15781
Year -.6102639*
(.1330484)
-4.59 0.000 -.8727893 -.3477385
Regional Analysis
Far West -1.95752
(1.892633)
Rocky Mtns 1.081035 (1.908325)
0.57 0.572 -2.684389 4.84646
Southwest 1.664297
(2.123812)
0.78 0.434 -2.526317 5.854911
Plains 5.770541*
(1.658057)
3.48 0.001 2.498934 9.042148
Great Lakes -.2768301
(1.787204)
-0.15 0.877 -3.803264 3.249604
Mideast 2.273916
(1.868205)
1.22 0.225 -1.412345 5.960177
New England 1.241174
(2.235996)
0.56 0.580 -3.170797 5.653145
Constant 1250.254
(264.0883)
4.73 0.000 729.1661 1771.342
This regression found the following variables to be statistically significant: %Democrat, Median Age, Year, %Urban, and %Unemployed. %Democrat and Year both had negative relationships in which higher levels of the variable led to lower public support. Increasing any one of Median Age, %Urban, and %Unemployed prompted higher support for increasing border patrol. Additionally, the Plains region had significantly higher public support than other regions. Though not statistically significant at the 95% CI, %LPR’s t-value of -1.80 means that the variable had practical significance, wherein higher percentages of LPRs in a state resulted in lower public support.
To put this into context, this model indicates that a Republican-leaning state with an average 60/40 vote margin would support increased border patrol 9 percentage points more than a Democrat-leaning state with a 60/40 vote margin.
Compared to the previous model, Year is far less significant. Though the variable still clearly plays a role in survey responses here, the variable accounts for less of the variation than for granting legal status. Here, the regression indicates that, for each additional year, support for border patrol drops by 0.61 of a percentage point. From 2007 to 2016, this translates to a 5.49 drop in support.
While not statistically significant, %LPR’s coefficient of -8.144 and -1.80 t-value hold
practical significance. Take 2016, for example. New York’s %LPR of 0.81 is 0.76 percentage points higher than West Virginia’s 0.05. According to this regression model, this difference in %LPR accounts for a 6.19 percentage-point difference in public support for fining businesses.
Median Age shows covariation that is both statistically and practically significant: for every 1-year increase in a state’s median age, the support for border patrol increases by 1.06 percentage points. In 2016, the gap between a state with an older median age, such as
Maine’s median age of 44.5, compared to Oklahoma’s younger median age of 36.4 would be expected to have a 8.59 percentage point gap with Oklahoma less supportive of border patrol.
Table 7. Regression Outputs, Fine Businesses
Variable Coefficient
(Std Error)
t P>|t| 95% Confidence Intervals
%Legal Permanent Res. -15.62286*
(6.86641)
-2.28 0.024 -29.17238 -2.073337
%White .1463427
(.0840663)
1.74 0.083 -.0195458 .3122312
%Latinx .030003
(.1133694)
0.26 0.792 -.1937094 .2537154
%Democrat -.1819937
(.1435162)
-1.27 0.206 -.465195 .1012076
%Urban .210459*
(.0724955)
2.90 0.004 .0674033 .3535147
%Unemployed 1.486165*
(.2787454)
5.33 0.000 .9361152 2.036215
Median Income (in thousands) .334365* (.1212747)
2.76 0.006 .095053 .573677
Median Age .4832335
(.4479292)
1.08 0.282 -.4006676 1.367135
SPLC Hate Group Tally .0469535
(.0459518)
1.02 0.308 -.0437234 .1376305
Lumina Foundation Ed Profile -.3915718* (.1770166)
-2.21 0.028 -.7408796 -.042264
Year -.9450847*
(.2021746)
-4.67 0.000 -1.344037 -.5461323
Regional Analysis
Far West -5.827496*
(2.89362)
Rocky Mtns .6360677 (3.024848)
0.21 0.834 -5.332881 6.605017
Southwest .048832
(3.251116)
0.02 0.988 -6.366613 6.464277
Plains 6.909735*
(2.552618)
2.71 0.007 1.87264 11.94683
Great Lakes -2.445234
(2.72032)
-0.90 0.370 -7.813257 2.922789
Mideast -.8732111
(2.83811)
-0.31 0.759 -6.47367 4.727247
New England -2.95602
(3.39755)
-0.87 0.385 -9.660423 3.748383
Constant 1925.465
(401.3037)
4.80 0.000 1133.57 2717.36
Fining businesses relies on different variables than the prior two models. As foreshadowed by Figure 11, %Democrat was not statistically significant. Instead, a myriad of other variables influenced public support: %LPR, Lumina, Year, %Urban, %Unemployed, and Median Income. %LPR, Lumina, and Year each had a negative coefficient, meaning that increasing any one of them would result in lower public support. Conversely, %Urban, %Unemployed, and Median Income had positive relationships in which an increase in one related to an increase in public support.
%Legal Permanent Resident’s coefficient of 15.62 seems incredibly significant at first glance; however, because every state has <1% LPR in each wave, this result must be scaled back for correct interpretation. Consider West Virginia and New York: West Virginia’s 2010 %LPR of 0.039 differs from New York’s 2010 % LPR of 0.763 by 0.724. When applying the coefficient to this, %LPR represents a 11.31 percentage point difference in public opinion with higher %LPR resulting in lower public support for the policy.
For every percent increase in %Urban, support for fining businesses increases by 0.21. When comparing a state with low urban clustering, such as Maine in 2007, to a state with high urban concentration, such as California in 2007, the range accounts for a 8 percentage point difference in public opinion.
Support for fining businesses increases by 1.49 percentage points for every percentage point increase in %Unemployed. In 2016, the range between New Hampshire’s low and
Mississippi’s high unemployment rates comprises a 6.11 percentage point difference in public opinion, wherein Mississippi residents have greater support for fining businesses.
For every percentage point in Lumina, the support for fining businesses decreases by 0.38 percentage points. The gap between West Virginia’s 34.7 and Colorado’s 55.7 results in a 7.98 percentage point public opinion differentiation.
Every year between 2007 and 2016, support for fining businesses dropped 0.95 percentage points. Over nine years, this becomes a 8.55 percentage point decrease in support.
Limitations
This project relies on secondary data. It would have been impossible for me to collect the data myself, but secondary data also comes with a hefty limitation: without collecting the data yourself, the collection methodology cannot ever be truly confirmed. Fortunately, the CCES has a relatively long history of high-quality work. It is not a true random cross-section of the American public, but it does approximate one.
Below are a number of smaller, yet important limitations that might have introduced bias into the study. The CCES 2010 codebook phrases Question 3 as “fine businesses”; the other iterations phrase the question as “fine businesses that hire illegal immigrants”. A copy of the actual survey could not be located. It seems unlikely that the survey would change the sample question for that single wave of the study given that “fine businesses” is so vague as to be unanswerable. Therefore, I assumed that the survey phrased the question as “fine businesses that hire illegal immigrants”. All other questions had exact phrasing throughout all four waves.
Measuring education by state also presented a challenge. Because an education index by state could not be found through the U.S. government website, I used the Lumina index instead. Background research suggested that a) Lumina has no political partiality, and b) the
organization utilized a methodology to measure not only outcomes but also infrastructure in each state. Additionally, Lumina’s index yielded similar results as education outcomes found by ACS surveys, which are reputable and used regularly in social sciences research.
Although Lumina is a largely unknown actor that withheld their full index methodology from the public, there is no outward reason to discount its index’s validity. Still, the lack of
methodological understanding warrants the label of limitation.
For the Regions portion of the study, I struggled to place Hawaii and Alaska. The Far West category includes Hawaii and Alaska, but these states are physically remote from the other states in the category. In addition, Alaska’s more conservative politics departs from the rest of the region, which might have influenced Far West’s outputs within the regressions section.
Major Takeaways and Implications
This section highlights some of the more practically significant results found in my project. Public support for granting legal status has increased markedly over the last decade.
Policymakers should begin to weigh the long-term implications of either granting legal status or denying that path for an extended period of time with this rising public support.
Republicans’ conservative position on this matter might become politically untenable.
The first regression gauged public support for granting legal status to undocumented immigrants, which is a pro-immigrant policy proposal. Political lean, median age,
educational system strength, and year were all statistically significant in the model. Year had the strongest relationship: moving forward by a year increased public support by 2.52
percentage points. Political lean (0.36) and educational system strength (0.24) both also had positive coefficients. Median age had a negative relationship in which an added year resulted in a 0.96 percentage point loss in public support. States in the Plains region had lower public support by about 3.85 percentage points.
Second, I ran a regression to test public support for increasing border patrol. In this model, political lean, median age, year, percent population in urban areas, and percent
direction on immigration. A single year increase in median age accompanied a 1.06
percentage point increase in public support. Percent urban (0.10) and unemployment (1.55) also had positive relationships with public support. Percent LPR had a practically, though not statistically, significant negative relationship as well wherein a one percentage-point increase in LPR led to a 8.14 percentage-point decrease in public support. As with granting legal status, the Plains region was the sole region to garner statistical significance. For increasing border patrol, states in the region had a 5.77 boost in public support.
Fining businesses covaried with a number of unexpected variables. Education system strength, year, percent population in urban areas, percent unemployment, percent LPR, and median household income all played a significant role in this model. Additionally, the Far West region (-5.83) joined Plains (6.91) in statistical significance, though Far West resulted in lower support while states in the Plains had higher support. Education system strength (-0.39), year (-0.95), and percent LPR (-15.62) had negative relationships, meaning that higher education, more recent years, and higher immigrant contact all resulted in lower support for fining businesses. A percentage point increase in urban proportion by state, unemployment rate, or median household income resulted in 0.21, 1.49, and 0.33 respective increases in public support.
order for individuals and lawmakers to make informed decisions on this matter, the public must have a greater understanding of the topic and its long-term tradeoffs.
Both increasing border patrol and fining businesses had significant non-characteristic fluctuations in public support in the 2010 survey, likely due to the economic strain of the Great Recession. The 2016 survey results showed that the public moved back towards the 2007 levels of support for both questions. Moving forward, we should monitor whether the public support levels off at the 2007 levels or whether support moves past those original percentages.
Granting legal status and increasing border patrol had statistically significant relationships with political lean but not with %LPR. Conversely, %LPR, but not political lean, was
significant in fining businesses. Because political lean and %LPR had no overlap in statistical significance, further research should consider whether the variables interact or overlap to eclipse one another’s significance.
%White and %Latinx do not yield significant results in any of the three models. This indicates that race likely plays an insignificant role in immigration public opinion. Because 34% of the U.S. Latinx population is foreign-born, %Latinx was expected to have a high correlation with and act as a proxy for immigrant interaction.33 Instead, %LPR likely accounted for any significance of race. Future studies should seek to separate race and immigration more effectively.
33 Flores, Antonio. "Facts on Latinos in America." Pew Research Center's Hispanic Trends Project. June 13,
The SPLC Hate Group Tally does not differentiate between different types of hate groups; for example, a white supremacist group and a black supremacist group each count as a hate group and cannot be separated using the measure. This lack of differentiation could explain why SPLC failed to have significance in the models. It is also possible that this particular variable’s lack of predictive power suggests that public opinion might not be significantly affected by extremism.
On an aggregate level, median age’s significance for granting legal status and increasing border patrol confirms an overarching trend: younger individuals are more likely to view immigration positively and therefore possess more open-minded views about those entering the U.S. in search of opportunity, regardless of legal status. In the future, older voters will be replaced by the younger ones, which may begin to move public opinion to the left. This majority will likely be pro-immigrant, and, given the rising importance of immigration policy, politicians and policymakers might consider shifting party platforms toward pro-immigrant or pro-immigrant-neutral policies if they intend to capture the demographic.
Individuals in the Plains region hold more anti-immigrant sentiment than the other regions, and this should be kept in mind when campaigning.
Bibliography
Burns, Peter, and James G. Gimpel. "Economic Insecurity, Prejudicial Stereotypes, and Public Opinion on Immigration Policy." Political Science Quarterly 115, no. 2 (2000): 201-25. Accessed March 2019. doi:10.2307/2657900.
Center for History and New Media. "About the Bracero Program." Bracero History Archive. Accessed March 18, 2019. http://braceroarchive.org/about.
Chandler, Charles R., and Yung-Mei Tsai. "Social Factors Influencing Immigration
Attitudes: An Analysis of Data from the General Social Survey." The Social Science Journal 38, no. 2 (2001): 177-88. Accessed March 2019.
doi:10.1016/s0362-3319(01)00106-9.
Cohn, D’Vera. "How U.S. Immigration Laws and Rules Have Changed through History." Pew Research Center. September 30, 2015. Accessed March 2019.
http://www.pewresearch.org/fact-tank/2015/09/30/how-u-s-immigration-laws-and-rules-have-changed-through-history/.
"Consideration of Deferred Action for Childhood Arrivals (DACA)." USCIS. September 2016. Accessed March 2019. https://www.uscis.gov/archive/consideration-deferred-action-childhood-arrivals-daca.
EEOC. "IRCA." Equal Employment Opportunity Commission. November 6, 1986. Accessed March 2019. https://www.eeoc.gov/eeoc/history/35th/thelaw/irca.html.
Fennelly, Katherine. "Why Immigration Worries Americans – Especially Rural Residents."
Scholars Strategy Network - Basic Facts, February 2012. Accessed March 2019. Fennelly, Katherine, and Christopher Federico. "Rural Residence as a Determinant of
Attitudes Toward US Immigration Policy." International Migration 46, no. 1 (2008): 151-90. Accessed March 2019. doi:10.1111/j.1468-2435.2008.00440.x.
Flores, Antonio. "Facts on Latinos in America." Pew Research Center's Hispanic Trends Project. June 13, 2018. Accessed March 2019.
http://www.pewhispanic.org/2017/09/18/facts-on-u-s-latinos/.
Franklin, Benjamin. "Founders Online: From Benjamin Franklin to Peter Collinson."
National Archives and Records Administration. May 9, 1753. Accessed March 2019. https://founders.archives.gov/documents/Franklin/01-04-02-0173.
"Immigration Reform and Control Act of 1986 (IRCA)." USCIS. Accessed March 2019. https://www.uscis.gov/tools/glossary/immigration-reform-and-control-act-1986-irca. Jefferson, Thomas, and H. A. Washington. The Writings of Thomas Jefferson: Being His
Autobiography, Correspondence, Reports, Messages, Addresses, and Other Writings, Official and Private. New York: John C. Riker, 1853.
King, Peter T. "H.R.6061 - 109th Congress (2005-2006): Secure Fence Act of 2006." Congress.gov. October 26, 2006. Accessed March 2019.
https://www.congress.gov/bill/109th-congress/house-bill/6061.
Lumina Foundation. Accessed March 2019. https://www.luminafoundation.org/.
Matos, Yalidy. "Geographies of Exclusion: The Importance of Racial Legacies in Examining State-Level Immigration Laws." American Behavioral Scientist 61, no. 8 (2017): 808-31. Accessed March 2019. doi:10.1177/0002764217720480.
Newport, Frank, and Gallup, Inc. "Immigration Surges to Top of Most Important Problem List." July 18, 2018. Accessed March 2019.
https://news.gallup.com/poll/237389/immigration-surges-top-important-problem-list.aspx.
NPR, Kaiser, and Kennedy School. "Summary of Findings: Immigration." NPR. 2004. Accessed March 2019.
https://www.npr.org/news/specials/polls/2004/immigration/summary.pdf.
Noe-Bustamante, Luis, and Ana Gonzalez-Barrera. "Fewer Latinos Now Say U.S. Has Too Many Immigrants." Pew Research Center. February 19, 2019. Accessed March 2019. http://www.pewresearch.org/fact-tank/2019/02/19/latinos-have-become-less-likely-to-say-there-are-too-many-immigrants-in-u-s/.
"Regional Economic Accounts: About Regional." U.S. Bureau of Economic Analysis (BEA). Accessed March 2019. https://www.bea.gov/resources/learning-center/about-regional. Shashkevich, Alex. "Analyzing Undocumented Mexican Migration in U.S." Stanford News.
May 14, 2018. Accessed March 2019.
https://news.stanford.edu/2018/05/14/analyzing-undocumented-mexican-migration-u-s-1970s/.
Summerlin-Long, Jeffrey. "State and Local." PLCY 349: Immigration Policy in the U.S.. Lecture, 2017.
U.S. Department of State. "The Immigration Act of 1924 (The Johnson-Reed Act). Accessed March 2019. https://history.state.gov/milestones/1921-1936/immigration-act.