Abstract
In recent years there has been increased concern regarding the subsurface contam¬
ination by volatile organic chemicals (VOC's). Many different subsurface remediation
techniques have been used in order to remove these contaminants from the groundwater
and from the unsaturated zone. Subsurface vapor extraction (SVE), also known as soil
vapor extraction or soil venting, is one remediation technique which is being used with in¬
creased frequency to remove VOC's from the subsurface. The purpose of this research was
to investigate the processes affecting the performance and applicability of this remediation
technique.Laboratory experiments were conducted in two different columns packed with glass
beads. VOC's at residual saturation were removed from the columns using nitrogen gas.
Two different contaminants, pure toluene and a toluene-xylene mixture, were used to
residually saturate the columns in order to observe the affect of contaminant volatility
on removal rate. Several different pore velocities were used in order to determine if the
assumption of local equilibrium between phases was valid.
The results of this reseaxch indicate that the local equilibrium assumption is valid for
the pore velocities to be encountered in the subsurface during the operation of a SVE sys¬
Acknow^ledgments
I would like to thank my advisor, Dr. Cass T. Miller, for both his technical and moral
support during the course of this research. I would also like to thank Randall Goodman
and Cliff Burgess for their help in developing the columns and instrumentation needed for
this research. A special thanks to Dr. Donald Wilhoit and his assistants in the Department
of Health and Safety for their often needed assistance. Finally, to my wife June, thanks
for your support. Without your help this task would have been impossible.
This project was fvmded solely by ftmds provided through the Health and Safety Office
Table of Contents
1 Introduction... 1
1.1 Background... . 1
1.2 Remedial Technologies for Subsurface Restoration... 2
1.3 Research Objectives... 4
2 Vapor Extraction Systems... 5
2.1 Introduction... 5
2.2 Components of SVE Systems... 6
2.3 Main Factors Affecting SVE Performance... 8
2.4 Case Studies of SVE Application... 9
2.5 Previous Laboratory Research... 11
3 Fate and Transport of VOC's in the Unsaturated Zone 14
3.1 Introduction... 143.2 Contaminant Transport in the Subsurface ... 15
3.3 Processes Affecting VOC Fate and Transport... 16
3.3.1 Overview ... 16
3.3.2 Gas-Aqueous Phase Partitioning... 17
3.3.3 Volatilization from NAPL Phase... 18
3.3.4 Vapor Phase Diffusion... 19
3.4 Compressible Flow Equations... 21
3.5 Contaminant Transport Equations... 24
3.6 Vapor-Liquid Equilibrium Model... 30
4 Materials and Methods ... 34
4.2 Vapor Extraction Columns... 34
4.2.1 General... 34
4.2.2 Stainless Steel Column ... 35
4.2.3 Glass Column... 37
4.3 Chemicals ... 37
4.4 Vapor Phase Sampling and Analysis... ... 39
4.5 Experimental Procedure... 41
5 Results and Discussion... 44
5.1 Experiments Conducted... 44
5.1.1 Overview... 44
5.1.2 Glass Column Experiments... 44
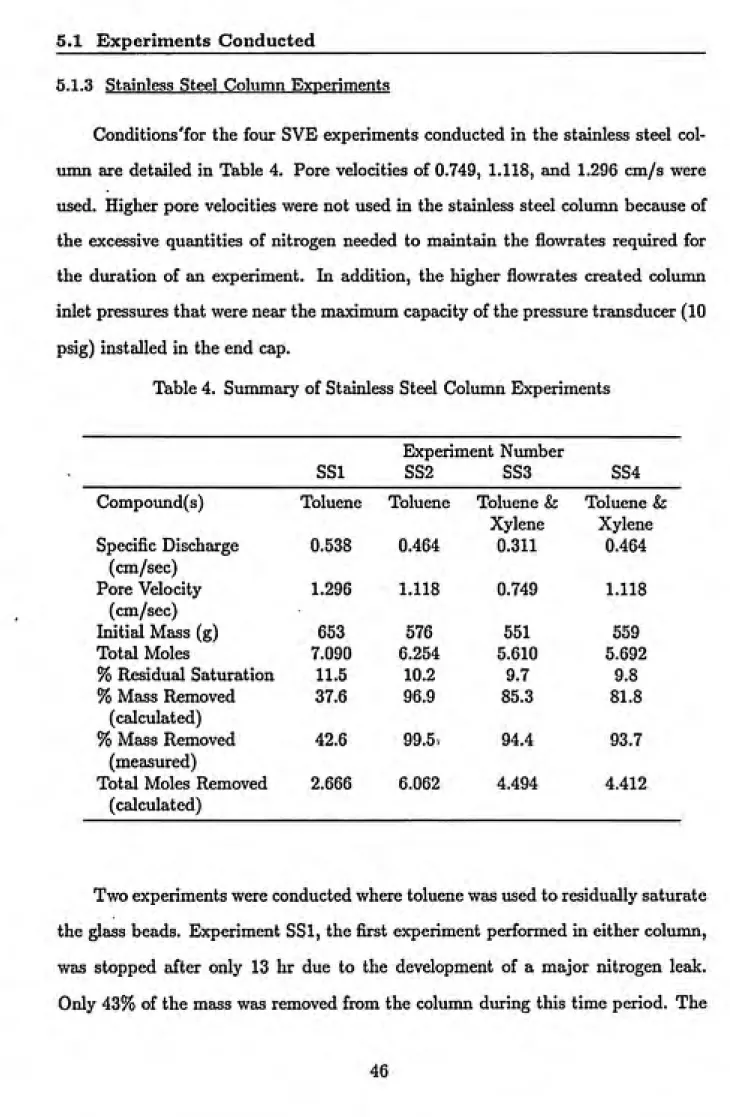
5.1.3 Stainless Steel Column Experiments... 46
5.2 Vapor Pheise Concentration Profiles ... 47
5.2.1 Overview ... 47
5.2.2 Glass Coliunn... 48
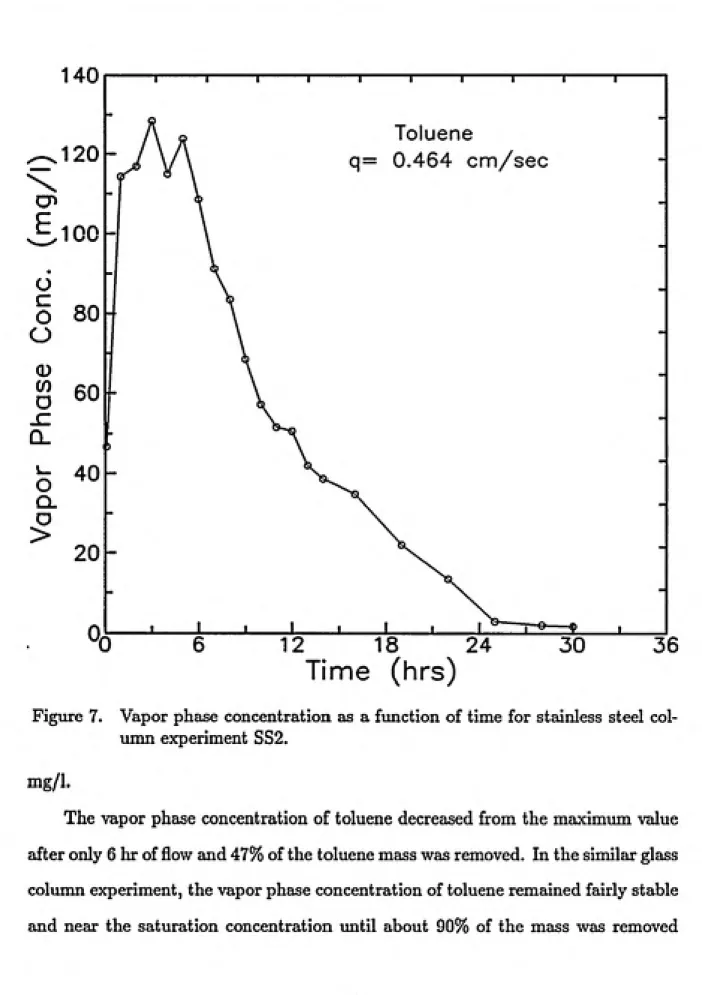
5.2.3 Stainless Steel Column ... 52
5.3 Effect of Experimental Parameters on Contaminant Removal ... 55
5.3.1 General... 55
5.3.2 Vapor Flowrate... 55
5.3.3 Chemical Properties... 59
5.3.4 Moisture Content... 64
5.4 Temperature Changes During SVE... 66
5.5 Column Pressure... 75
5.6 Modeling Efforts... 76
5.7 Mass Transfer Rate Experiments... 83
6 Conclusions and Recommendations... 90
6.1 Conclusions... 90
6.2 Recommendations... 91
List of Figures
1 Schematic of a typical SVE system... 6
2 Stainless steel column apparatus... 36
3 Glass column apparatus... 38
4 Vapor phase concentration of toluene as a function of time and specific dis¬
charge for glass column experiments... 49
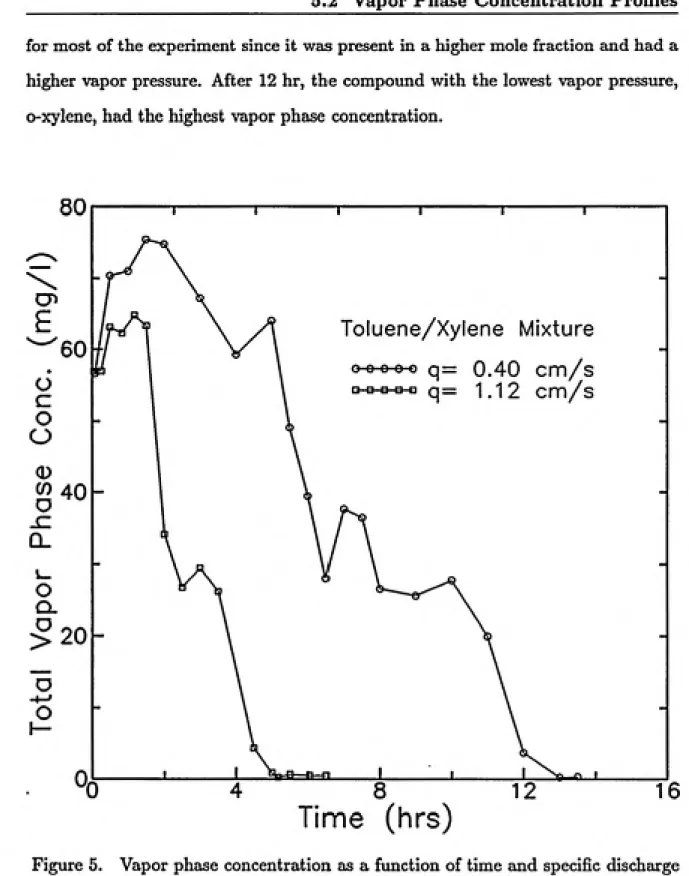
5 Vapor phase concentration as a ftmction of time and specific discharge for the
removal of toluene-xylene mixture from the glass column... 51
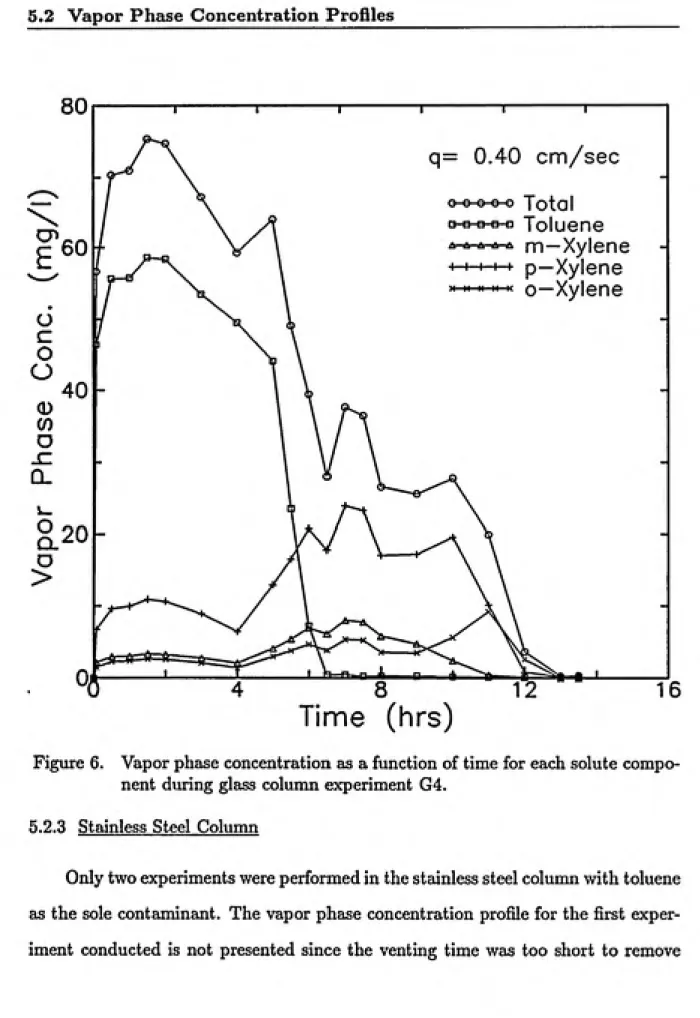
6 Vapor phase concentration as a function of time for each solute component
during glass column experiment G4... 52
7 Vapor phase concentration as a function of time for stainless steel column
experiment SS2... 54
8 Vapor phase concentration as a function of time and specific discharge for the
removal of the toluene-xylene mixture... 56 9 Equilibrium model prediction of contaminant removal as a function of time
and specific discharge... 57
10 Mole fraction removed as a function of bed volumes of gas and specific dis¬
charge for glass column experiments... 60
11 Mole fraction removed as a fimction of bed volumes of gas and specific dis¬
charge for stainless steel column experiments... 61
12 Effect of contaminant composition on mass removal rate... 63
13 Effect of moisture on vapor phase concentrations... 65
14 Saturated vapor phase concentration as a function of temperature and solute
mixture... 68
15 Equihbrium model predicted removal rate of toluene as a function of temper¬
16 Column temperature versus location and time for experiment SS3... 70
17 Column temperatures at the first two thermocouples for experiment SS3. . . 71
18 Column temperature versus location and time for experiment SS4... 73
19 Column temperature versus location and time for experiment SS2... 74
20 Column pressure as a function of time and location for experiment SS4. ... 75
21 Equilibrium model predicted molar removal as a function of time and mixttire
properties... 78
22 Comparison of measured and predicted molar removal for experiment 02. . . 79
23 Comparison of measured and predicted molar removal for experiment SS2. . . 80
24 Comparison of measured and modeled molar removal for the toluene-xylene
mixtiu-e in experiment G4... 83 25 Comparison of measured and modeled molar removal for toluene and xylene
components in experiment G4... 84
26 Adjusted experimental molar solute removal compared to model predictions
for experiment G4... 85
27 Comparison of measured and modeled molar removal for the toluene- xylene
#
List of Tables1 Column Characteristics... 35
2 Properties of Conamon Petroleum Product Components... 39
3 Summary of Glass Column Experiments... 45
1 Introduction
1.1 Background
In recent years there has been increasing concern regarding subsurface contam¬
ination by volatile organic compounds (VOC's) and other hazardous substances.
The number of contamination problems discovered has increased substantially due
to advances in detection methods, rapid growth in the production and disposal of
organic chemicals, and the slow transport of VOC's in the subsurface (Barbash and
Roberts, 1986). As a resxolt of the increased number of contaminated sites needing
clean-up, an extensive subsurface remediation industry has developed.
There are several reasons why the concern for subsurface contamination is jus¬
tifiable. Groundwater serves as the primary source of drinking water for about
half the US population (Saner and Roberts, 1991). In rural areas of the country,
95% of the people depend on groundwater as their sole source of drinking water.
Many of the VOC's that have been discovered in groundwater are known carcino¬
gens (e.g., benzene) or mutagens. Once introduced into the substu-face, VOC's are
quite persistent since most are not readily degraded. They can be transported long
distances by groundwater flow. Finally, groundwater remediation is usually a very
slow and expensive process. The use of pump-and-treat remediation, the most com¬
monly used decontamination method, can improve the quality of the groundwater
and help control the further spreading of contamination. However, this remediation
technique may require very long periods of time to return an aquifer back to its
original condition (Mackay and Cherry, 1989).
1.1 Background
enacted to help regulate the safe disposal and treatment of hazardous wastes gen¬
erated in the United States (RCRA Orientation Manual,1990), thereby attempting
to eliminate contamination problems in the future. The Comprehensive Environ¬
mental Response, Compensation, and Liability Act (CERCLA), commonly called
Superfund, was enacted to address contamination problems caused by inactive or
abandoned disposal sites or spills that require emergency response. CERCLA cre¬
ated a National Priorities List (NPL) of the most dangerous sites needing reme¬
diation. Currently there are about 1200 sites on the NPL (OTA,1989). Finally,
the Safe Drinking Water Act (SDWA) established maximum contaminant levels
(MCL's) for inorganic compounds, organic compounds, and pesticides in drinking
water supplies. So far, MCL's have been set for only a few synthetic organic chem¬
icals and VOC's. The MCL's set by the SDWA are often used as clean-up goals for
groundwater remediation efforts (Goodrich et al., 1991).
As a result of increased governmental regulation and public concern, there are
many sites being remediated at the current time. Because of the limited success
of piunp-and-treat remediation, many new remediation techniques are being used.
All remediation technologies probably will not be able to remove aU of the contam¬
inants present because of the complex substirface geology and the heterogeneous
distribution of contaminants occurring at most sites (Mackay and Cherry, 1989).
1.2 Remedial Technologies for Subsurface Restoration
In most instances, once VOC's or other liquid hazardous chemicals are intro¬
duced into the subsurface they are transported through the unsaturated (vadose)
zone first, before reaching the saturated zone or water table. Once bulk
advec-tive transport ceases, an immobile mass of contaminant remains trapped in the
unsaturated zone by capillary forces. The residual saturation, percentage of pore
1.2 Remedial Technologies for Subsurface Restoration
amount of contaminant retained in the unsaturated pore space decreases with in¬
creasing particle diameter and soil moisture content. The degree of saturation for
gasoline applied to initially dry sands in the laboratory ranged from 14-55%.
As infiltrating water moves past this immobile phase, some of the contami¬ nant mass is dissolved into the aqueous phase and transported down to the aquifer.
This inunobile mass or residual saturation can continue to serve as a source of
groundwater contamination for a long period of time since many VOC's are only
slightly soluble in water (Corapcioglu and Baehr, 1987). Because complete reme¬
diation of groundwater is very difficult, it is important that all possible sources
of contamination be removed from the soil in the unsattirated zone. Remediation
of the contaminated soil above the water table is often done in conjunction with
groundwater pump-and-treat decontamination (Malot and Wood, 1988).
The remedial technologies that are used to clean-up contaminated soils can
be classified as either in situ or non-in situ. The non-in situ technologies include
thermal treatment (incineration), landfiUing, and solidification (Preslo and Miller,
1989). Because non-in situ technologies usually involve the physical removal of
the contaminated soils, they can be very expensive to implement. LandfiUing, a frequently used method for disposal of contaminated soils, is being used with less
frequency due to increased cost and more stringent EPA regulations (Lowrance,
1990).
In situ remediation techniques can be further divided into physical, chemical,
and biological methods (Vreeken and Sman, 1988). The three major physical meth¬
ods of in situ treatment are water flushing, steam stripping, and subsurface vapor
extraction (SVE). Steam stripping is the best method for removing the less volatile
components in highly permeable soils. Water flushing can be used effectively when
1.2 Remedial Technologies for Subsurface Restoration
SVE, also known as forced venting, vacuum extraction, or air stripping, is a relatively new technique that is used to remove a wide range of VOC's from
the subsurface (Hutzler et al., 1989). SVE systems are being used with increased
frequency as paxt of remediation efforts. Because this remediation technology has only been used for the last decade or so, limited reseaxch has been conducted to investigate the processes affecting SVE performance and applicability.
1.3 Research Objectives
The main objective of this research was to gain a better understanding of the
fundamental parameters that affect the removal of volatile organic chemicals from
porous media by SVE. The parameters investigated were vapor flowrate, chemical properties, and temperature. The assumption of local equilibrium existing between the vapor phase and NAPL phase was studied. An attempt was made to model the
«.-mli»»«^*^J^t^,fci«._,
2 Vapor Extraction Systems
2.1 Introduction
This chapter presents a brief description of the design and field application of SVE. The factors that affect the performance and applicability of SVE systems in a general sense are discussed. A review of the limited, but rapidly growing, amount of literature published on SVE is also included.
SVE is an in situ remediation technique used to remove VOC's from the subsur¬
face thereby eliminating the source of further groundwater contamination (Thorton
and Wooden, 1982; Marley and Hoag, 1984; Hutzler et al., 1990). The method
involves simply removing air from the unsatiu:ated zone that contains VOC vapors. Air flow is created by introducing a vacuum in the soil through a series of recovery wells. The flow of clean unsaturated air through the contaminated soil increases the volatilization of the compounds present and provides a controlled pathway for their removal. SVE can also be used to help remove VOC's present as a floating
product on top of grotmdwater (Crow et al., 1987).
SVE has several advantages over other soil remediation techniques (Hutzler et
al., 1989). Unlike non-in situ technologies, SVE systems create minimal disturbance
of the contaminated soil and can be installed in areas where space is limited. For
example, SVE systems have been used to remediate soils contaminated with gasoline
leaking from underground storage tanks below service stations (Hoag and Cliff,
1988). SVE systems can be constructed from standard equipment that is easy to
obtain and operate. It can sometimes be more practical to treat large volumes of
contaminated soil with SVE than with other methods that require soil excavation.
SVE systems can help enhance the natural biodegradation of VOC's by increasing
2.1 Introduction
possible to recover the chemical product from the exhaust air and dispose of it
properly.
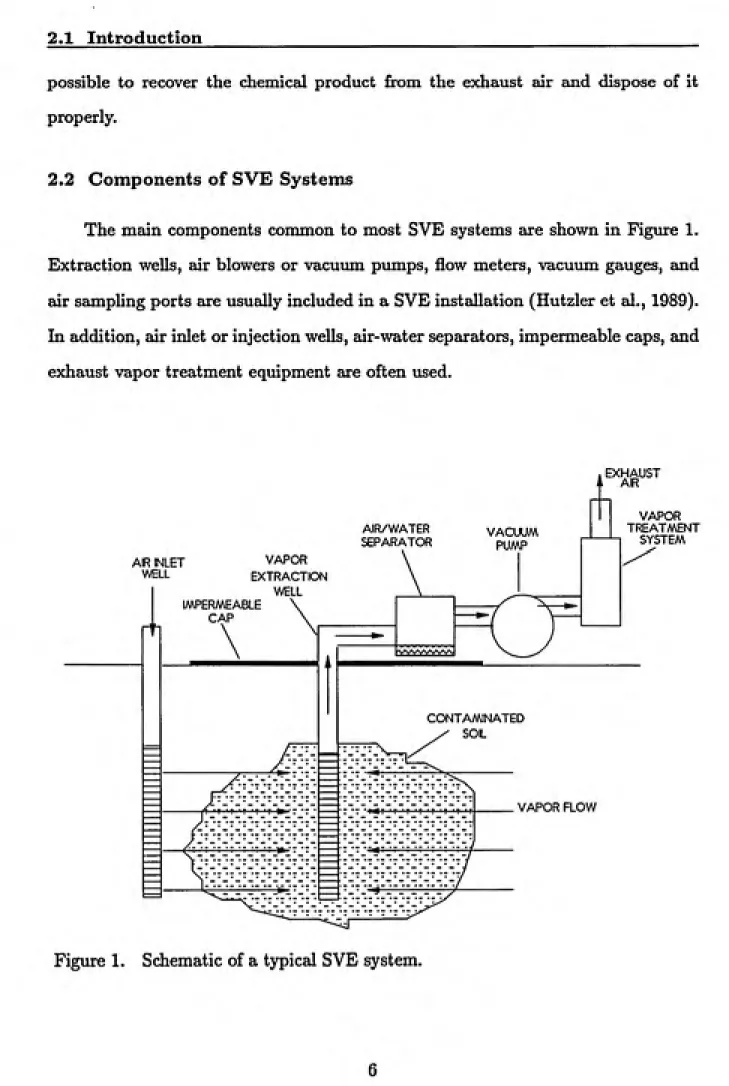
2.2 Components of SVE Systems
The main components common to most SVE systems are shown in Figure 1. Extraction wells, air blowers or vacuum pumps, flow meters, vacuum gauges, and
air sampling ports are usually included in a SVE installation (Hutzler et al., 1989). In addition, air inlet or injection wells, air-water separators, impermeable caps, and exhaust vapor treatment equipment axe often used.
EXHAUST
AIR INLET WELL
AIR/WATER SEPARATOR
VACUUM PUMP VAPOR
EXTRACTION IMPERMEABLE
CAP
CONTAMINATED SOIL
VAPOR FLOW
VAPOR TREATMENT
SYSTEM
2.2 Components of SVE Systems
The extraction wells are usually installed in the areas of highest soil contam¬
ination. The screened section of an extraction well may extend all the way down
to the capillary fringe zone just above the water table. Air inlet wells are used to
help direct the path of air flow through the regions of highest contamination and
to maintain vapor control in localized areas (Crow et al., 1987). In some instances,
pressurized air is injected into air inlet wells in order to increase the vapor flow rate.
Air blowers or vacuum pumps are used to create the pressure drop that causes
the air to flow towards the extraction wells. Typical extraction well pressures cre¬
ated by air blowers are in the range of 0.90-0.95 atmospheres (Johnson et al., 1990).
Air flowrates usually range from 100 to 1,000 scfm.
Gas flow meters, vacuum gauges, and air sampling ports are used in order
to determine the operational efiiciency of the SVE system. Exhaust air samples
are taken periodically along with flow rate measurements in order to calculate the
contaminant mass removal rate. Vacuum gauges are used to determine if there are
any pressure leaks in the system. They are also used to provide some estimate of
the radius of influence of an extraction well along with the media permeability.
Air-water separators axe installed to remove any condensation that may form
in the exhaust air. Air in the subsurface is often near saturation with respect to
water. As the air expands due to the vacuum applied, condensation may occur
(Beimedsen, 1987). The air-water separator is used to protect the air blower as well
as the exhaust vapor treatment equipment from moistvire.
An impermeable cap is often placed over the contaminated site in order to
enhance the horizontal flow of air towards the extraction well (Hutzler et al., 1990).
Without an impermeable cap, air flow may short circviit from the ground surface near the extraction well thereby by-passing the zone of contamination. The radius
of influence of the extraction well may be increased by installing an impermeable
2.2 Components of SVE Systems
the contaminated region. This may help improve the SVE process by inhibiting any further chemical migration to the groundwater table and by reducing the moisture content of the soil. By keeping the moisture content of the soil low, air-water
separators may not be required.
The need for exhaust vapor treatment equipment depends upon the types of compounds being vented, health-based air quality standards, and government air
quality standards (Hydro Geo Chem, 1990). Since the treatment of exhaust air can
comprise up to 50% of the total installation and operational costs of a SVE system
(Koltuniak, 1986), the decision to use exhaust vapor treatment is studied carefully.
It may be possible to avoid using vapor treatment equipment by extending the period of SVE operation and lowering the emission rates. Types of air treatment systems that have been used in SVE installations include liquid-vapor condensers, gas incinerators, catalytic oxidation, and granular activated carbon canisters. Gran¬
ular activated carbon (GAG) systems axe used most frequently. For GAG systems it
is very important to keep the moisture content of the exhaust air as low as possible
in order to optimize the carbon usage rate.
2.3 Main Factors Affecting SVE Performance
Even though the operation of SVE systems is conceptually simple, the per¬ formance and applicability of this remediation technique depends on many factors. The three main factors that control the performance and removal efficiency of SVE
systems are (Johnson et al., 1990):
(1) chemical composition of the contaminant;
(2) vapor flowrates through the contaminated soil; and
(3) flow path of air relative to the location of contaminants.
For a contaminant to be removed by SVE, it must be svifficiently volatile in
2.3 Main Factors Affecting SVE Performance
If a substantial portion of the total contaminant mass is in a pure liquid phase,
then volatility is determined by the vapor pressure of the liquid (Hydro Geo Chem,
1990). If most of the mass is associated with the aqueous phase, volatility will be
controlled by the Henry's constant. Compounds with vapor pressures above 0.5 mm
of mercury and dimensionless Henry's constants above 0.01 are good candidates for
removal with SVE (Bennedsen et al., 1985).
Adequate vapor flowrates must be achieved through the zone of contamination
in order to decrease the remediation time. The removal rate increases with increasedflowrate as long as there is chemical equilibritim between all phases present. Because
there is a limit to the amount of pressure drop that can be induced in an extraction
well, the air permeability of the soil is the most important factor governing the air
flowrates. The air permeability of a soil is a function of media type and volumetric
air content (DiGiulio and Cho, 1990). In general, higher vapor flowrates can be
achieved in sandy media as compared to clayey media.
Finally, the location of the air flow paths relative to the contaminants is very
important to the overall removal rates of contaminants. In homogeneous media
with uniform distribution of contaminaxits, the maximum removal rates will occur.
If the soil contains zones of low permeability (i.e. clay), then the air flow paths
may not be uniformly distributed causing contaminants to diffuse from a relatively
stagnant areas to the air flow paths. Removal rates are much lower when diffusion
limitations occur.
2.4 Case Studies of SVE Application
Because the SVE remediation technique has been used only recently, there are
few case studies reported in the literature. A recent report conducted on behalf of
the USEPA (Hutzler et al., 1989) attempted to summarize some of the field applica¬
2.4 Case Studies of SVE Application
success to a wide variety of remediation problems. Some of the compounds removed
successfully with this method include trichloroethylene, benzene, carbon tetrachlo¬
ride, and gasohne components. Most of the SVE systems were used in conjtinction
with other remediation techniques such as groundwater pump-and-treat.
Many SVE systems have been installed to remediate media contaminated by
leaking underground storage tanks containing gasoline (Hoag and Cliff, 1988; Malot
and Wood, 1988; Crow et al., 1987). In these applications, large amounts of gasoline
were recovered from the unsaturated zone. Removal of large quantities of gasoline
product floating on top of the water table was also observed.
Hutton (1990) reported on the successful remediation of an aquifer contami¬
nated with chlorinated VOC's such as 1,1,1-trichloroethane (TCA). For one year
previous to SVE installation, grotmdwater extraction had failed to reduce the con¬
tamination significantly. By using SVE along with groundwater extraction for 18
months, the total predicted remediation time was reduced by 5 years. Groundwater
concentrations of TCA were reduced from 3,700 ppb to 160 ppb within a period of
118 days.Towbridge and Malot (1990) presented a case study of SVE used to remove
industrial solvents floating as a separate layer on top of the groundwater table. The
thickness of the layer decreased substantially during the first 60 days of operation.
Both chlorinated and aromatic hydrocarbons were removed.
In a majority of the cases reported, the initial mass removal rate was high
and decreased in an exponential fashion with time. The reduction in removal rate
has been associated with the preferential volatilization and biodegradation of lower
molecular weight compounds and mass transfer limitations which become more
2.4 Case Studies of SVE Application
SVE was removed in the first month of a three month operational period. Other researchers report similar results.
2.5 Previous Laboratory Research
The limited amomit of research conducted so far to investigate the SVE process
has varied widely in scale and approach. Several models have been developed to
predict the performance of SVE systems. None of the models have been validated
under a wide range of field conditions.
Thorton and Wootan (1982) conducted a large scale experiment to study the
effectiveness of SVE for removing gasoline from fine sand. A concrete and steel
tank, which was 3-m wide, 6-m long, and 1.2-m deep, was used to conduct the SVE
experiment. They observed a reduction in the gasoline removal rate with time as
the more volatile components were removed. An increase in the CO2 concentra¬
tion in the effluent air was also observed, indicating some biological degradation of
the contaminants. A 30% reduction in the vapor flowrate after 6 days of venting
reduced the gasoline removal rate by about 50% indicating that equilibrium condi¬
tions existed. The more volatile paraffin components of gasoline (i.e., pentane and
hexane) were removed more easily than the aromatics during the 11-day extraction
period.Marley and Hoag (1984) used a bench scale plexiglass column to examine the
effects of media density, moisture content, solid particle size, and air flow rate on the
removal of gasoline. They observed local equilibrium between the vapor phase and
the residual phase regardless of the air flow rate or other column conditions. The
mass loss rate declined very rapidly and leveled off. No mass transfer or diffusion
limitations were observed. The equilibrium model developed by the authors agreed
2.5 Previous Laboratory Research
Large circular columns, 0.91-m diameter by 3.05-in high, were used by Rain¬
water et al. (1989) to remove a four-component hydrocarbon mixture by SVE.
Equilibrium between the vapor phase and the liqviid phase was not observed in
their experiments during the 15-month operational period. An equilibriiun model
did not satisfactorily predict the removal of the components in the columns. A
diffusion-controlled model was able to describe the data with good agreement by
using curve-fitting methods. The authors noted that short-circuiting of air flow
in the colvmins may have caused the low removal rates observed as well as the
non-equilibrium conditions.
Lingineni and Dhir (1990) developed a one-dimensional non-isothermal model
to predict temperature variations and contaminant removal in a rectangular 60-cm
long plexiglass colimin. They observed significant temperature reductions in the
column as ethyl alcohol was evaporated from glass beads. Equilibrium between
phases was apparent. The specific discharges used during the experiments were
much higher than that which could be expected in an actual SVE application (15
cm/s). They concluded that considerable decreases in soil temperature could cause
condensation of water in incoming air during the SVE process, thereby lowering the
removal rates.
Gierke et al. (1990) performed a set of laboratory experiments in order to vali¬
date a mathematical model, which predicted the removal of contaminants dissolved
in the aqueous phase by SVE. The model was used to examine the impact of air
advection, gas diffusion, sorption, and air-water mass transfer on SVE performance.
In dry soils, gas advection and diffusion had the greatest impact on contaminant
removal. In wet aggregated soils, the presence of moisture decreased the removal
rate because of intraiaggregate diffusion limitations.
In summaxy, the small number of experiments conducted to study the SVE
2.5 Previous Laboratory Research
by some of the investigators, while others observed mass transfer and/or diffusion
limitations. The mathematical models developed to predict experimental data have
not been used on a field scale. There is some general understanding of the processes
that seem to have the most effect on SVE performance, but more experimental
3 Fate and Transport of VOC's in the Unsaturated Zone
3.1 Introduction
Since the major impetus of SVE is to remove volatile organic chemicals (VOC's)
present in the unsaturated (vadose) zone, it is important to have some understand¬
ing of how the various natural processes affect the fate and transport of organic
contaminants in this region. SVE systems remove contaminants present in the va¬
por phase, so it is important to understand how the various processes affect the
partitioning of VOC's to this phase. If the VOC concentrations in the vapor phase
are too low, it may not be economically or technically feasible to use SVE for sub¬
surface restoration.
Mathematical modeling of the transport of contaminants in the vadose zone
during the SVE process can aid in the design and operation of SVE systems. Sev¬
eral researchers have developed models to describe multiphase flow and transport of
organic chemicals in the subsurface (Pinder and Abriola, 1986; Parker et al., 1986;
Corapcioglu and Baehr, 1987; Abriola, 1988; Sleep and Sykes, 1989; Mayer and
Miller, 1990a, 1990b). Sleep and Sykes included advective gas transport (SVE) in
their model, but the NAPL (non-aqueous phase liquid) phase was assumed to be im¬
mobile. Volatilization and gas-aqueous phase partitioning were incorporated in the
model using a simple mass transfer expression. Mayer and Miller (1990a, 1990b) pre¬
sented a general multiphase model that included three mobile fluid phases, species
transport, and rate-dependent interphase mass transfer among all phases.
Very few models have been developed specifically to simulate the SVE process.
Most of the models described in the literature assume that local equilibrium exists
3.1 Introduction
and Hoag, 1984; Stephanatos, 1990). Lingineni and Dhir (1990) presented a non-isothermal model to predict the performance of SVE systems. Rainwater et al (1989) developed a diffusion-controlled model to describe the removal of contaminants
when there are diffusion limitations in the subsurface.
In this chapter, equations describing the transport of contaminants in the un¬
saturated zone during SVE are presented to better tuiderstand the fundamental
processes involved. This formulation includes development of the compressible gas flow equation based on Darcy's Law. A simple equilibrium model, which was used to model the experimental data obtained during this research, is also formulated.
3.2 Contaminant Transport in the Subsurface
Contaminants (VOC's) are usually introduced into the subsurface as a sepa¬ rate non-aqueous phase liquid (NAPL) or in an aqueous solution (Corapcioglu and Baehr, 1987; Sleep and Sykes, 1989). The contaminant may comprise one single constituent (e.g., benzene or TCE) or a mixture of many constituents (e.g., gaso¬ line). For instance, leaded gasoline contains over 180 different compounds (Sanders and Maynard, 1968).
If the contaminants are released in large enough quantities, they will be trans¬ ported mostly by bulk advective flow. The general direction of flow will be down¬ ward in response to gravity, but the porous media will cause lateral spreading of the contaminants due to mechanical (kinematic) dispersion (Marsily, 1986). As the contaminant moves through the unsaturated zone, a significant amount of the total
mass may be retained by capillary forces. If the contaminant is in the form of a
NAPL, then interfacial forces acting between the air phase or aqueous phase and
NAPL will cause residual "blobs" to be formed in the soil (Powers et al., 1991).
3.2 Contaminant Transport in the Subsurface
If all of the contaminant mass is not transformed into residual sattiration or
no impermeable strata are encountered, then VOC's will reach the saturated zone (water table). If the contaminant is in the form of a NAPL, its further movement will be governed largely by its density relative to water (Pinder and Abriola, 1986). If the NAPL is less dense than water (e.g., gasoline) it will tend to form a sep¬ arate layer on top of the groundwater surface and will be further trajisported in the same general direction as the groundwater flow. NAPL's denser than water (e.g., trichloroethylene) will continue to move down through the aquifer until an impermeable zone is reached.
The VOC's remaining in the unsaturated zone after bulk flow ceases can occur
in one of four phases:
(a) a separate NAPL phase,
(b) a sorbed phase on soil particles, (c) a dissolved (aqueous) phase, or (d) a vapor phase.
The various constituents of the contaminant wiU partition among the different phases present in attempts to reach equilibrium. The degree of partitioning of a specific VOC among these four phases will depend to a large extent on the volatility and water solubility of the VOC, the solid phase moisture content, and the type of
solid phase present (Silka, 1988). The partitioning into the vapor phase is of utmost
importance to the effectiveness of the SVE process.
3.3 Processes Affecting VOC Fate and Transport
3.3.1 Overview
3.3 Processes Affecting VOC Fate and Transport
(Sleep and Sykes, 1989). In addition biodegradation, vapor phase diffusion, and sorption can also be important. The extent and persistence of VOC's in the un¬ saturated zone will be highly influenced by the rate of volatilization to the vapor phase and dissolution to the aqueous phase.
As previously mentioned, since SVE removes contaminants present in the vapor phase, it is important to understand how the various processes affect the presence of compounds in this phase. The processes that are most important in regards to SVE are volatilization, gas-aqueous phase partitioning, and vapor phase diffusion.
3.3.2 Gas-Aqueous Phase Partitioning
Partitioning between the VOC's in the vapor phase and VOC's dissolved in the aqueous phase can be an important process in the unsaturated zone. Gas-aqueous phase partitioning, volatilization of VOC's from the aqueous phase to the vapor phase, is important to the SVE process only when a pure NAPL phase is not present in sufficient quantity (Hydro Geo Chem, 1990). If a NAPL phase exists, then most
of the contaminant mass in the vapor phase will be a result of volatilization from this phase.
Henry's Law is used to describe the equilibrium partitioning of VOC's between
the air and water phases (Corapcioglu and Baehr, 1987). This law states that the
partial pressure of a constituent above the aqueous phase is proportional to the concentration in the aqueous phase. In terms of the concentrations in both phases
at equilibritim, Henry's Law is
Cy* = H,Cr (1)
where C"* is the equilibrium concentration of component i in the vapor phase,
3.3 Processes Affecting VOC Fate and Transport
dimensionless Henry's constant. The Henry's constant can be estimated to a first
approximation using the vapor pressure and the solubility of the VOC in water
(Thibodeaux, 1979).
3.3.3 Volatilization from NAPL Phase
Volatilization, the mass transfer of a compound from a pure phase to the vapor phase, can be the dominant process affecting the fate and transport of immobile VOC's in the unsaturated zone (Sleep and Sykes, 1989). In situations where a pure
NAPL phase exists, the volatilization process controls the overall partitioning of the VOC's among the phases present.
The volatilization rate is highly dependent upon the vapor pressures and mole fractions of the compounds present. Assuming that the NAPL is in equilibrium with the vapor phase and behaves as an ideal solution, the vapor pressure of each
component can be expressed by Raoult's Law as
py = XiPy* (2)
where P" is the vapor pressure of component i [F/L^], Xi is the mole fraction of i in
the liquid phase [mol/mol], and P"* is the vapor pressure above pure liquid i [F/L^]
(Barrow, 1973). By applying the ideal gas law, the estimated total contaminant
vapor phase concentration in equilibrium with a pure NAPL mixture is given by
nv* _ V^ XiPy*Mi
3.3 Processes Affecting VOC Fate and Transport
temperature [°K] (Johnson et al., 1990). For example, the total vapor phase con¬ centration above pure gasoline is approximately 1300 mg/^.
The mass transfer rate from a pure liquid phase to the vapor phase is a func¬
tion of the concentration gradient (driving force) and the interfacial area between the two phases (Sherwood et al., 1975). Raoult's Law predicts the maximiun vapor
phase concentration that may exist just above the NAPL at equilibrium, which is the upper limit to the concentration difference in the driving force expression. One of the fundamental principles behind the SVE process is to lower the vapor phase concentration in the bulk air phase in order to provide the maximum concentra¬ tion gradient and thereby maximize the volatilization rate. Mass transfer will be discussed in more detail in Section 3-5 during the development of the contaminant
transport equations.
3.3.4 Vapor Phase Diffusion
The diffusion of VOC vapors in the subsurface air can be an important mecha¬ nism for contaminant transport if moisture content is low and the media is perme¬ able (Baehr, 1987). The diffusion process can cause the spreading of contamination
in the subsurface, thereby increasing the potential for further groundwater qual¬ ity problems. Since the vapor phase diffusion coefficients of VOC's are orders of magnitude higher than the aqueous phase diffusion coefficients, vapor diffusion will dominate over liquid diffusion and will serve as the primary transport mechanism within the vadose zone and from the vadose zone to the atmosphere as long as bulk advective flow is not occurring (Bruell and Hoag, 1984).
The steady-state diffusive flux in the imsaturated zone can be expressed by
Fick's First Law:
3.3 Processes Affecting VOC Fate and Transport
where J is the contaminant vapor flux through the media [M/L^T], D^ is the ef¬
fective diffusion coefficient in the media [L'^/T], and dC/dx is the concentration
gradient in the air phase [M/L^] (Peterson et al., 1988; Roy and Griffin, 1990). The
effective diffusion coefficient £>e is a function of chemical diffusivity in the bulk air
phase, moistiure content, and media porosity. The diffusion coefficient in porous
media (-De) is less than the diffusion coefficient in bulk air {Da) [L^/T] due to the
obstructed movement caused by the tortuous nature of the air-filled pores.
Milling-ton and Quirk (1961) developed an empirical relationship between the two diffusion
coefficients
10/3
D, = Da^-^ (5)
where
€
„ is the volume fraction of the soil occupied by the air phase [L^/L^] and n is
the porosity or void fraction of the porous media [L^/L^]. As the moisture content
of the media increases, the effective diffusion coefficient decreases along with the
vapor flux through the soil.
Experiments conducted by Wickramanayake et al. (1989) showed that the
diffusive transport of hydrocarbon vapors was indeed reduced by the presence of
moisture in the soil. They observed that the diffusion of the more water soluble com¬
pounds was retarded more than the less soluble ones. In addition, they concluded
that as the vapor phase concentration increased, vapor transport was controlled by
both diffusion and density-driven flow.
In regards to SVE, the diffusion of VOC vapors out of the contaminated zone
into the regions of advective air flow can limit the removal rate of contaminants
(Hutton, 1990; Rainwater et al., 1989). Concentration gradients can form between
the preferential air flow paths and the stagnant zones containing NAPL thereby
3.4 Compressible Flow Equations
3.4 Compressible Flo^w Equations
Flow models can aid in the design of SVE systems and in determining the
vapor flowrates and directions in the subsurface. The advective flow of air in the
soil during the SVE process can best be modeled using equations for compressible
fluid flow. The differential equations governing compressible flow are nonlinear due to gas density dependence on pressure. It has been suggested that due to the small
pressiire drops encountered in most SVE installations, groiuidwater flow models
may be used to approximate vapor flow (Massmann, 1989).
The basic equation describing the flow of water was developed by Henri Darcy
in 1856. Darcy determined empirically that the flow of water through a sand filter
was proportional to the hydraulic gradient (head loss) across the filter, and the total
cross sectional area. Darcy's law for saturated flow can be expressed as
Q = -KA^ (6)
where Q is the volumetric flux through the porous medium [L^/T], A is the cross sectional area [L^], dh/dl is the hydraulic gradient [L/L], and K is the constant
of proportionality known as the hydraulic conductivity of the porous media [L/T] (Marsily, 1986). Darcy's law is sometimes written in the form
where qi is the specific discharge or filtration velocity [L/T] in the direction i. The intrinsic permeability k [L'^], which is independent of the fitiid characteristics, is
3.4 Compressible Flow Equations
K=^ (8)
where p is the density of the fluid [M/L*], g is the acceleration due to gravity [L/T^],
and fi is the dynamic viscosity [LT/M]. A more generalized form of Darcy's law that is valid for both steady and unsteady flow of compressible fluids is
where kij are the components of the intrinsic permeability tensor, p is the fluid presstire, and z is the elevation above a reference datum [L] (HuyaJcom and Pinder, 1983). For the condition where the coordinate system is aligned to match the prin¬
cipal directions of the intrinsic permeability tensor, equation (9) can be expressed
as
ki f dp dz\ ,,-.
where i corresponds to the x, j/, and z directions.
In order to obtain the governing equation for the flow of compressible fluids in porous media, equation (10) must be combined with the mass continuity equation
of the form
d{qip) _ d{np)
di dt
If the compressibility of the porous mediimi can be neglected the continuity equation
becomes
-ͣ^^PB?9^!^
3.4 Compressible Flow Equations Substituting equation (10) into the continuity equation (12) yields
d_
di
kip f dp dz
H \di oi
-I (")
which is the general form of the equation for compressible flow in porous media.
If the compressible fluid can be considered to obey the ideal gas law, then
For isothermal conditions, the relationship between gas density and presstu:e can be expressed as
^ = ^^ ri5)
dt RT at ^ ^
Substituting equations (14) and (15) into equation (13) and neglecting the effect
of gravity, the equation for compressible flow becomes
d_
di
Equation (16) can also be written in the form
d
d
'i\li dij~ P dt ^ ^
where u—P^.
3.4 Compressible Flow Equations
di\di) \kp) dt ^ '
which can also be expressed as
72 d2 ^ 2n/x dP
^ ^ = -TW <!«>
For the case where the void space contains more than one phase (i.e. aqueous, NAPL, or air), n in equation (19) is replaced with Ca, the volume fraction of the porous media occupied by the air phase (ca < n). Assuming that ta remains constant and only the air phase is mobile, equation (19) can be used to model
the advective flow of air as in SVE systems. If the saturations of the NAPL and aqueous phases are relatively high and these phases flow along with the air phase, then k must be multiplied by the relative permeability. The relative permeability is the ratio of the effective permeability of a particxilar fluid phase to the absolute permeability k. The relative permeability kr is dependent on the fluid saturations
of the phases present (Craft and Hawkins, 1959).
3.5 Contaminant Transport Equations
3.5 Contaminant Transport Equations
The equations describing multiphase flow and transport axe derived from the mass balance and momentum balance equations. The mass balance on species i in phase a produces the equation
^ (6„^«a;n + V • (e^p'^urx-) - V • Jf = 5.? + JJf (20)
where v° is the mass average velocity of the oc phase [L/T], uf is the mass fraction
of species i in the a phase [M/M], e^ is the volume fraction occupied by the a phase,
p°' is the mass density of the a phase [M/L^], Jf is the non-advective transport of
i in the a phase [M/L^T], Sf is the exchange of mass of species i due to interphase
diffusion or phase change [M/L^T], and Rf represents an external source of species
i to the a phase [M/L^T] (Abriola, 1988).
The first term on the left-hand side of equation (20) accounts for the accumu¬
lation of species i in the a phase, while the second term accounts for the movement of mass due to the advective flow of the a phase. The third term represents move¬ ment of i due to non-advective transport (i.e dispersion and molecular diffusion). The terms on the right-hand side of equation (20) represent source or sink terms due to change of phase (i.e., interphase mass transfer) and chemical or biological
transformations respectively.
In order to describe the flow and transport of a single contaminant component i, a mass balance equation must be written for each phase in which species i is present. Typically the phases in which a species may be associated with are a solid phase, an aqueous (water) phase, a vapor phase, and a non-aqueous phase liquid (NAPL) phase. These phases are represented by the letters s, w, v, and n in the
transport equations.
If species i is present in the vapor phase, then the mass balance equation for
3.5 Contaminant Transport Equations
^ (p^e^ujV) + V • (p^e^vX) - V . J^ = 5^ + i^r (21)
Similaxly, if i is present in the NAPL, aqueous, and solid phases then the mass balance equations for these three phases are respectively
^ ip"e„u?) + V . (p"e„v"a;r) - V • Jf = 5." + R? (22)
^ (p'^e^ur)+V • {p^e^x^uT) - V. jr = sr+rt m
^ ^ (^^e,a;f) + V • (p%vX) - V • J^ = 5; + i2f (24)
In order to model the transport of species i in the subsurface for non-equilibrium conditions, all four mass balance equations must be solved simultaneously, along with a coupled set of flow equations. One flow equation is needed for each mobile phase—typically the aqueous, vapor, and NAPL phases.
If most of the contaminant mass in the unsaturated zone is associated with the
NAPL phase and the vapor phase, then equations (23) and (24) can be eliminated. Assuming that the NAPL phase is immobile, diffusion of species i within the NAPL
phase is negligible, and no appreciable degradation occurs, equation (22) reduces
to
3.5 Contaminant Transport Equations
Assuming that diffusion within the vapor phase is minimal in comparison to ad-vective vapor flow and no degradation of contaminants occurs in the vapor phase,
equation (21) becomes
^ {p^e^uV) + V • (p*'e„v V) = •5." (26)
Equation (25) states that the change in mass of species i in the NAPL phase is due
only to interphase mass transfer. Since the mass of i lost from the NAPL phase
must be gained by the vapor phase,
S^i =-8"^ (27)
Since advective flow is assumed to occur only in the vapor phase, the rate of mass transfer from the NAPL to the vapor phase is the step that determines the time required for contaminant removal in this instance.
An expression must be derived to describe the interphase mass transfer term 5". There are many theories that have been proposed to describe the mass transfer
process. The simplest theory used to describe interphase mass transfer is known
as the stagnant film theory (Sherwood et al., 1975). This theory assumes that
a stagnant film layer between the interface of the two phases provides the only resistance to mass transfer. The mass transfer of species i through the stagnant
film layer can be written as
J." = JCL(ACi) (28)
3.5 Contaminant Transport Equations
difference of i across the phase boundary [M/L^]. According to the stagnant film
theory, the mass transfer coefficient Ki is dependent on the diffusion coefficient of component i in the vapor phase and the thickness of the stagnant layer /.
The stagnant film theory is known to be a poor model of the actual mass trans¬
fer from a NAPL to a vapor or aqueous phase (Miller et al., 1990b). However, the
general first-order formulation with a linear driving force is an adequate representa¬ tion, which results from more conceptually satisfying formulations. The key point is that Kl is a function that is dependent upon the physical and chemical properties
of the system vmder consideration. It must be determined by experimentation or estimated from literature correlations that account for the physical and chemical
properties of the system.
Assuming that equilibrium exists at the boundary between the two phases present, equation (28) becomes
J^=KL{Cr-Cn (29)
where Cf* is the saturated vapor concentration of component i in the vapor phase
and Ci is the bulk phase concentration. In order to use equation (29) in the mass
balance equations in place of the interphase mass transfer term 5", Ki must be multiplied by the volume fraction of the vapor phase and the specific surface area
a. The resulting expression used to describe the mass transfer term is
Sy = KLae,(Cr-Cy) (30)
where a is defined as the interfacial surface area between the two phases per volume
of porous media [L^/L^]. As discussed by Miller et al (1990b), the value of a is
3.5 Contaminant Transport Equations
NAPL/vapor interface. Also, in the case of SVE the value of a will change with time as the mass of NAPL is reduced.
The concentration of species i in the a phase can also be expressed as
cr = p"u;r (31)
Substituting this expression for the concentration terms in equation (30) gives
SV = KLae,(p''ujr-p''^^) (32)
The mass balance equation for the vapor phase, equation (26) , becomes
^ (/e„u;n + V • (p^'e^y^'uV) = Kiae^ (p^ur - P^oj^) (33)
Similarly, the mass balance equation for the NAPL phase becomes
^ (p^enu?) = -Kiae, (/u;."* - /a;.") (34)
Equations (33) and (34) must be solved simultaneously to model the transport of component i in the unsaturated zone during the SVE process.
In order to solve the system of mass balance equations presented above, an expression must be derived for the mass average velocity of the vapor phase, v", which satisfies the momentum balance. If the vapor phase is the only mobile phase present then the mass average velocity can be expressed by
3.5 Contaminant Transport Equations
where k„ is the intrinsic permeability tensor for the vapor phase, P" is the vapor
phase pressure, and the other terms are as previously described (Bear, 1979).
Prom equations (33) and (34) it can be observed that some expression must
be developed to account for the change in NAPL mass and volumetric fraction with time as the SVE process proceeds. This is not a trivial task owing to the fact that the NAPL mass is usually distributed heterogeneously as individual blobs
in a wide range of shapes and sizes (Mayer and Miller, 1991). Changes in NAPL
mass will affect the rate of mass transfer to the vapor phase since the interfacial area between the phases will change. Some researchers have attempted to solve this transient problem for the case of NAPL dissolution by water in the satiirated zone by assuming that the NAPL mass is uniformly distributed as spherical blobs and using a complex scheme to keep track of changing blob size and interfacial
area (Powers et al., 1991). In addition, the reduction in the volumetric frax:tion of
NAPL can cause an increase in the mass average velocity with time. The intrinsic permeability of the porous media will increase as a larger fraction of the pore space
is available to advective air flow.
3.6 Vapor-Liquid Equilibrium Model
SVE can best be modeled using the differential equations for contaminant trans¬ port in the unsatvirated zone. Due to the detailed information on subsurface con¬ ditions required to use these models, a more simplified approach can be used as a first-cut approximation. As mentioned in section 3.1, several researchers have
developed simple equilibrium-based models to predict contaminant removal during
the SVE process. Predicted removal rates based on equilibrium models usually
represent the best case scenario for contaminant removal in the subsiu-face.
The key assumptions used in the development of the vapor-liquid equilibrium
3.6 Vapor-Liquid Equilibrium Model
• local equilibrium exists between the vapor and the NAPL phase; • the NAPL is distributed uniformly in the porous media;
• air flow is uniform across the entire porous media cross section; • the NAPL mixtiire behaves as an ideal solution;
• degradation is negligible; and
• the effluent air is saturated with vapors from all components present in the
NAPL.
Because the mass transfer rates from pvire VOC liquids are very high as com¬ pared to the pore velocities, the local equilibrium assumption seems to be valid for
many situations. Johnson et al. (1990) estimated that the soil air becomes satu¬
rated and reaches equilibrium within a distance of 0.2 cm from the NAPL surface at
a pore velocity of 1 cm/s. If the NAPL is not distributed uniformly and preferential
air flow paths are formed, then contaminant removal rates may be overestimated using the vapor-liquid equilibrium model.
The differential equation used to axicoimt for the molar removal of a single NAPL constituent is
^ = -QCr (36)
where Ni is the total number of moles of component i [mol], Q is the volvmietric
vapor flowrate [L^/T], and C"* is the equilibrium molar concentration of i in the
efiluent vapor [mol/L^]. The equation used to calculate Cf* for any component at
time t , which is obtained by combining Raoult's Law and the Ideal Gas Law, is
3.6 Vapor-Liquid Equilibrium Model
where Xi, Pi*, R, and T axe as previously defined. When P-"* is expressed in atmospheres and T in degrees Kelvin, equation (37) becomes
Cr= 12.180^^^ (38)
where C"* is the concentration in moles per liter.
A finite difference approach can be used to approximate equation (36) . Us¬ ing an implicit method to approximate the time derivative, the finite difference algorithm for equation (36) is
Nl+^t = Nl - AtQ^^ (39)
where At is the time step [T], and Xi is evaluated at time t. The mole fractions of all
constituents are updated after each time step. The new mole fraction of component
i after the time step At is determined from
where Nt is the total number of moles of contaminaxit remaining in the porous media. The mole fractions of the less volatile components increase with time.
The total mass removal rate at time t for a NAPL containing Uc components
is
Rm = QE^^^ (41)
where Rm is the total mass removal rate [M/T]. The total mass removal rate declines with time, when more than one constituent is present, due to the decrease in total
4 Materials and Methods
4.1 Introduction
Two different columns were used to conduct SVE experiments in the laboratory. Both columns were designed and built in the School of Public Health shop facilities at the University of North CaroUna. Several experiments were conducted in each
colunm.
The primary purpose of each experiment was to determine the concentration of orgaxdc chemicals in the vapor phase as a function of time. In the large column, temperature and air pressure were measured as well. The parameters varied between experiments included vapor flowrate and residual contaxninant composition. Vapor
flowrate and contaminant removal was induced in both columns by using pressurized nitrogen gas. Glass beads served as the porous media in all experiments.
Experiments to measvire the mass transfer coefficient of toluene from a pvu-e liquid to the vapor phase were also conducted. A small square glass column was
used for these experiments.
4.2 Vapor Extraction Columns
4.2.1 General
The two coltimns used for SVE experiments were a round glass column and a much larger stainless steel column with a square cross section. The stainless
steel column allowed for monitoring of temperature and pressure inside the column
during an experiment. These two parameters could not be measured when the glass
4.2 Vapor Extraction Columns Both colunms were packed with glass beads in the size range of 0.25 mm to 0.425
mm in diameter (McMaster-Carr, Dayton, New Jersey). Natural porous media particles in this diameter range are classified as medium sand (Leeder, 1982). The bulk volume, porosity, and other parameters for both columns are stmimarized in
Table 1.
Purified grade nitrogen gas from a pressure regulated tank was used in both columns to remove the contaminant vapors and induce the volatilization process.
Nitrogen flowrates into the columns were measured with a glass rotameter (Gilmont
Industries, Great Neck, New York).
Table 1. Column Characteristics
Parameter Stainless Steel Glass
Bulk Media Volume 15.80 i 1.85 i
Pore Volume 6.57 £ 0.72 i
Porosity 41.5 % 38.6 %
Mass of Glass Beads 24.07 kg 2.85 kg
Column Length 63.5 cm 30.0 cm Cross Sectional Area 249.0 cm^ 62.0 cm2
4.2.2 Stainless Steel Column
The larger and more versatile column used in conducting laboratory experi¬ ments was manufactured from a stainless steel sheet formed into a 15-cm by 15- cm
4.2 Vapor Extraction Columns
Column 11 Effluent
Stainless Steel Column w/ Glass Beads
Vapor Sampling Ports
N^ In
Flowmeter
Thermocouples
Pressure S
Temp. Port
3.2 mm Stainless Steel
Tubing
Inlet Screen Outlet Screen
Pressure &
Temp. Port
Flowmeter Carbon Sampling
Tube
Figure 2. Stainless steel column apparatus.
4.2 Vapor Extraction Columns Pressure transducers (Omega Engineering) were installed in each end cap to monitor the pressure drop across the column. Column presstires were measured with an Omega DP2000 electronic pressure gauge, which was connected to the presstnre
transducers.
The colvimn was operated in the horizontal position during an experiment for
two reasons. By placing the column in the horizontal position, it was hoped that
the distribution of contaminant would become more uniform. Secondly, because of the possibility of vapor leaJsage from the column, it was important that the entire apparatus be placed under the laboratory exhaust hood.
4.2.3 Glass Column
A glass colvuim was used for conducting experiments on a smaller scale before using the larger column. Because of its smaller capacity, the duration of an ex¬ periment was much shorter in the glass column as compared to the stainless steel colunm, reducing the nitrogen requirements significantly.
The glass column was constructed from a 42-cm long section of 8.9-cm diameter glass tube (Figure 2). The Teflon end caps of the column were designed to create a more uniform vapor flow through the cross section. Approximately 75% of the total colunan volume was packed with glass beads before conducting experiments. The glass column was operated in the vertical position since it was not completely filled with glass beads.
4.3 Chemicals
The compoxmds used to residuaUy saturate the glass beads, toluene (methyl-benzene) and xylene (dimethyl(methyl-benzene), are classified as aliphatic-aromatic hydro¬ carbons (Morrison and Boyd, 1973). These two compounds are insoluble in water,
4.3 Chemicals
^2
TANK
COLUMN EFFLUENT
CARBON SAMPLING TUBE
-GLASS COLUMN W/ GLASS BEADS
FLOW
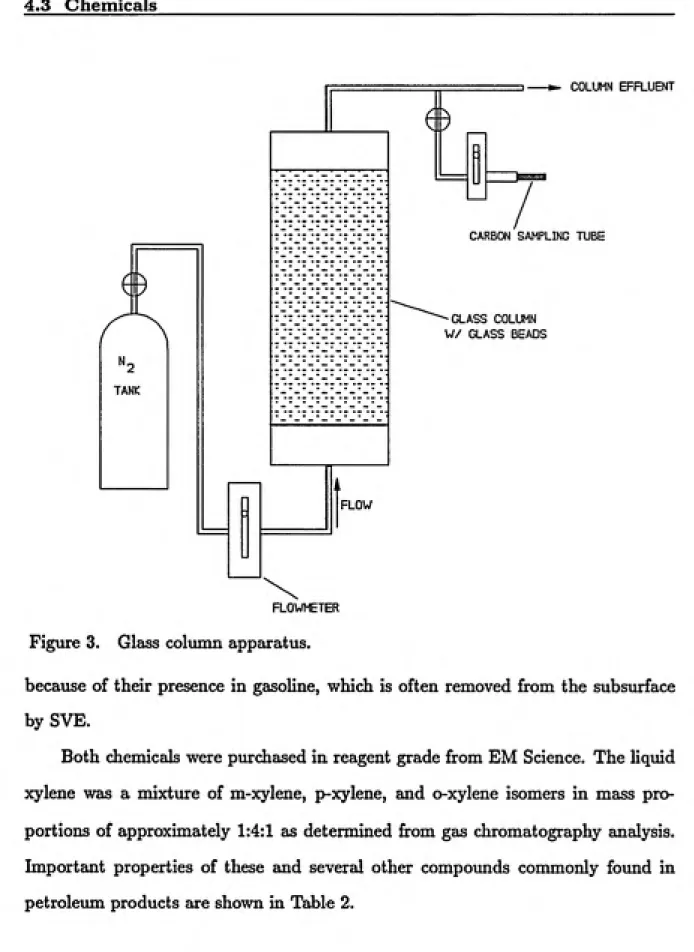
FLOWMETER Figure 3. Glass column apparatus.
because of their presence in gasoline, which is often removed from the subsurface by SVE.
Both chemicals were purchased in reagent grade from EM Science. The liqtiid xylene was a mixture of m-xylene, p-xylene, and o-xylene isomers in mass pro¬ portions of approximately 1:4:1 as determined from gas chromatography analysis. Important properties of these and several other compoiuids commonly found in
4.3 Chemicals
Table 2. Properties of Conmaon Petroleum Product Components
Compound Vapor Boiling Aqueous Molecular Pressure Point Solubility Weight
(atm) (°C) (mg/^) (g/mol)
isopentane 0.78 28 48.0 72.2
n-pentane 0.57 36 40.0 72.2
n-hexane 0.16 69 13.0 86.2
benzene 0.10 80 1780.0 78.1
n-heptane 0.046 98 3.0 100.2
toluene 0.029 111 515.0 92.1
n-octane 0.014 126 0.7 114.2
p-xylene 0.0086 138 198.0 106.2
m-xylene 0.0080 139 162.0 106.2
o-xylene 0.0066 144 175.0 106.2
dimethyl- 0.0007 190 21.0 134.2
ethylbenzene
(from Johnson et al., 1990)
Carbon disulfide was used to desorb the contaminant mass adsorbed by the carbon sampling tubes during vapor phase sampling. The reagent grade carbon disulfide was purchased from Fisher Scientific.
4.4 Vapor Phase Sampling and Analysis
The most important parameter measured during the course of an experiment was the vapor phase concentration of the compound(s) present. The carbon ad¬
'o'ms^'
4.4 Vapor Phase Sampling and Analysis
Sorbent air sample tubes containing activated carbon (SKC, Inc., Eighty-Four, Pennsylvania) were used to sample the effluent vapors of both colvimns. These sample tubes contained two separate sections of caxbon, 100 mg in the front section and 50 mg in the rear section. Sampling times were kept as short as possible to prevent the breaJsthrough of organic vapors to the rear section of the sampling tube. Typical sampling times ranged from 2 to 5 min. A sampling flowrate of 30 m^/min
was used to insure complete adsorption of all vapors to the sample tubes. This flowrate was measured accurately using a flowmeter equipped with a micrometer
valve (Gilmont Instruments, Great Neck, New York).
In order to extract the contaminants adsorbed during sampling, the front GAC sections were removed from the sampling tubes and placed in air-tight 5 mi vials. The GAC was desorbed with 2 va£ of caxbon disulfide containing 2000 mg/£ of
benzene as an internal standard. The vials containing the activated carbon and
carbon disulfide were shaken for 30 min using a Lab-Line Instruments mechanical orbit shaker in order to insure complete desorption. Only a few rear sections of the sample tubes were desorbed to check for breakthrough. With the sampling times
used, breakthrough was never experienced in any of the caxbon tubes.
The carbon disulfide solutions from the desorption process were analyzed using a Hewlett Packard HP5890A gas chromatograph eqviipped with a flame ionization detector (Hewlett Packaxd, Avondale, Pennsylvania) and 30-m capillary column (J & W Scientific, Folsom, California). An oven temperature of 75°C was used along with a split ratio of 40:1. All compovmds of interest eluted out of the capillary
column in less than 5 min.
The equation used to calculate the concentration of compound i in the vapor
4.4 Vapor Phase Sampling and Analysis
C'V
C" = ^ (42)
where Cj is the concentration in the CS2 [M/L^], Vc is the volume of CS2 used for
desorption [L'], Qy is the vapor sampling rate [L^/T], and t is the sampling time
[T]. Cl was determined from GC analysis using the internal standard method and
an assumed desorption efficiency of 100%.4.5 Experimental Procedure
A similar experimental procediure was used for SVE experiments conducted in both the glass and stainless steel columns. Before beginning an experiment, the column containing dry glass beads was weighed before being completely saturated with a pure organic liquid. Either pure toluene or a mixture containing 50% toluene and 50% xylene by voltime was used to saturate the column. The columns were saturated while in the vertical position in order to leave as Httle trapped air behind as possible. The liquid was then allowed to drain out at a slow rate leaving behind a residual satinration in the glass beads. The mass of contaminant left behind was determined by re-weighing the colimin using a triple balance beam.
Instead of using a vacuum pump to remove the vapors from the porous media as is done in actual SVE systems, pure nitrogen gas from a presstire-regulated tank was used to induce flow. It was also easier to maintain a constant flowrate using pressurized nitrogen instead of a vacuum pump. Nitrogen gas was used instead of air in order to reduce the possibility of aerobic biodegradation during an experiment.
4.5 Experimental Procedure
of a vapor extraction well (Johnson et al., 1990). The vapor pore velocities were estimated from the equation
where v is the pore velocity [L/T], q is the specific discharge [L/T], Q is the volu¬ metric fiowrate of nitrogen [L^/T], n is the porosity of the glass beads, and A is the total cross-sectional area of the column [L"^]. The pore velocities used ranged from
0.40 to 2.90 cm/sec.
Once an experiment was begun, the column effluent was sampled at regular intervals in order to measure the change in vapor phase concentration with time. During the early stages of an experiment, the effluent was sampled more frequently since vapor phase concentrations changed more. In the stainless steel column, sys¬ tem temperatures and pressures were recorded as well. Nitrogen flowrate was mon¬ itored and adjusted when necessary in order to maintain a constant volumetric
flow. Most experiments were conducted until the effluent concentrations fell below
1 lag/i. The column was weighed after completing an experiment so the mass re¬ moval could be determined. In most experiments, >95% of all contaminant mass was removed by vapor extraction.
In order to remove the residual contaminant mass remaining in the glass beads after an experiment was completed, either nitrogen or air was flowed through the column for several days at low flowrates. When air was used, it was first flowed through a dessicant to remove any moistvire present. The column was weighed again to insure that the porous media was completely dry.
4.5 Experiihental Procedure
sampling times as the effluent concentrations decreased in order to improve sensi¬ tivity. It would have also been difficult to determine if a significant portion of the mass had been removed if the sampUng tubes were not analyzed during the course
of an experiment.