1
Characterization of two novel Proteobacteria isolated from contaminated soil and capable of degrading aromatic compounds
Elizabeth Corteselli
A technical report submitted to the faculty of the University of North Carolina at Chapel Hill in partial fulfillment of the requirements for the degree of Master of Science in Public Health in the Department of Environmental Science and Engineering.
Chapel Hill May 2016
Approved by:
___David Singleton___ David Singleton, PhD Research Assistant Professor, Advisor
___Michael Aitken___ Michael Aitken, PhD Professor & Chair, Reader
2 ABSTRACT
The previously uncultivated bacterial strains Ca6T and TR3.2T were isolated from an aerobic
bioreactor treating polycyclic aromatic hydrocarbon- (PAH-) contaminated soils collected from former manufactured gas plants in North Carolina. Stable isotope probing (SIP) of one of those soils had previously identified several undescribed, phylogenetically distinct groups of high-molecular weight (HMW) PAH-degrading bacteria, including “pyrene group 1” (PG1) and “pyrene group 2” (PG2), of which Ca6T and TR3.2T are members, respectively. Strain Ca6T is a
rod-shaped Betaproteobacterium belonging to the Rhodocyclaceae family, and strain TR3.2T could only be classified as a member of the class Gammaproteobacteria. Of the organic
compounds tested, both strains grew on a very limited number of common substrates. However, Ca6T was capable of growth on the PAHs pyrene and phenanthrene as sole sources of carbon, weak growth on benz[a]anthracene, and could transform anthracene and fluorene. TR3.2T
utilized several HMW PAHs as sole sources of carbon, including benz[a]anthracene and pyrene, as well as anthracene, fluorene, and phenanthrene. Neither strain possessed any close, cultivated relatives based on 16S rRNA gene sequence analysis. Based on this evidence, novel genera and species are proposed for each strain. The presence of highly similar environmental gene
3
ACKNOWELDGEMENTS
4
TABLE OF CONTENTS
List of tables………5
List of figures………..6
I. Introduction and Literature Review………….………7
A. Properties of Polycyclic Aromatic Hydrocarbons……….7
B. Microbial Degradation of PAHs………...…12
1. Growth Dynamics in Pure Culture and Soils………....…….12
2. Metabolism of Low Molecular Weight PAHs………...16
3. Metabolism of High Molecular Weight PAHs………..20
C. Applications to Bioremediation………23
II. Methods……….31
A. Cultivation of Ca6T and TR3.2T………31
B. Microscopy………34
C. Biochemical Testing. ………...35
D. Metabolism of Aromatic Compounds………...……38
E. Genome Analyses………..41
III. Results………..43
A. Strain Ca6T………43
1. Growth Characteristics and Physiology……….43
2. Metabolism of Aromatic Compounds………48
3. Genetics and Phylogeny……….52
B. Strain TR3.2T……….57
1. Growth Characteristics and Physiology……….57
2. Metabolism of Aromatic Compounds………61
3. Genetics and Phylogeny……….63
IV. Discussion………69
5
LIST OF TABLES
6
LIST OF FIGURES
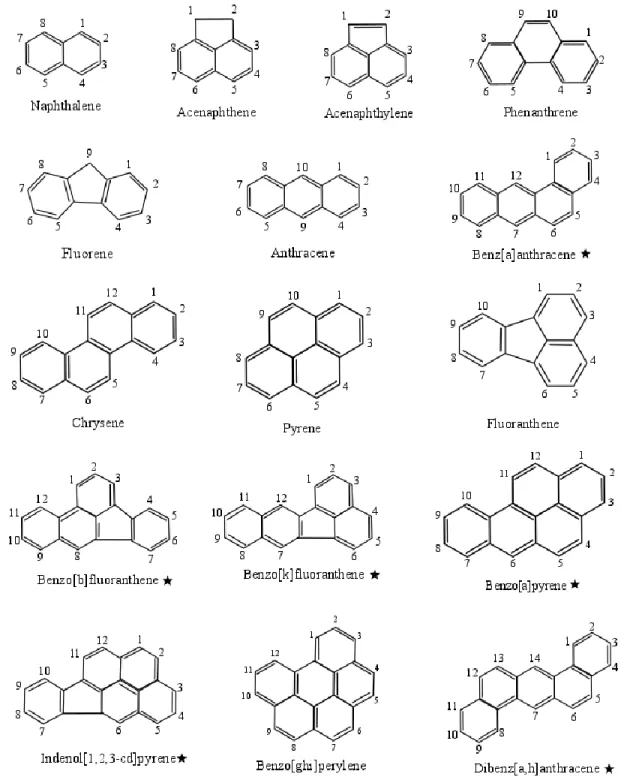
Figure 1. Structures of the 16 PAHs currently included on the EPA priority pollutant list Figure 2. The upper pathway of aerobic naphthalene metabolism
Figure 3. Location of radiolabeled carbons in PAHs used in mineralization assay Figure 4. Ca6T growth on differential medium
Figure 5. Temperature profile of Ca6T Figure 6. pH profile of Ca6T
Figure 7. Salinity profile of Ca6T
Figure 8. SEM and TEM micrographs of Ca6T Figure 9. Ca6T growth on pyrene and phenanthrene
Figure 10. Metabolism of benz[a]anthracene, anthracene and fluorene by Ca6T
Figure 11. Mineralization of radiolabeled PAHs by Ca6T
Figure 12. 16S rRNA gene neighbor-joining phylogenetic tree of Ca6T with type strains of the family Rhodocyclaceae
Figure 13. 16S rRNA gene neighbor-joining phylogenetic tree of Ca6T with uncultured environmental samples
Figure 14. TR3.2T growth on differential medium
Figure 15. Temperature profile of TR3.2T Figure 16. pH profile of TR3.2T
Figure 17. Salinity profile of TR3.2T
Figure 18. SEM micrographs of TR3.2T
Figure 19. TR3.2T growth on pyrene, phenanthrene, benz[a]anthracene, anthracene, and fluorene Figure 20. Mineralization of radiolabeled PAHs by TR3.2T
Figure 21. 16S rRNA gene neighbor-joining phylogenetic tree of TR3.2T with closest cultivated 16S rRNA gene relatives
7
I. INTRODUCTION AND LITERATURE REVIEW
Polycyclic aromatic hydrocarbon (PAH) contamination, particularly of high-molecular weight (HMW) and carcinogenic PAHs, is of public health concern. Bioremediation can be an effective method for PAH removal, however, microbial transformations of HMW PAHs are sometimes incomplete and may create toxic metabolites. A greater understanding of
environmentally-relevant microbes responsible for PAH degradation in natural and engineered systems may lead to increases in the efficacy of bioremediation. The aim of this study was to characterize two previously uncultivated bacterial strains that were isolated from aerobic bioreactor-treated, PAH-contaminated soil collected from former manufactured gas plants in North Carolina. Both strains were capable of growth on a variety of aromatics, including several HMW PAHs and BTEX compounds, and represent new genera and species of bacteria. The presence of highly similar environmental gene sequences to these strains at other contaminated sites worldwide suggests these organisms may be ubiquitous degraders of hazardous aromatic compounds. The study of these two strains lends insight to their growth on and metabolism of PAHs in an overall effort to improve the efficacy of bioremediation efforts.
A. Properties of Polycyclic Aromatic Hydrocarbons
8
PAHs with more than four rings, termed “high molecular weight” (HMW), tend to be even less soluble in water, less volatile, and more resistant to degradation (3, 4).
9
PAHs are produced from the incomplete combustion of organic matter, which can occur from both natural and anthropogenic sources (3). Natural sources of PAHs include forest fires, which provide an environment of low temperature and slow burning organic matter, and volcanic eruptions (1, 6, 7). Several studies have also suggested biological formation of PAHs is possible due to the presence of PAHs in pre-industrial sediments (8-10). Production of naphthalene has been observed by the fungus Muscodor vitigenus (11) and termites (12), and similar reports of perylene and phenanthrene production have been documented (13, 14). These natural PAH sources cause a background level of PAH contamination in soils (14). However, anthropogenic production of PAHs is by far the largest source of PAH emissions into the environment (1). This includes both pyrogenic PAHs, which originate from combustion of wood, coal, and petroleum, and petrogenic PAHs resulting from spills of oil or the spread of coal dust (15, 16). A prominent source of pyrogenic PAHs was manufactured gas plants (MGPs), which were used in the late 19th and early 20th centuries to produce gas for heating. This was accomplished through the slow burning of another organic fuel source, usually coal or oil. The resulting gas contained small impurities, including PAHs, which were removed and stored as waste products, termed tar, tar wastes, and asphalts. Improper storage and disposal of these wastes in some cases caused their release into surrounding soils and groundwater, resulting in PAH contamination. Pollution from MGPs is of particular concern due to their placement near city centers, which facilitated
10
proportion from wood burning for heating, and warmer countries, where PAHs originated mainly from traffic exhaust. Seasonal variations in PAH sources have also been observed (10, 14, 15).
Due to the wide variety of natural sources and industrial processes that are capable of producing PAHs as by-products, these pollutants have become almost ubiquitous in the environment. PAHs have been found in samples of air, soil, water, groundwater and marine sediments worldwide (4, 18, 19). Even formerly “pristine” environments, such as polar ice caps, have become infiltrated with PAHs at concentrations above the natural background over the last century (15). Concentrations of PAHs in the environment have been slowly increasing during this time, with a greater proportion originating from pyrogenic sources due to widespread automobile use (20). Although they are the main organic pollutants in air, the ultimate
environmental fate of most emitted PAHs is the soil (1). Concentrations in soils have been found ranging from 0.25 mg kg-1 to as high as 500 mg kg-1 (15). Once in the soil, PAHs can have one
of several fates: volatilization, adsorption to soil particles, leaching into groundwater, bioaccumulation, photolysis, chemical degradation, or microbial degradation (1, 3). Natural degradation by microbes is by far the most common mechanism of PAH removal from soils. The rate of removal is primarily determined by the availability of PAHs, but can also be influenced by properties of the soil (3). A study by Haeseler et al (21) at a former MGP site observed 80-100% removal of two and three-ring PAHs, 40-70% removal of four-ring PAHs and below 20% for five and six-ring PAHs after an aerobic biological treatment using indigenous flora. This study further found that while untreated soil leached PAHs into nearby groundwater, remediated soil had lost this ability.
11
of smoked or charred meats or use of tobacco products (19). PAHs in the soil might result in human exposure through accidental ingestion of soil particles, improperly cleaned vegetables, or leaching into groundwater (19, 22). In addition, several PAHs are intentionally used in
commercial products, such as pesticides, detergents, dyes, and mothballs (23). Once PAHs enter the body, they are acted on primarily by cytochrome P450 enzymes to form epoxides or phenols. These intermediate metabolites are then conjugated to water-soluble molecules, such as
glucuronides, sulfates, or glutathione, and then excreted in urine. However, the intermediate metabolites of some PAHs, particularly those with bay or K regions, are extremely reactive. Bay regions are formed from a U-shaped cluster of aromatic rings, an example of which can be seen between carbons 4 and 5 of phenanthrene (Figure 1). K regions are areas of high electron density that are metabolized to form reactive intermediates, an example of which is the 9,10 position of phenanthrene (Figure 1) (24). Buildup of these reactive metabolites in cells can cause both genotoxic and cytotoxic effects (23, 25). The National Toxicology Program’s (NTP) 2014 Report on Carcinogens classified 15 PAHs as “reasonably anticipated to be human carcinogens”. This list included many HMW PAHs, such as benz[a]anthracene and benzo[a]pyrene (5) . One epidemiological study by Mastrangelo et al (25) found a dose-dependent relationship between lung and bladder cancers and PAH exposure in an occupational setting. Other toxic effects besides carcinogenicity have been reported following exposure to PAHs, including
12
25, 26). Due to their potential adverse health effects and prevalence in the environment, 16 PAHs have been classified by the EPA as priority pollutants (28). Six of the PAHs included on this list were also classified as human carcinogens by the NTP (indicated by stars in Figure 1) (5). It is therefore of much interest to investigate effective and economical remediation strategies for these compounds.
B. Microbial degradation of PAHs
Several types of bacteria are capable of naturally degrading PAHs, and many of these organisms have been well studied. Due to their natural abundance in contaminated soils and sediments, bacteria are often the focus of bioremediation efforts at these sites (1). Historically, strains capable of transforming or growing on PAHs have been isolated for further study in the laboratory. Much of the information regarding bacterial PAH metabolism is from such studies.
1. Growth Dynamics in Pure Cultures and Soils
Isolation and cultivation in the laboratory have been successful for many strains of
bacteria capable of utilizing PAHs as sole sources of carbon and energy (e.g. references (29-35)). Strains grown on PAHs in pure, liquid cultures display characteristic growth curves (36).
13
and algae, bacteria utilize intracellular enzymes for PAH metabolism (1, 3). PAHs must first be taken up by bacterial cells before they can be metabolized. Dissolution of the PAH is therefore a critical factor in determining the availability of substrate and the rate of growth (3, 38).
Growth dynamics of pure cultures on PAHs have been studied extensively in the
laboratory. This creates an idealized situation where bacteria have almost unlimited access to the substrate in a homogeneous liquid solution (2, 39). However, soil provides a much different environment for PAH degradation. Soils are heterogeneous mixtures that contain many carbon sources and complex microbial communities. PAH-degrading bacteria are therefore not limited to growth on PAHs alone, nor are they the only organisms in the soil capable of acting on PAHs. Cometabolism, or the degradation of one substrate while growing on another substrate, has been recognized as an important process in soils during bioremediation (40-45). This process allows organisms to only contribute to certain steps of the degradation process. Dead end metabolites produced by one organism may then be acted on by another (45). In addition, non-specific fungal exozymes in the soil are more likely to encounter PAHs than intracellular bacterial enzymes (46). Consortia of microbes can work together in this manner to degrade complex substrates. This process is particularly significant for the more recalcitrant HMW PAHs (42, 43).
14
somewhat dependent on the number of rings present; the aqueous solubility of PAHs decreases approximately logarithmically with increasing molecular mass (50). Weissenfels et al (51) found that the initial rate of PAH degradation in untreated, contaminated soil proceeded slowly. When the PAHs were chemically extracted and added back to the soil completely in the aqueous phase, microbes were then able to degrade the substrates and removal occurred significantly faster. This suggests that sequestration of PAHs to soil particles is a key limiting factor in contaminated soils. Desorption and dissolution of PAHs from these unavailable phases is a complex process that is driven by concentration gradients. While microbial removal of PAHs from aqueous phase can act as a sink that drives dissolution, this process often does not occur quickly enough to match the rate of microbial growth (2).
In addition to chemical phase limitations, microbes are often physically separated from PAHs by the complex soil matrix, which further limits their access to substrates (2). As a result, bacteria in the soil must utilize other carbon substrates present or exist in a stationary phase until PAHs are encountered (39, 52). Some bacteria have adapted to this by altering the expression of PAH degrading enzymes. Constitutive expression, or constant production, of these enzymes enables bacteria to act immediately on a PAH when encountered. However, high levels of constitutive expression are energetically costly. Instead, some research has suggested that enzymes are expressed at low levels constitutively and that increased production of these enzymes occurs when their substrates become available, known as induction (39, 47). This can be in response to the presence of a metabolite in the degradation pathway, such as salicylate (41, 53). Induction in this manner has been observed in Pseudomonas putida strain G7 (3),
15
others. Expression of enzymes must therefore be considered in a remediation strategy, as it will influence the rate of PAH removal from soil.
The major metabolic pathways for aerobic PAH biodegradation for some substrates have been well characterized. Although anaerobic metabolism of PAHs has been observed, most attention has been focused on aerobic processes (41). Aerobic metabolism of many PAHs by bacteria generally follows the same major pathways (Figure 2). The first step is a dioxygenation reaction, during which two oxygen atoms are incorporated at two adjacent carbons of a benzene ring. This is carried out by a group of enzymes known as ring hydroxylating dioxygenases (RHDs) and creates a cis dihydrodiol (18, 23, 41). These enzymes require the presence of a ferredoxin, a ferredoxin reductase, and a two-component iron-sulfur protein in order to perform this reaction (55). Initial attack in this manner is termed “lateral dioxygenation” (56). Ring oxidation can alternatively be performed by a monooxygenase, which attaches one oxygen molecule to the benzene ring to create an arene oxide (1, 3). One notable exception to lateral dioxygenation is fluorene, which consists of two aromatic rings separated by a five membered ring (Figure 1). Due to this structure, initial oxidation is performed by specialized angular dioxygenases, which also results in formation of a cis dihydrodiol (56). Once a dihydrodiol is formed by one of these mechanisms, the next enzymatic step is dehydrogenation. Two
16
eventually transformed into tricarboxylic acid (TCA) cycle intermediates (18). PAH-derived intermediates can be used for metabolic processes in the cell once they are metabolized to this point. Bacteria capable of growth on PAHs as a sole source of carbon and energy must contain all the enzymes necessary to degrade the parent compound into TCA cycle intermediates. If not all enzymes are present, the cell might be able to perform some, but not all, of the steps in this pathway. In this case the cell may be capable of transformation of that PAH, but require other carbon sources for growth and energy (2). Much research has focused on the first three reactions in the PAH degradation pathway, termed the “upper” catabolic pathway, because these steps, particularly the first, commonly determine which substrates can be degraded (57).
2. Metabolism of Low Molecular Weight PAHs
PAHs that contain three rings or fewer are classified as low molecular weight (LMW), and include the compounds naphthalene (2 rings), phenanthrene (3 rings), anthracene (3 rings), and fluorene (3 rings), among others (Figure 1). Much research has been performed on
microbial degradation of these compounds, in particular naphthalene and phenanthrene. In addition to the identification of metabolites, research has focused on the genes that code for relevant enzymes involved in these pathways. LMW PAHs are usually degraded rapidly in sediments, as they are less recalcitrant, more water soluble, and more volatile than HMW compounds (3, 27). A diverse group of bacteria that biodegrade these compounds have been isolated, characterized, and researched.
17
strain G7 revealed it was coded by genes in the nah operon located on the NAH plasmid (59). Since this discovery, the nah operon has been sequenced and extensively studied (60). A similar gene cluster, named pah, was found in Pseudomonas putida strain OUS82 (61). This cluster codes for six different enzymes, including dioxygenases and dehydrogenases, that are involved in the early steps of naphthalene degradation (61, 62). Genetically similar gene clusters coding for dioxygenation enzymes have been identified in other PAH degraders including Comamonas testosteroni strain GZ39, Ralstonia sp strain U2, Pseudomonas aeruginosa strain PAO1,
Sphingomonas sp., and Rhodococcus sp. Collectively these are referred to as ‘nah-like’ genes,
and possess 90% sequence similarity across strains (41), suggesting that these organisms are either evolutionarily related or that horizontal gene transfer occurred. The latter is likely considering the nah operon is plasmid borne (41, 59). A second, distinct gene cluster for naphthalene degradation named phn was then identified in Burkholderia sp. strain RP007. The
18
Figure 2. The upper pathway of aerobic naphthalene metabolism. Compounds are naphthalene (A), cis-1,2-naphthalene dihydrodiol (B), 1,2-dihydroxynaphthalene (C), and
cis-o-hydroxybenzylidenepyruvate (D). The enzymes involved in each reaction step are naphthalene dioxygenase (I), cis-naphthalene dihydrodiol dehydrogenase (II), and 1,2-dihydroxynaphthalene dioxygenase (III).
Metabolism of phenanthrene begins in much the same way as naphthalene and, in some bacteria, utilizes the same enzymes. Initial dioxygenation has been observed at carbons 1 and 2 (65) and carbons 3 and 4 (66-68), both of which produce dihydrodiols. Through a series of further enzymatic steps, the intermediate 1-hydroxy-2-naphthoate is formed (66). At this point degradation can continue through either the salicylate/catechol pathway (66-69) or the
phthatlate/protocatechuate pathway (62, 70, 71). Similar enzymes have been found to perform the initial steps of both naphthalene and phenanthrene degradation in various Pseudomonas
19
isolated and studied in pure cultures, including Pseudomonas paucimobilis (73), Sphingomonas yanoikuyae (74, 75), and Pseudomonas aeruginosa strain PAH-1, which degraded phenanthrene anaerobically (33).
While anthracene and fluorene have not been studied as extensively, upper degradation pathways for both of these PAHs have been proposed. Metabolism of anthracene studied in P. aeruginosa and M. vanbaalenii strain PYR-1 revealed that dioxygenation occurred at carbons 1 and 2, yielding 1,2-dihydroxyanthracene. This intermediate was then transformed to 2-hydroxy-3-naphthoic acid and, after several more enzymatic steps, meta ring cleavage occurred. The ultimate metabolites funneled into the salicylate/catechol pathway (67, 69). The same metabolic scheme was observed in Rhodococcus sp. However, an additional ortho cleavage product from 1,2-dihydroxyanthracene was formed and eventually produced dicarboxylic acid. This pathway is thought to be unique to Gram positive bacteria (30). Metabolism of fluorene is suspected to proceed through three potential pathways. Dioxygenation can occur at carbons 1 and 2 or 3 and 4 to produce cis-dihydrodiols, which then undergo dehydrogenation and meta ring cleavage to funnel into the salicylate/catechol pathway. Alternatively, monooxygenation can occur at carbon 9 to create 9-fluorenol, which is then dehydrogenated to 9-fluorenone and other intermediates which eventually flow into the phthalate/procatechuate pathway. This metabolic scheme is more similar to those involved in degradation of biphenyls (41). The gene clusters dbf and fln in
20
3. Metabolism of High Molecular Weight PAHs
While many LMW PAH degraders were isolated and characterized in the last half of the twentieth century, it was not until later that metabolism of HMW compounds was well
understood. To date, strains capable of both transforming and growing on the 4-ring PAHs pyrene, benz[a]anthracene, fluoranthene, and chrysene have been isolated. While transformation of the 5-ring PAH benzo[a]pyrene has been observed, no currently isolated strains are capable of growth on this compound as asole source of carbon (4) . In contrast to the diversity of LMW PAH degraders, studies of HMW degradation are dominated by the Gram positive nocardioform actinomycetes, mainly Mycobacterium, and members of the Alphaproteobacterial Sphingomonas
genus (18). One hypothesis for this trend is the highly lipophilic membranes of nocardioforms, which may facilitate the transport of non-polar HMW compounds across the plasma membrane (35). While sphingomonadsare well known degraders of many different xenobiotics, some research suggests that the characteristics that allow them to degrade PAHs are not necessary for their survival (4). Other examples of Gram negative HMW degraders include some isolates in the genera Pseudomonas, Stenotrophomonas, and Burkholderia (4).
Microbial metabolism of pyrene has been well studied, and is often used as a model HMW PAH. The first report of an isolate able to degrade pyrene was Mycobacterium
21
(32). These intermediates were then dehydrogenated to produce dihydroxypyrene, followed by ring fission to form 4-phenanthroic acid which entered the phthalate pathway (77). The entire pyrene degradation pathway has since been mapped in PYR-1, with the major genes and enzymes involved identified (57, 77, 78). Heitkamp and Cerniglia also observed that induction played an important role during pyrene metabolism. Resting cells grown on organic acids had a significantly longer lag time than cells pre-incubated with pyrene. No degradation of pyrene was observed when resting cells were incubated with pyrene in the presence of the protein synthesis inhibitor chloramphenicol (54). Since the identification of PYR-1, many other Mycobacterium
strains have been isolated that are also capable of pyrene degradation, including Mycobacterium sp. strain RJGII-135 (79), Mycobacterium pyrenivorans (31)and Mycobacterium sp. strain CH1 (29). The latter two strains also utilized pyrene as a sole carbon source. Although dominated by
Mycobacterium, examples of pyrene degradation by Gram negative bacteria have also been found. These include some Pseudomonas strains, Burkholderia cepacia (18),and Sphingomonas paucimobilis strain EPA505 (80).
The first example of growth on fluoranthene as a sole source of carbon and energy was by a seven membered community reported by Mueller et al (81). Pseudomonaspaucimobilis
22
include Mycobacterium pyrenivorans (31) and Mycobacterium sp. strain CH1 (29). An alternative metabolic pathway involving initial oxidation at carbons 1 and 2 was found during cometabolism of fluoranthene by Mycobacterium flavescens and Rhodococcus sp. (85). Other examples of fluoranthene degraders include Alcaligenes denitrificans (73) and Pseudomonas saccharophila strain P15 (53).
While pyrene and fluoranthene are the most well studied HMW PAHs, strains capable of degradation of benz[a]anthracene have also been isolated. Many of these are sphingomonads. Sphingobium yanoikuyae, an isolate from polluted water, removed 56% of added
benz[a]anthracene after only 14 hours. However, cells first required induction with either salicylic acid, m-xylene or biphenyl (74, 75). Recovered ring cleavage products suggested that
S. yanoikuyae performed initial oxidation at carbons 1 and 2 (75). Pseudomonas saccharophila
strain P15 was also able to degrade benz[a]anthracene after induction by salicylic acid (53). Evidence of alternate metabolic pathways were found in Mycobacteriumsp. RJG11-135 (79) and M. vanbaalenii. PYR-1 (86), which performed initial oxidation primarily at carbons 5 and 6 and carbons 10 and 11, respectively. PYR-1 was capable of weak growth on benz[a]anthracene as a sole carbon source, but metabolism experiments were performed with phenanthrene added to the media (86). Degradation of benz[a]anthracene has also been observed by Sphingomonas sp.
strain EPA505 (80) and Mycobacterium sp. strain RJGII-135(79).
Although no bacteria capable of growth on benzo[a]pyrene as a sole carbon source have been isolated, several of the strains that grow on other HMW PAHs have been found to
23
specific metabolites were recovered (80). Ring cleavage products were also observed after incubation with Mycobacteriumsp. strain RJG11-135. Several metabolites, including three ring compounds and several cis-dihydrodiols, suggested that this strain could degrade benzo[a]pyrene through several pathways (79). Removal of benzo[a]pyrene by Pseudomonas saccharophila P15 was observed after induction by either phenanthrene (30% removal) or salicylate (20% removal) (53). Even though organisms are capable of transforming benzo[a]pyrene, removal of this PAH from contaminated sites is often far below other PAHs. One possible reason for this trend is the relatively higher KOW of benzo[a]pyrene, even when compared to other HMW PAHs, which may
cause it to sorb more strongly and quickly to soil particles. The resulting low bioavailability of benzo[a]pyrene may partially explain why no known bacteria are capable of utilizing it as a sole carbon source (2).
C. Applications to Bioremediation
Bioremediation studies involving bacteria have primarily focused on the principles of natural attenuation, biostimulation, and bioaugmentation (23). The last, which involves addition of microbes to the system, is often unpredictable (87). Applied microbes that demonstrate high removal of PAHs in the laboratory are sometimes not able to grow successfully in the
environment (2). This method also tends to be less accepted by the public due to the potential unintended consequences of releasing foreign organisms into the environment (40).
24
and treated offsite. (87). Monitored natural attenuation, or intrinsic bioremediation, is an alternative technique that monitors natural biological, chemical, and physical processes without interference as they remove compounds of interest (88). This technique is the most
cost-effective remediation option, as the only costs are those involved in monitoring. However, natural attenuation can require more time than biostimulation and bioaugmentation, and as such is commonly used at low-risk sites (89). In one comparison study of these three methods, total petroleum hydrocarbon removal from soils was found to be most effective with natural
attenuation (90), however the authors acknowledge that this may vary by site.
Success of bioremediation efforts is evaluated based on removal of the parent compound. In the United States and many other countries, regulatory guidelines often focus on a list of 16 PAHs designated as priority pollutants by the Environmental Protection Agency (91). However, it is unclear if removal of the regulated PAHs results in a reduction in health risk (92).
Incomplete metabolism has been observed during biological treatment of contaminated soil, and has the potential to create by-products that can exhibit greater toxicity than the parent
25
whole soil following treatment in an aerobic bioreactor. Genotoxicity was then reassessed after fractionating treated soil into desorbable and non-desorbable fractions. This analysis revealed that genotoxic components were present in the non-desorbable fraction, while genotoxicity of the desorbable fraction significantly decreased after treatment (95). While both of these studies confirmed the presence of genotoxic metabolites in the soil following biological treatment, neither isolated nor identified the compounds.
Bioremediation strategies utilizing bacteria will depend, in part, on characterizing the natural diversity of PAH degrading organisms present at the site. Microbes capable of PAH degradation have been found in environments across the globe. One prevailing theory is that these degraders are always present at low levels in the environment, existing in stationary phase and utilizing either alternate carbon sources or natural aromatic compounds. Once large-scale PAH contamination occurs, they are able to grow in number due to increased substrate
availability (40). This principle has been demonstrated after accidental oil spills, such as Deepwater Horizon in the Gulf of Mexico, by a temporal increase in populations of aromatic degraders (23, 96).
26
common degraders in phenanthrene-contaminated waters. However, these studies utilized culture-based methods which are biased, as relatively few (estimated < 1%) bacterial species have been grown in the laboratory. Rather than identifying natural degraders phylogenetically, enzymatic diversity at contaminated sites can also be assessed. The initial oxygenase enzymes (RHDs) are a good candidate for this, as they have been well studied and are relatively easy to identify using molecular methods. While this method does not allow for the taxonomic identification of organisms at the site, it provides some information regarding which PAHs can potentially be degraded based on known activity of dioxygenases (40). However, the lack of PCR primers for RHD genes from organisms that have not yet been described or sequenced may impact the usefulness of this approach.
Stable isotope probing has emerged as a culture-independent method to identify
organisms capable of utilizing a particular substrate. This technique involves incubation with a
13C-labeled growth substrate. Organisms capable of growth on the labeled substrate will
27
this technique allows for manipulation of environmental conditions to observe responses of microbial communities (103). Previous studies using SIP in PAH contaminated soils have observed different community structures than culture based studies (102, 104, 105), which emphasizes how the choice of methods will determine which degraders are identified. One limitation of SIP is the possibility of cross-feeding, which occurs when organisms grow on metabolites of the labeled substrate. Their DNA will be included in the heavy fraction, but these organisms may not be able to utilize the parent compound for growth. The use of time-course experiments can help interpret results if cross-feeding has occurred (100). Despite this
limitation, SIP is a useful tool in the field of microbial ecology to identify functionally relevant organisms in environmental samples.
Of particular relevance to this work, SIP of bioreactor-treated soil from a former MGP site in Charlotte, North Carolina using 13C-labeled pyrene identified several clusters of 16S
rRNA genes derived from uncharacterized Proteobacteria. One of these was designated as “pyrene group 1” or “PG1”, and belonged to the Rhodocyclaceae family of the class
28
Subsequent SIP experiments using contaminated soil from the same former MGP site in an aerobic bioreactor revealed further information regarding the substrate specificity of
organisms within PG1 and PG2. Incubations with labeled phenanthrene alone resulted in 94% of PG1 DNA, but only 65% of PG2 DNA, found in the heavy fractions. This suggests that PG1 preferred growth on phenanthrene over other carbon sources, but that PG2 was capable of utilizing other PAHs or carbon sources present in the soil (106). This trend was confirmed after experiments with combinations of labeled and unlabeled pyrene and phenanthrene. In all of these incubations, PG1 and PG2 DNA was found in all fractions present (heavy, intermediate and light), indicating both groups used pyrene and phenanthrene in varying amounts for growth. From these experiments the authors concluded that PG1 had a stronger preference for
phenanthrene over pyrene as a growth substrate, and that PG2 was likely capable of growth on other PAHs present in the contaminated soil (106). Further SIP experiments using labeled fluoranthene and benz[a]anthracene suggested that organisms within PG2 might be able to grow on these HMW PAHs in addition to pyrene (104).
The genes involved in PAH degradation in PG1 were then investigated in a heterologous expression experiment. A mixed culture containing at least three organisms (member(s) of PG1,
Pseudomonas, and Variovorax strains) but dominated by PG1 (by 16S rRNA gene relative abundance) was obtained from contaminated soil in Charlotte, North Carolina. A metagenomic library was constructed from this community, and eight different pairs of sequences suspected to code for the α- and β- subunits of RHD enzymes in PG1 were identified. Six of these genes were cloned and expressed in E. coli, along with a ferredoxin and reductase, and tested for activity against PAHs. All of the genes expressed were capable of transforming pyrene and
29
anthracene and benz[a]anthracene (107). The functional diversity of these genes lends more insight to which PAH substrates might be transformed by PG1.
Environmental 16S rRNA sequences with high similarity (>96%) to PG1 and PG2 have been found globally. Sequences similar to those designated as PG1 were among the most abundant in the bacterial community of a contaminated soil that had been treated with chemical oxidation as part of a remediation scheme (108) and 16S rRNA and functional genes with high similarity to those found in PG1 have been detected in soils similarly contaminated by PAHs (109-111). An SIP experiment using labeled pyrene on soil from a former wood preserving facility in St. Louis Park, Minnesota identified sequences similar to PG2 as the dominant
community members (112). Additional reports of 16S rRNA genes similar to PG1 and PG2 have been reported at sites contaminated with trichloroethylene (113), heavy metals (114, 115) and asphalts (116) as well as pristine water (117, 118) and soil samples (119). The prevalence of PG1 and PG2 at contaminated sites and functional relevance from SIP experiments suggests these organisms may be ubiquitous degraders of PAHs worldwide.
The use of bacteria in bioremediation is clearly a complex process that requires an understanding of not only the principles of microbial metabolism but of growth dynamics, community structures, and environmental conditions, among others. Isolation and
characterization of environmentally-relevant PAH degraders can indicate the dominant metabolic processes occurring in that community and provide information about the metabolites formed in treated soil. Efforts to cultivate both PG1 and PG2 were undertaken following their
identification and functional relevance in contaminated soils. The closest cultivated relative to PG1 (93.6% 16S rRNA gene similarity) was Sulfuritalea hydrogenivorans strain sk34HT, a
30
from the aerobic growth medium of strain sk34HT resulted in the isolation of a strain within PG1 designated Ca6T and a strain within PG2 designated TR3.2T from soil collected at former MGP
31 II. METHODS A. Cultivation of Ca6T and TR3.2T
The isolation medium for strains Ca6T and TR3.2T contained: 5 mM Na-K phosphate buffer (pH 7.0) and 5 mM NH4NO3 (collectively referred to as “reactor buffer”), 1 mM MgSO4·7
H2O, 1 mM CaCl2·2 H2O, 1 mL·L-1 of a trace element solution (containing per L; 12.5 mL HCl
[25%], 2.1 g FeSO4·7 H2O, 30 mg H3BO3, 100 mg MnCl2·4 H2O, 190 mg CoCl2·6 H2O, 24 mg
NaCl2·6H2O, 2 mg CuCl2·2 H2O, 144 mg ZnSO4·7 H2O, 36 mg Na2MoO4·2 H2O), and 1 mL·L-1
of a Se-W solution (containing per L; 0.4 g NaOH, 6 mg Na2SeO3·5 H2O, 8 mg Na2WO4·2
H2O). After autoclaving for 15 min at 250°C, the following filter-sterilized solutions (0.2 μm
pore size) were added aseptically to the cooled media: 1 mL·L-1 vitamin solution (containing 4
mg p-aminobenzoic acid, 1 mg biotin, 10 mg nicotinic acid, 5 mg ca-pantothenate, 15 mg pyridoxine-HCl, in 100 mL of a 10 mM phosphate buffer, pH 7.1), 1 mL·L-1 thiamine solution (containing 10 mg thiamine in 100 mL of 25 mM sodium phosphate buffer, pH 3.4), 1 mL·L-1 vitamin B12 solution (containing 5 mg cyanocobalamin in 100 mL distilled water), and 1.5 mL·L-1 thiosulfate solution (24.8 g Na
2S2O3·5 H2O in 100 mL distilled water, stored under N2
gas). Carbon was added before autoclaving as either 0.02% (final volume) PAH dissolved in acetone, with the solvent allowed to evaporate prior to adding other components, or 0.2% (final volume) sodium pyruvate. For solid media (“sRB-agar”), 1.5% agar (Acros Organics, NJ, USA) was added to liquid medium prior to autoclaving.
A series of experiments excluding various components of the isolation medium were performed to determine the minimal medium required for growth by each strain. Components excluded individually were (from the solutions listed above): MgSO4, CaCl2, trace element
solution, Se-W solution, vitamin solution, thiamine solution, vitamin B12 solution, and
32
uninoculated control. Optimal growth was defined as the maximum growth rate during the exponential growth phase as measured by turbidity at OD600 with a HACH DR3000
spectrophotometer (Loveland, Colorado, USA). The limited medium determined from these experiments was referred to as “sRB1” for strain Ca6T and “sRB2” for strain TR3.2T.
The optimal growth conditions of Ca6T and TR3.2T in sRB1 or sRB2 (“sRB1/2”) medium, respectively, with pyruvate as a carbon source were then determined for a range of temperatures, pH, and salinities. Temperature effects were tested in 5 mL of liquid medium at pH 7.0 and with constant shaking at 225 rpm for temperatures of 23, 26, 28, 30, 32, 34, 35, 36 and 37 °C (controlled using incubators), and on solid sRB1/2-agar plates at temperatures of 20 °C (tested at room temperature) and 4°C (tested in a refrigerator). The effect of pH on growth was tested in 5 mL of sRB1/2 medium buffered to pH values of 5.0, 5.5, 6.0, 6.5 (buffered with 2-(N-morpholino)ethanesulfonic acid, 50 mM), 7.0, 7.5, 8.0 (
4-(2-hydroxyethyl)-1-piperazineethanesulfonic acid, 50 mM) and 8.5, 9.0 (Tris HCl, 50 mM) and incubated at 225 rpm
and 30°C. Salinity effects were determined using 5 mL cultures of sRB1/2, pH 7.0, incubated at 30°C and 225 rpm, amended with either 0%, 0.25%, 0.5%, 1%, 2%, 3%, 4%, or 5% NaCl (w/v).
33
determined by visual examination of turbidity. The ability of each strain to grow under low oxygen conditions was assessed using the GasPak 100 system containing a GasPak EZ Anaerobe Container System sachet (BD Biosciences, San Jose, CA). Plates containing sRB1/2 and
pyruvate were inoculated and sealed in the system according to manufacturer’s directions. The system achieves an atmosphere of < 1% oxygen and ≥ 13% carbon dioxide within 2.5 hours. Visual observation of an indicator strip soaked in 1 mM resazurin solution confirmed low oxygen conditions were achieved after 48 hours. The entire system was incubated at room temperature with concurrent aerobic controls for approximately one month.
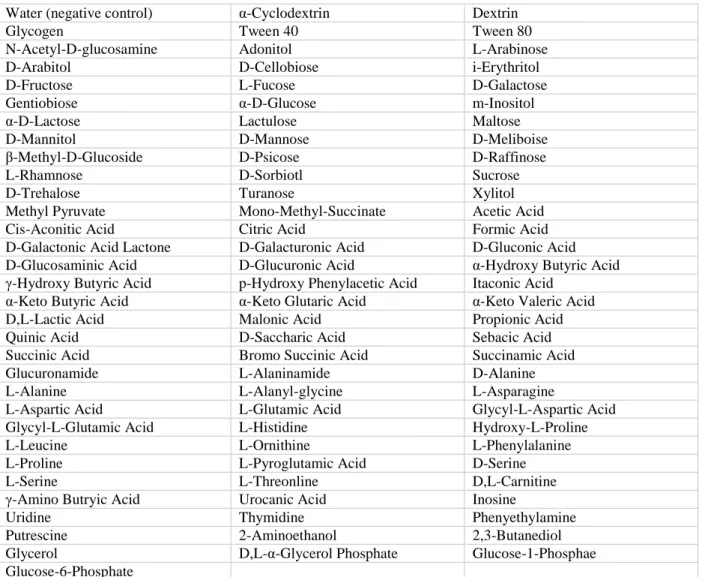
Water (negative control) α-Cyclodextrin Dextrin
Glycogen Tween 40 Tween 80
N-Acetyl-D-glucosamine Adonitol L-Arabinose
D-Arabitol D-Cellobiose i-Erythritol
D-Fructose L-Fucose D-Galactose
Gentiobiose α-D-Glucose m-Inositol
α-D-Lactose Lactulose Maltose
D-Mannitol D-Mannose D-Meliboise
β-Methyl-D-Glucoside D-Psicose D-Raffinose
L-Rhamnose D-Sorbiotl Sucrose
D-Trehalose Turanose Xylitol
Methyl Pyruvate Mono-Methyl-Succinate Acetic Acid
Cis-Aconitic Acid Citric Acid Formic Acid
D-Galactonic Acid Lactone D-Galacturonic Acid D-Gluconic Acid
D-Glucosaminic Acid D-Glucuronic Acid α-Hydroxy Butyric Acid
γ-Hydroxy Butyric Acid p-Hydroxy Phenylacetic Acid Itaconic Acid
α-Keto Butyric Acid α-Keto Glutaric Acid α-Keto Valeric Acid
D,L-Lactic Acid Malonic Acid Propionic Acid
Quinic Acid D-Saccharic Acid Sebacic Acid
Succinic Acid Bromo Succinic Acid Succinamic Acid
Glucuronamide L-Alaninamide D-Alanine
L-Alanine L-Alanyl-glycine L-Asparagine
L-Aspartic Acid L-Glutamic Acid Glycyl-L-Aspartic Acid
Glycyl-L-Glutamic Acid L-Histidine Hydroxy-L-Proline
L-Leucine L-Ornithine L-Phenylalanine
L-Proline L-Pyroglutamic Acid D-Serine
L-Serine L-Threonline D,L-Carnitine
γ-Amino Butryic Acid Urocanic Acid Inosine
Uridine Thymidine Phenyethylamine
Putrescine 2-Aminoethanol 2,3-Butanediol
Glycerol D,L-α-Glycerol Phosphate Glucose-1-Phosphae
Glucose-6-Phosphate
34
Following the establishment of optimal growth conditions, all subsequent tests of Ca6T and TR3.2T were performed on sRB1 or sRB2 medium at 30° C, pH 7.0, 0% salinity under
aerobic conditions and, for liquid media, with constant shaking at 225 rpm. B. Microscopy
The cellular morphology of both strains was investigated using scanning electron
microscopy at the Microscopy Services Laboratory (MSL; Pathology and Laboratory Medicine, University of North Carolina, Chapel Hill). For the preparation of samples, cells were grown in liquid sRB1/2-pyruvate medium for both strains and sRB1-pyrene medium for Ca6T until log phase. An equal volume of cell suspension and fixing solution (2% paraformaldehyde/ 2.5% glutaraldehyde in 0.15M sodium phosphate buffer; pH7.4) were mixed and incubated overnight at 4°C. The cell suspension was deposited onto 12 mm round poly-l-lysine coated coverslips, and incubated for 2 hours at room temperature in a humid chamber (BD BioCoat #354085, BD Biosciences, San Jose, CA). The coverslips were washed three times with 0.15 M sodium phosphate buffer, pH 7.4, dehydrated with ethanol (30%, 50%, 75%, 100%, and 100%), and transferred to a Samdri-795 critical point dryer and dried using carbon dioxide as the transitional solvent (Tousimis Research Corp., Rockville, MD). The coverslips were then mounted on 13 mm aluminum stubs with double-sided carbon adhesive and sputter coated with 5 nm of gold-palladium alloy (60Au:40Pd, Gatan High Resolution Coater, model 681, Gatan, Inc., Pleasanton, CA). Specimens were observed and images taken using a Zeiss Supra 25 FESEM operating at 5 kV, 5 mm working distance, and 10 μm aperture (Carl Zeiss SMT Inc., Peabody, MA). Average cell sizes were determined from SEM digital micrographs of at least 100 well-distinguished cells from at least four fields of view using the measure tool of the GNU Image Manipulation
35
Strain Ca6T was also examined using transmission electron microscopy at the MSL. Cells were grown on sRB1 amended with either pyruvate or pyrene until log phase. Bacterial cells were pelleted in a fixing solution (2% paraformaldehyde/2.5% glutaraldehyde/0.15M sodium phosphate, pH 7.4) overnight at 4˚C. Samples were post-fixed for 1 hour in 1% osmium tetroxide/0.15M sodium phosphate buffer, followed by dehydration through a graded series of ethanols (30%, 50%, 75%, 90%, 100%) and propylene oxide and embedded in Spurr's low viscosity epoxy resin (Polysciences, Warrington, PA). Ultrathin sections (70-80 nm) were cut with a diamond knife and mounted on 200 mesh formvar/carbon-coated copper grids followed by staining with 4% aqueous uranyl acetate and lead citrate. Samples were observed using a LEO EM910 transmission electron microscope operating at 80kV (Carl Zeiss Microscopy, LLC, Peabody, MA) and digital images acquired using a Gatan Orius SC1000 CCD Digital Camera with Digital Micrograph 3.11.0 (Gatan, Inc., Pleasanton, CA).
Gram-type was established for both strains by the standard staining reaction. Cells were grown to log phase on sRB1/2-pyruvate medium, and 10 µL of cell suspension was heat-fixed onto a glass slide. The slide was then sequentially flooded with crystal violet, Gram’s iodine, 95% ethanol, and safranin. Rinsing with distilled water was performed between each reagent. Staining of cells was observed using light microscopy.
C. Biochemical testing
A series of biochemical tests were performed to further characterize each strain. Unless otherwise noted, all tests were performed in triplicate with a concurrent uninoculated control. Starch hydrolysis and cellulase activity were each evaluated by supplementing sRB1/2 plates with either starch (10 g·L-1) or cellulose (1 g·L-1) (adapted from (121)). Inoculated plates were
36
identify clear zones around developed colonies. Protease activity was tested by aseptically adding a skim milk solution (10% skim milk powder dissolved in distilled water) to sRB1/2-agar after autoclaving. Lipase activity was assessed by adding tributyrin (98%, Acros Organics, NJ, USA) to sRB1/2-agar medium (1% v/v). Protease and lipase plates were incubated at 30°C for one month and monitored for zones of clearing surrounding developed colonies.
Strains Ca6T and TR3.2T were tested for catalase activity by adding 3% hydrogen peroxide solution (v/v) to cells freshly scraped from the surface of an sRB1/2 plate. Oxidase activity was determined by adding a few drops of freshly-prepared 1%
N’,N’,N’,N’-tetramethyl-p-phenylenediamine dihydrochloride (Acros Organics, NJ, USA) to cells scraped from the same plate onto filter paper (122). Cellular motility of each strain was tested using sRB1/2-agar tubes with agar added at 0.3% (w/v) and pyruvate as the carbon source. Tubes were stab-inoculated from a fresh colony and observed for growth extending outward from the stab.
Reduction of nitrate to nitrite was evaluated using a 1 mL aliquot of turbid culture grown on sRB1/2-pyruvate medium with NH4NO3 substituted with KNO3. A few drops of sulfanilic
acid and α-naphthylamine were added and the aliquot observed for a red color change, indicating the presence of nitrate in the media. If no color change occurred, a small amount of zinc powder was then added to ensure that nitrate was not reduced past nitrite. A color change to red at this step would indicate nitrate was still present in the media, and that the tested strain was negative for nitrate reduction.
Urease activity was determined using Stuart’s Urea Broth, which was prepared by amending phosphate buffer with urea (20 g·L-1) and phenol red (10 mg·L-1) in addition to
pyruvate, MgSO4 and trace element solution, and for TR3.2T, CaCl2 and vitamin B12 solutions as
37
tubes. After inoculation, tubes were monitored for 24 hours for a color change from yellow-orange to pink, indicating urease production.
Gelatin hydrolysis was assessed using a nutrient gelatin stab method wherein powdered gelatin (120 g·L-1) was added to sRB1/2, gently heated to dissolve and aliquoted into 5 mL tubes. Gelatin tubes inoculated with Ca6T or TR3.2T were incubated at 30⁰C and monitored for
liquefaction of the media. Tubes were placed in an ice bath for 30 minutes at the end of the incubation period in order to confirm any liquefaction that occurred was due to gelatinases and not temperature dependent.
Indole production was tested by supplementing sRB1/2 liquid media with tryptone (10 g·L-1) prior to autoclaving. Inoculated tubes were allowed to grow to turbidity, after which a few
drops of Kovac’s reagent was added to each tube. A color change from yellow to red in the reagent layer within seconds would indicate that production of indole had occurred. Indigo production from indole was assessed by adding a small crystal of indole to the lid of inverted Petri plates of sRB1/2-pyruvate medium 24 hours after inoculation. Plates were incubated at 30⁰C for two to four weeks and monitored for development of a blue/purple color in colonies.
Cellular fatty acid profiling was performed using the MIDI Sherlock® Microbial Identification System (Microbial ID, Inc., Newark DE, USA) on cells grown on sRB1/2 plates with pyruvate. Analysis of respiratory quinones and polar lipids was carried out by the
38 D. Metabolism of Aromatic Compounds
Growth of strains Ca6T and TR3.2T on select PAHs as sole sources of carbon and energy
was tested in liquid sRB1/2 media amended with individual PAHs. Stocks of PAHs were first created by dissolving compounds to a final concentration of 100 g·L-1 in the solvents acetone (naphthalene, fluoranthene, fluorene, and phenanthrene) or dichloromethane (benz[a]anthracene and anthracene), 10 g·L-1 in acetone (pyrene and benzo[a]pyrene), or 5 g·L-1 in dichloromethane (chrysene). 10, 100 or 200 µL of the stock PAH solutions were added to tubes, to a final
concentration of 0.2 g·L-1, and the solvent allowed to evaporate prior to adding the remaining media components. Tubes were additionally sonicated after autoclaving and prior to inoculation to help break up larger PAH crystals. 100 µL of turbid Ca6T or TR3.2T culture grown in sRB1/2-pyruvate medium was washed three times with reactor buffer and used to inoculate tubes. Triplicate PAH-containing tubes were incubated at 30°C at 225 rpm for up to 19 days for strain Ca6T and 42 days for strain TR3.2T. Uninoculated control tubes were also tested in parallel.
39
standard curve prepared from bovine serum albumin ranging from 25 to 2,000 µg/mL (ThermoFisher Scientific, Grand Island NY, USA).
Disappearance of each PAH was determined using a liquid-liquid extraction with an equal volume of n-hexanes. Extracts were analyzed using a high-performance liquid
chromatography system with fluorescence detection. Relevant system specifications include: a Waters (Milford, MA) 600E system controller, a Waters 717 Plus autosampler, and a Perkin Elmer (Beaconsfield, UK) LS40 fluorescence detector. Samples were injected through a 3-µm particle-size Supelcosil™ LC-PAH column (Sigma-Aldrich, St. Louis, MO) using a gradient mobile phase of filtered acetonitrile and reagent water. Initial conditions consisted of 60% acetonitrile and 40% filtered water at a flow rate of 1 mL/min. The proportion of acetonitrile was increased linearly to 100% during the first 10 min of each sample run, followed by a flowrate increase to 2 mL/min at 12.5 min. Analyte standards were prepared from an EPA 610 Polynuclear Aromatic Hydrocarbons Mixture stock (Sigma Aldrich, St. Louis, MO) and used to create a four-point calibration curve for sample quantification. Extraction efficiency was determined from uninoculated tubes with PAH added. For some PAHs these tubes had considerably less mass than what was added initially, presumably from volitalization during autoclaving. This is particularly evident for the low molecular weight compounds. For all substrates except naphthalene this method was able to quantify PAH concentration; naphthalene presumably volatilized from the tubes during either the incubation or extractions.
40
accumulation were observed throughout the course of the incubation, although the HPLC assay for PAHs was not suitable for quantification of carbazole.
Growth on the monoaromatic BTEX compounds was investigated by creating an atmosphere in separate, tightly-sealed metal containers of either benzene (99%), toluene
(99.8%), ethylbenzene (99.8%) or xylenes (o-xylene 98.5%, m- 99%, p- 99%, in equal volumes) by adding 0.5 mL of the chemical(s) to a piece of filter paper in a glass beaker. Triplicate inoculated sRB1/2-agar plates without additional carbon were incubated in these containers at room temperature for one month. Growth was determined by visual examination, and
categorized as positive, weakly positive, or negative. Control plates of sRB1/2-agar without carbon or the presence of BTEX compounds were simultaneously incubated in triplicate.
Mineralization of carbon from the partially 14C-labeled PAHs phenanthrene,
fluoranthene, chrysene, benz[a]anthracene, and benzo[a]pyrene was tested (see Figure 3 for location of labeled carbons). Triplicate screw-top Erlenmeyer flasks were prepared for each condition with sRB1/2 medium containing the appropriate labeled substrate. Each flask contained 100,000 (TR3.2T) or 50,000 (Ca6T) disintegrations per minute (dpm) of 14C-labeled phenanthrene, benz[a]anthracene, fluoranthene, and chrysene and 50,000 (TR3.2T) or 25,000 (Ca6T) dpms of benzo[a]pyrene. A glass test tube containing a piece of filter paper soaked in 60
µL of 2N potassium hydroxide solution was then placed inside the flask. A fresh culture of Ca6T or TR3.2T in late log phase grown on pyrene was washed three times with reactor buffer and used to inoculate the flasks. To determine the amount of radiolabeled CO2 produced in each
41
and the two readings summed to determine the total amount of 14CO2 produced throughout the
incubation. Concurrent acidified controls were prepared prior to inoculation by adding 85% phosphoric acid solution to the inoculum until pH was below 2.0. Mineralization was assessed as percentage of added PAH mineralized, and compared among the biotic and acidified replicates using a two-sample t-test using the statistical program R (v 3.0.1) (123).
Figure 3. Location of radiolabeled carbon(s), indicated by circles, on PAHs used in the mineralization assay
E. Genome Analyses
Genomic DNA from Ca6T and TR3.2T was extracted using the Wizard Genomic DNA
42
Energy/Joint Genomics Institute (DOE/JGI) as well as the annotation pipeline within the NCBI GenBank genome submission process.
Genome wide comparisons between Ca6T and its closest 16S rRNA gene relatives with complete genomes deposited in Genbank were performed. DNA to DNA hybridization (DDH) values were determined using the DSMZ Genome to Genome Distance Calculator (GGDC) (124). The Average Nucleotide Identity (ANI) was determined according to the method outlined by Goris et al (125).
43 III. RESULTS A. Strain Ca6T
1. Growth Characteristics and Physiology
Initial experiments revealed that strain Ca6T required reactor buffer, MgSO4, trace
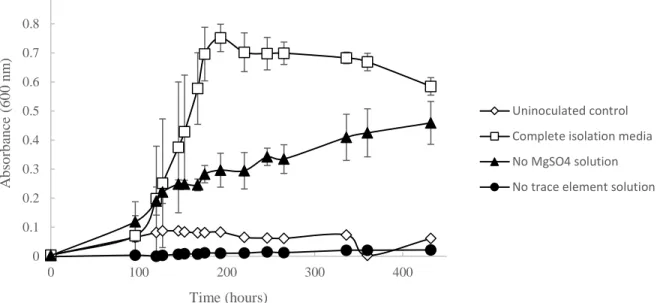
element solution, and a carbon source for growth at a rate equivalent to that of the complete isolation medium (Figure 4). Together these components comprised the “sRB1” medium. Aerobic growth in liquid medium at 30°C with shaking at 225 rpm was reduced (slower growth rate and lower cell density) in the absence of amended MgSO4, and no growth at all occurred in
the absence of the trace element solution. The optimal temperatures for growth were between 30 and 34 ºC, with obvious growth between 20 and 35 ºC (Figure 5). Strain Ca6T grew between pH 6.5 and 7.5 with an optimum of 6.5 (Figure 6). No growth was observed at salt concentrations > 0.5%, but strain Ca6T grew equally well with either 0.25% or no NaCl (Figure 7). Under optimal
44
Figure 4. Growth of Ca6T on differential medium. Measurements of absorbance at 600 nm were used to indicate cell density. Growth rate was decreased and cells grew to lower density when no MgSO4 solution was added. Absence of trace element solution resulted in no growth.
Exclusion of any other component (CaCl2, Se-W, vitamin, thiamine, thiosulfate, and vitamin B12
solutions) resulted in growth at a similar rate to the complete isolation media (data not shown). Data represent means and standard deviations of triplicate incubations for each condition.
Figure 5. Temperature profile of strain Ca6T. Temperatures of 23, 26, 28, 30, 32, 34, 35, 36 and 37 ºC were tested in 5 mL of liquid media, while 4 and 20 ºC were tested on sRB1-agar plates and scored as positive or negative for growth. Ca6T was positive for growth at 20 ºC and negative at 4 ºC (data not shown). Data represent means and standard deviations of triplicate incubations for each condition.
0 0.1 0.2 0.3 0.4 0.5 0.6 0.7 0.8 0.9
0 100 200 300 400
A b so rb an ce ( 6 0 0 n m ) Time (hours) Uninoculated control
Complete isolation media
No MgSO4 solution
No trace element solution
0.000 0.005 0.010 0.015 0.020
23 26 28 30 32 34 35 36 37
45
Figure 6. pH profile of strain Ca6T. All incubations were performed in 5 mL of liquid culture. Data represent means and standard deviations of triplicate incubations for each condition.
Figure 7. Salinity profile of Ca6T. All incubations were performed in 5 mL of liquid culture.
Data represent means and standard deviations of triplicate incubations for each condition. 0.000 0.002 0.004 0.006 0.008 0.010 0.012
5.0 5.5 6.0 6.5 7.0 7.5 8.0 8.5 9.0
G ro w th Ra te (Δ A BS /Δ t) pH 0.000 0.002 0.004 0.006 0.008 0.010 0.012 0.014
0.00 0.25 0.50 1.00 2.00 3.00 4.00 5.00
46
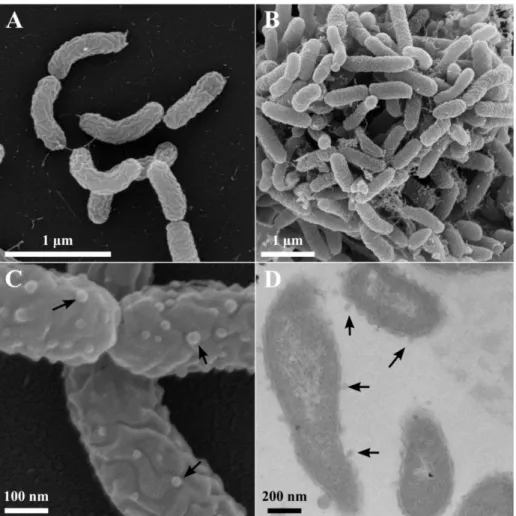
SEM micrographs showed that Ca6T was rod-shaped with an average size of 0.96 ± 0.19 μm by 0.25 ± 0.02 μm (n=100 cells). Many cells were observed to be curved (Figure 8), and in such instances length was measured using the linear distance from end-to-end of the cell. The outer membrane appeared wrinkled and uneven, and potential outer membrane vesicles (OMV) were evident on some (but not all) cells examined after growth on either pyrene or pyruvate as a carbon source (Figures 8C, 8D). Cells grown on pyruvate appeared more often individually or sometimes in pairs or small clusters, while cells grown on pyrene were generally clumped, presumably around pyrene crystals, with larger amounts of extracellular material apparent (Figures 8A, 8B). Electron-transparent inclusions were evident in some pyrene-grown cells examined by TEM, which were absent in cells grown on pyruvate (data not shown). Gram staining indicated strain Ca6T was Gram-type negative.
In triplicate samples, the only carbon substrates on Biolog GN2 microplates that strain Ca6T was able to actively metabolize were formic acid, methyl pyruvate, mono-methyl-succinate, and β-hydroxy-butyric acid. The other 91 substrates tested in the Biolog Plate, including a variety of sugars, other organic acids, nucleosides, and amino acids were not metabolized (Table 1). Ca6T was able to grow on both nitrogen sources tested (KNO3 and
NH4Cl) in addition to NH4NO3. Growth under low oxygen conditions was not observed with the
media employed.
47
motile. Consistent with other genera within the Rhodocyclaceae family, strain Ca6T was oxidase positive and catalase negative.
Figure 8. SEM (panels A, B, and C) and TEM (panel D) micrographs of Ca6T grown on pyruvate (A and C) or pyrene (B and D). Outer membrane vesicles (OMV) are marked by arrows.
The predominant fatty acids in Ca6T were summed feature 3 (C
16:1 ω7c or C16:1 ω6c)
(42.5%) and C16:0 (36.7%). Ca6T also contained C17:0 cyclo (6.5%), C10:0 3OH (3.9%) and C18:0 ω7c (4.9%). Trace amounts (<1%) of C10:0, C14:0, C16:1ω5c, C17:1ω7c, C18:2ω6,9c, C18:0, C19:0
cyclo ω8c, and C19:0 were also detected. Major polar lipids in Ca6T were
48
amounts of aminolipid, glycolipid and lipid present. Respiratory quinones present were Q7 (9%), Q8 (80%) and Q9 (11%).
2. Metabolism of Aromatic Compounds
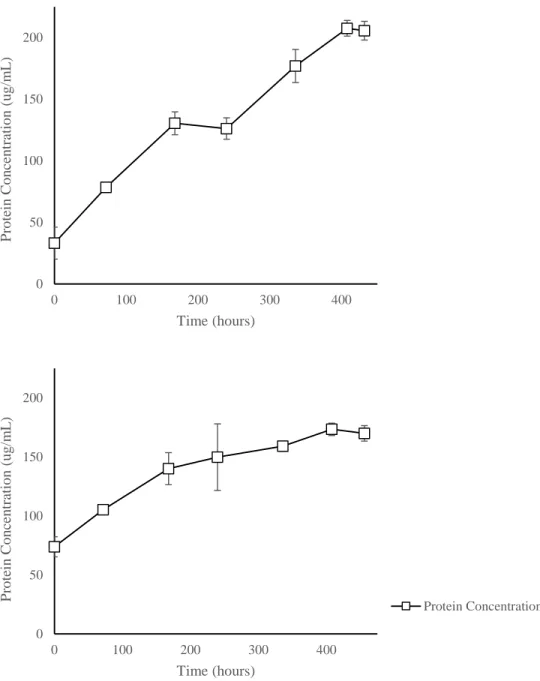
Incubation with selected, individual PAHs revealed Ca6T was capable of growth on both pyrene and phenanthrene as sole sources of carbon and energy. Removal of parent compound (Table 2) was correlated with an accumulation of protein (Figure 9), indicating growth on these substrates. Incubation with benz[a]anthracene resulted in PAH removal (Table 2) with slight protein accumulation (Figure 10). Although initial and final protein concentrations were significantly different, the trend of protein concentration throughout the incubation did not resemble the steady increase that is common of bacterial growth. This suggests that Ca6T may be capable of weak growth on this compound. Incubation with anthracene and fluorene resulted in PAH removal (Table 2) without protein accumulation (Figure 10), suggesting transformation but not growth on these substrates. Incubations during the growth experiment indicated that Ca6T was negative for growth on or transformation of chrysene, benzo[a]pyrene, fluoranthene, and naphthalene (select data shown in Table 2).
Ca6T also demonstrated growth on other aromatic compounds tested. Growth on the azaarene carbazole was confirmed through visual examination of turbidity and protein accumulation (data not shown). In addition, Ca6T was positive for growth on benzene and weakly positive for toluene, while ethyl benzene and mixed xylenes were negative.
49
Figure 9. Ca6T growth on pyrene (top) and phenanthrene (bottom). Each PAH was added at
0.02% as the sole carbon source in the media. Protein concentration was measured with the BCA Protein Assay. Significant removal of the added PAH was observed for both pyrene and phenanthrene (Table 2). Data represent means and standard deviations of triplicate incubations for each condition.
0 50 100 150 200
0 100 200 300 400
P ro tein C o n ce n tr atio n ( u g /m L ) Time (hours) 0 50 100 150 200
0 100 200 300 400
50
Figure 10. Metabolism of benz[a]anthracene (A), anthracene (B) and fluorene (C) by Ca6T. Each PAH was added at 0.02% as the sole carbon source in the media. Protein concentration was measured with the BCA Protein Assay. Significant removal of the added PAH was observed for
benz[a]anthracene, anthracene, and fluorene (Table 2). Data represent means and standard deviations of triplicate incubations for each condition
0 50 100 150 200
0 100 200 300 400
P ro tein C o n ce n tr atio n ( u g /m L ) Time (hours)
A
0 50 100 150 2000 100 200 300 400
P ro tein C o n ce n tr atio n ( u g /m L ) Time (hours)
B
0 50 100 150 2000 100 200 300 400
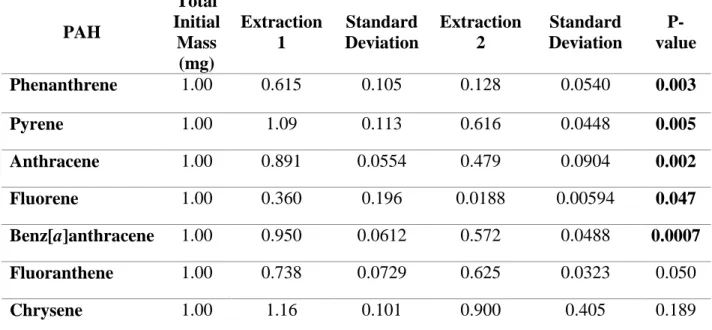
51 PAH Total Initial Mass (mg) Extraction 1 Standard Deviation Extraction 2 Standard Deviation P-value
Phenanthrene 1.00 0.615 0.105 0.128 0.0540 0.003
Pyrene 1.00 1.09 0.113 0.616 0.0448 0.005
Anthracene 1.00 0.891 0.0554 0.479 0.0904 0.002
Fluorene 1.00 0.360 0.196 0.0188 0.00594 0.047
Benz[a]anthracene 1.00 0.950 0.0612 0.572 0.0488 0.0007
Fluoranthene 1.00 0.738 0.0729 0.625 0.0323 0.050
Chrysene 1.00 1.16 0.101 0.900 0.405 0.189
Table 2. Removal of PAHs from liquid medium by Ca6T during growth experiment. Total
initial mass represents the amount of PAH added to each tube prior to autoclaving. Extraction 1 was performed on autoclaved tubes with no inoculum. Extraction 2 was performed at the end of the incubation period. P-value was calculated using a two sample t-test. Significant values (p ≤ 0.05) are denoted in bold font. Data represent means and standard deviations in triplicate samples.
Figure 11. Mineralization of radiolabeled PAHs by Ca6T measured using 14C labeled substrates. Live replicates were compared to acidified controls using a two sample t-test. Significant differences (p ≤ 0.05) are denoted by stars. Data represent means and standard deviations of triplicate incubations for each condition.
0 5 10 15 20 25 30 35 40
Phenanthrene Fluoranthrene Benz[a]anthracene Benzo[a]pyrene Chrysene
% M
in
er
alize
d
52 3. Genetics and Phylogeny
The genome of Ca6T was a single, circular chromosome of 2,934,611 bp with a G+C
content of 55.14% (128). The JGI-IMG annotation predicted 2,902 genes with two copies of the rRNA gene operons and 45 tRNA genes. The two copies of the 16S rRNA gene were identical. Annotation also revealed at least eight sets of ring-hydroxylating dioxygenase (RHD) genes in Ca6T (large and small subunits), six of which were previously expressed in Escherichia coli and demonstrated activity against PAHs (107). These RHD genes were located in four regions on the chromosome, often in close proximity to monooxygenases and dioxygenases with predicted activity against other aromatic compounds. Ca6T also contained one putative dihydrodiol dehydrogenase gene, and two putative extradiol dioxygenase genes to complete an “upper pathway” of PAH metabolism.
The 16S rRNA gene sequences from the two rRNA gene operons were used to determine the phylogeny of Ca6T. The closest described relatives to Ca6T were Sulfuritalea
hydrogenivorans strain sk34HT (93.6% 16S rRNA gene similarity) (21), Denitratisoma sp. TSA61 (93.2%) (129), Georgfuchsia toluolica G5G6T (92.0%) (130), Sulfurisoma sediminicola
BSN1T (91.8%) (131), Denitratisoma oestradiolicum AcBE2-1T (91.6%) (132), and
Sterolibacterium denitrificans ChoI-1ST (91.5%) (133); these organisms are all members of
genera within the Betaproteobacterial family Rhodocyclaceae. A complete genome comparison between Ca6T and sk34HT, the only strain of those listed above with a published complete
53
revealed the relationships between Ca6T and other members of the Rhodocyclaceae family (Figure 12) and among uncultivated environmental 16S rRNA sequences (Figure 13).
The physiological characteristics and genomic analysis of strain Ca6T justifies its establishment as novel genera and species. Strain Ca6T was differentiated from the closest 16S rRNA gene relatives by isolation source; many neighboring strains were isolated from marine environments (120, 130, 131), while Ca6T was isolated from contaminated soil. All closely related strains are also capable of facultative anaerobic growth and nitrate reduction, while Ca6T
requires an aerobic environment for growth and is not able to reduce nitrate. Sulfuritalea


![Figure 10. Metabolism of benz[a]anthracene (A), anthracene (B) and fluorene (C) by Ca6 T](https://thumb-us.123doks.com/thumbv2/123dok_us/8337378.2213480/50.1188.524.908.122.409/figure-metabolism-benz-anthracene-anthracene-b-fluorene-ca.webp)