ContentslistsavailableatScienceDirect
Journal
of
Informetrics
jou rn al h om ep a ge : w w w . e l s e v i e r . c o m / l o c a t e / j o i
Regular
article
Global
science
discussed
in
local
altmetrics:
and
its
comparison
with
Houqiang
Yu
a,
Shenmeng
Xu
b,∗,
Tingting
Xiao
a,
Brad
M.
Hemminger
b,
Siluo
Yang
aaSchoolofInformationManagement,WuhanUniversity,Wuhan430072,China bSchoolofInformationandLibraryScience,UNCChapelHill,ChapelHill,27514,USA
a
r
t
i
c
l
e
i
n
f
o
Articlehistory: Received18July2016
Receivedinrevisedform27February2017 Accepted27February2017
Availableonline20March2017
Keywords: Altmetrics Weibo
Altmetricsindicators Scholarlycommunication Distribution
a
b
s
t
r
a
c
t
Localaltmetricsiscurrentlyanintegralpartofthealtmetricslandscape.Thispaperaimsto investigatethecharacteristicsofmicroblogaltmetricsoftheChinesemicroblogplatform, Weibo,toshedlightonculturaldifferencesanddrawattentiontolocalaltmetricsin devel-opingcountries.Theanalysisisbasedon4.4millionrecordsprovidedbyAltmetric.com. DatacollectedarefromMarch2014toJuly2015.ItisfoundthatWeibousersdiscussglobal science,moreactivelycomparedwithseveralinternationalaltmetricssources.Statistical resultsshowstrongevidenceoftheimmediacyadvantageofmetricsbasedonWeiboas wellasTwitterandthegeneralaltmetricsovercitations.DistributionofWeiboaltmetrics onthearticlelevel,sourcelevelanddisciplinelevelarehighlyskewed.Overall,compared withTwitter,Weiboaltmetricspresentsimilardistributions,withsomeminorvariations. TobetterunderstandhowandwhyWeibousersdiscussglobalscientificarticles,thetop weiboedarticles,sourcesanddisciplinesareidentifiedandfurtherexplored.Ourcontent analysisshowsthatthecommonmotivationofscientificweibosistodisseminateordiscuss thearticlesbecausetheyareinteresting,surprising,academicallyusefulorpractically use-ful.Conclusionofarticlesisthemostfrequentlymentionedelementinscientificweibos.In addition,differentfromTwitter,Weibousershaveapreferencefortraditionalprestigious journals.
©2017ElsevierLtd.Allrightsreserved.
1. Introduction
Aseriesofbehaviorsareconductedintheresearchprocess,includingbutnotlimitedtoinformationseeking,saving, reading,annotating,brainstorming,experimentation,dataanalysis,paperdraftingandciting.Thecitingbehaviorisrecorded bycitations,givingbirthtocitationanalysis;inthemoderndigitalera,manybehaviorsarerecordedbyonlinescholarly toolsandplatforms,layingthefoundationofaltmetrics.Altmetrics,bycapturingdigitaltracesofscientificproducts,aims toimprovescholarlycommunication,scientificevaluationandliteraturediscovery(Moed,2015).Altmetricsresearchis developingfromtheoretical(Priem,2013)andcriticaldebate(Qiu&Yu,2015)tomoreempirical(Wang,Guo&Zhang, 2015),experimental(Friedrich,Bowman,Stock,&Haustein,2015)andapplication-oriented(Das,2015)studies.Sofar,digital tracesonmanytoolsandplatformshavebeenstudied,includingTwitter(Haustein,Peters,Sugimoto,Thelwall,&Larivière, 2014c),Mendeley(Thelwall&Wilson,2015),ResearchBlogging(Shema,Bar-Ilan&Thelwall,2014),F1000(Mohammadi&
∗ Correspondingauthor.
E-mailaddress:[email protected](S.Xu).
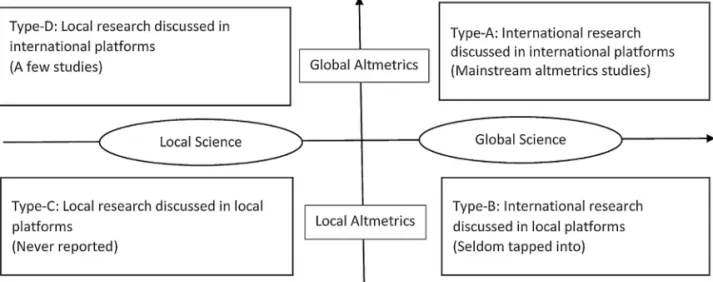
Fig.1.Fourtypesofaltmetricsstudies.
Thelwall,2013),ResearchGate(Thelwall&Kousha,2015)andYouTube(Kousha,Thelwall&Abdoli,2012),amongothers. Whilescientificarticleisstillthemostcommonlystudiedtypeofscientificproduct,manyothertypesareexplored,for instance,blogs(Shema,Bar-Ilan&Thelwall,2012),software(ImpactStory,2016),slides(Kraker,Lex,Gorraiz,Gumpenberger, &Peters,2015),datasets(Petersetal.,2015),andvideos(Koushaetal.,2012).Altmetricshasbeenappliedinscientific evaluation.Evaluatedobjectscanbeajournal(Loach&Evans2015),aninstitution(Petersetal.,2014;Rehemtula,Rosa, Leitao,&Avilés,2014),adiscipline(Holmberg&Thelwall2014)orascientist(Kolahi,2015).Someinstitutions(ScienceOpen, 2016)haveenableduserstorankliteratureretrievalresultsbytheAltmetricAttentionScore.
Altmetricshasdrawnattentionfromworldwideacademia.AsshowninFig.1,fourtypesofaltmetricsresearchare definedbasedonthegeographical variationofaltmetricssourcesandscientific outputs.Type-Bandtype-D altmetrics studiesinvestigatethecommunicationbetweenlocalscienceandglobalscience,whiletype-Caltmetricsstudiesmainly focusondomesticscientificcommunication.Alperin(2013)arguesthatbydisseminatingresearchinonlinesocialmedia, thealtmetricsmovementwouldreducethebiascausedbyleadingbibliographicdatabaseswhereresearchfromdeveloping countriesisunderrepresented.However,altmetricsresearchhithertohasbeenfocusedontype-Astudieswheredataare collectedfrominternationalplatforms,ofresearchfrominternationalmainstreampublishers,prevailinglyindeveloped countries.AfewresearchershaveconsideredlocalaltmetricsandconductedType-Dstudies.Alperin(2015)investigated thecoverageofaltmetricsdataintheprominentLatinAmericanjournalportalSciELOandfoundthecoveragelevelofmost socialmediasourceswaszeroornegligible.Poplasen(Poplaˇsen&Zrni ´c2014)triedtousealtmetricsformeasuringscience inCroatia.Tammaro(2014)testedaltmetricsasanevaluationmethodforItalianscholarsinthehumanities.Torresetal. (Torres,Cabezas,&Jimenez,2013)conductedacasestudyonasampleofSpanishcommunicationstudies.However,these studiesalluseddatafrominternationalsocialmediaplatforms,neglectinglocalplatforms,whichplayanimportantrolein domesticscientificcommunication.
Type-Bandtype-Cstudiesareseldomseen,becausetheinfrastructureforanalyzinglocalaltmetrics,forexampledata aggregatingservices,isnotwellestablished.Thispaperarguesthatlocalaltmetricsisanintegralpartoftheholisticaltmetrics landscape.Discussionsonlocalaltmetricssourcescanfunctionaschannelsforintroducinginternationalscientificresearch. ThisistrueespeciallyincountrieswhereEnglishisnotthefirstlanguageorwhereglobalplatformsareblocked.Including localaltmetricsofdifferentcontextwouldrevealamorecomprehensiveviewofaresearchproduct’strueimpactoverthe world.
China,whilethrivingasastrongscientificpower,hasrestrictedaccesstomanyinternationalsocialmediaplatformssuch asTwitter,Facebook,andYouTube.SinaWeiboiscurrentlythemostwidelyusedmicroblogservice.Asatype-Bstudy,the aimofthisstudyistwofold:(1)Toinvestigatethecharacteristicsofanimportantlocalaltmetricssource,namelyWeibo,in discussingglobalscience.ItisofparticularinteresttoseehowglobalscientificresearchisdiscussedonWeibobyChinese users,consideringthatChinaisalargeeconomicentitywhichalsohasalargeacademiccommunity.(2)Tostudythe differencebetweenWeiboandTwitterasacomparisonoflocalaltmetricsandglobalaltmetrics.Althoughbothofthesetwo platformsarepopularmicroblogservices,theyhavecompletelydifferentusersfromdiverseculturalbackgrounds.Itisalso ofsignificantmeaningtocomparealtmetricsbasedonthesetwoplatformstorevealthenatureofaltmetricsofmicroblog servicesasawhole.
2. Researchquestions
ofWeiboaltmetricsonthearticle,sourceanddisciplinelevels?HowarethepatternscomparedwithTwitteraltmetrics?(4) HowandwhydoWeibousersdiscussglobalscientificarticles?Toanswerthisquestion,wemainlyfocusonthemotivation, elementsmentioned,andsentimentofthetopweibos.
Thisstudycontributestoaltmetricsstudiesinfourways:(1)Westudyanovelaltmetrics,Weibo,andcallforattention onlocalaltmetrics.Itwilladvancethedevelopmentofdomesticaltmetricsandtakealtmetricsstudiesonestepfurtherto provideamorecompleteviewofresearchimpact.(2)Wemeasuretheimmediacyofmicroblogaltmetricsinasystematic way.Theresultprovidesevidenceofwhetherandhowmuchmicroblogaltmetricsisfasterthancitations.(3)Weconducta comprehensivecomparisonbetweenWeiboandTwitter.Asthetwomostpopularmicroblogservices,thesimilaritiesand differencesbetweentheminglobalsciencediscussionareofparticularinteresttoscientificcommunication.(4)Moreover, inthisstudy,weusethelargestaltmetricsdatasetofWeiboandTwittersofar.Ourresultswillprovidereferencetoother relatedempiricalstudies.
3. Methodology
3.1. Usedterms
Forconvenienceofdiscussion,frequentlyusedtermsinthepaperareexplainedasfollows.
Altmetrics:Accordingtothecontext,thiscouldrefertotheresearchfieldorthealtmetricsindicators.
Weibo:ThepropernounWeiboreferstothemicroblogplatformSinaWeibo(Weibo.com).Thecommonnounweibo referstoamicroblogpostedonSinaWeibo,i.e.,aWeibopost.Whenusedasaverb,weiboreferstothebehaviorofposting amicroblogonWeibo.
Weiboaltmetrics:ThisdenotesaltmetricsbasedonSinaWeibo.WhenaresearchproductismentionedinaWeiboviaa link,aDOIorothertrackableways,wesaythatthisresearchproductreceivesaWeibomention,orhasWeiboaltmetrics.
Scientificweibo:Werefertoaweiboasascientificweibowhenitmentionsascientificproductandusuallycontainsa linktoit.
3.2. AbriefviewofWeibo
Weibo,originallytheChinesePinyinformicroblogandreferringtogeneralmicroblogservices,wasbrandedbySina Corporationin2010.NowWeibonormallyreferstoSinaWeibo.AsmicrocosmofChinesesociety,Weibohasattracteda widerangeofusers,includingcelebritiesandpublicfigures,organizationssuchasmediaoutlets,businesses,government agenciesandcharities,aswellasthegeneralpublic.Accordingtothelatestreport,inNovember2015,Weibohad261million monthlyactiveusers,comparedwith310millionmonthlyactiveTwitterusers.Weiboenablesuserstoexpressandshare theirideas,opinionsandstoriesintheformoftextandattachedmultimedia,includingimages,music,andshortvideos. Thereusedtobea140characterlimitonWeiboposts,however,thelimitwasremovedinFebruary2016.
Adominating97.2%ofWeibousersarefromChina,however,only21.9%ofTwitterusersarefromtheU.S.Inthissense, SinaWeiboisa localmicrobloggingserviceinChina.LikeTwitter,Weibo iswidelyusedfor scientificcommunication. Ithelpsevaluatethequantityandqualityofinformationfluxbetweentraditionalscientificexpertcommunitiesandthe broaderpublic(Zhao,Chen,Ge,Yu,&Shao,2014).OnereportshowsthatWeibouserswhoareengagedinscienceinclude professionalresearchers,teachersincollegesanduniversities,sciencewriters,journalists,andeditorsofscience,etc.(Liu, 2012).
3.3. Dataset
Altmetric.combegan totrackWeibo inMarch2014upon customers’request,and thetrackingended inJuly2015 (AltmetricLLP,2016),becausethecostbecameunaffordablewhenSinaWeibostoppeddistributingdatatoexternal com-paniesandeversincestartedupusingSocialgistastheirsolenon-Chinesedatabroker.1Altmetric.comprovidedthefull datasetfromOctober2011toNovember2015forthisresearch,makingitpossibletoconductlargescalecomparisonand analysis.Thedatasetcontainedover4.4millionrecordsinJSONformat.Arelationaldatabasewasestablishedforretrieval’s convenience,andpythonscriptswereusedtoextractandanalyzethedata.
TocompareWeiboaltmetricswithotheraltmetricsinthesametime window,wefocusedonrecordscapturedby Altmetric.comfromMarch2014toJuly2015.Thetotalnumberofrecordswas1.99million.Forspecificresearchpurposes, forexampletheimmediacyanalysisofTwitter,recordsoftheentireperiod(i.e.October2011toNovember2015)were used.Inthedataset,eachrecordrepresentsaresearchproductofwhichaltmetricsactivitiesarecaptured.Thealtmetrics includethosebasedonWeibo,Twitter,Facebook,Blog,Wikipedia,News,GooglePlus,Policy,Reddit,F1000,PeerReviews, Video,andQ&A.AswillbedemonstratedinSection3.1,thesealtmetricshavevariouslevelsofcoverageonarticles.Abrief descriptionoftheseindicatorscanbefoundinTable1.
Table1
Briefdescriptionofaltmetricsindicators.
Indicator Description
Twitter NumberofmentionsanarticlereceivesonTwitter Weibo NumberofmentionsanarticlereceivesonWeibo Facebook NumberofmentionsanarticlereceivesonFacebookwalls
Blog Numberofmentionsanarticlereceivesonover9000academicandnon-academicblogsfeeds trackedviaRSSbyAltmetric.com
Wikipedia NumberofmentionsanarticlereceivesonWikipedia.org
News Numberofmentionsanarticlereceivesonover2000mainstreammedia GooglePlus NumberofmentionsanarticlereceivesonGooglePlus
Policy Mentionsofpublicationsinpolicydocuments.AccordingtoLiu,Konkiel,&Williams(2015), policydocumentsarefromdiversegroupssuchastheInternationalMonetaryFund,World HealthOrganization,andIntergovernmentalPanelonClimateChange.
Reddit NumberofmentionsanarticlereceivesonReddit
F1000 ArticlefactorcalculatedfromtherecommendationsforapublicationonF1000 PeerReviews Evaluationsofindividualoutputsfromcontributortoopenpost-publicationpeerreview
forumsPubpeerandPublons
Video NumberofmentionsanarticlereceivesinvideodescriptionsandcommentsonYouTube Q&A MentionofanarticleinquestionsandanswersonStackOverflow(stackoverflow.com)
3.4. Coveragecalculation
Coveragestatisticsreflectstheactivenessofaltmetricsindicators.Forexample,if90%ofasetofarticleshavebeentweeted butonly10%ofthemaresavedinMendeley,thenthecoverageofTwitteraltmetricsishigherthanMendeleyaltmetricsfor thissetofarticles.Thecoverageofaltmetricshavebeendiscussedinanumberofstudies.Forinstance,Araújo,Murakami, Lara,andFausto(2015)examinedTwitterandFacebookmentionsofarticlespublishedinaBrazilianLISjournal;Haustein, Bowman,Macaluso,Sugimoto,andLarivière(2014)exploredTwitteractivitiesandAltmetriccoverageofarticlesonArxiv; Zahedi,Costas,andWouters(2014)studiedthepresenceanddistributionofaltmetricsinthesetofpublications,acrossfields, anddocumenttypes;Hausteinetal.(2014b)investigatedtheadoptionofaltmetricssourcesbysampledbibliomatricians. While theseresultsprovidesomeideaabouttheactiveness ofaltmetrics,thecoveragestheyhaveexploredareunder differentcontexts,makingitdifficulttocomparethem.Ourstudy,therefore,calculates therelativecoverageofWeibo altmetrics,alongwithseveralotherpopularaltmetrics.Weusethetotalnumberofresearchrecords(1.99million)tracked byAltmetric.comintheWeibodatacollectionperiod(fromMarch2014toJuly2015)asthedenominator,andthenumber ofrecordsforeachaltmetricssourceasthenumerator,tocalculatethepercentage.Inthisway,despitethetotalcoverageof Altmetric.com,wecanhaveabetterunderstandingoftherelativecoverageofWeiboaltmetrics,comparedtoothers.
3.5. Immediacycalculation
ThetimedifferencebetweenthepublicationdateandthefirstWeibomentiondateiscalculatedtomeasuretheimmediacy ofWeiboaltmetrics.ThesamemeasuringtechniqueisusedonTwitterandthegeneralaltmetrics.AsdiscussedbyHaustein, Bowman,andCostas(2015),thefirstpubliconlineappearanceofVoR(VersionofRecord)shouldbeusedasthebasictime unittodeterminetheofficialpublicationdateofapaper,andamongmanyavailabledatasources,thepublicationdate collectedbyAltmetric.com,whichisamixtureofjournalissuedateandonlinedate,isoneofthebestproxiesforonline publication.Asaresult,Altmetricpublicationdatewasusedasthepublicationdateinourimmediacycalculation.LetTpw
denotethetimeTwbethefirstWeibomentiondate,TpbetheAltmetricpublicationdate,then
Tpw=Tw−Tp(days)
IfTpw<180days,theWeibomentionisdefinedtobeimmediate,comparedwithcitationsthatwouldtakeyearsto
accumulate(Brody&Harnad,2006).Theimmediacydistributionispresentedintimeintervalsof1day,7days(oneweek), 30days(onemonth),180days(halfyear),360days(oneyear)andover360days.WhenthefirstWeibomentionisprior totheAltmetricpublicationdate,Tpwisnegative.Forcomparison,theimmediacyofTwitterandthegeneralaltmetrics,
measuredrespectivelybyTptTpadefinedthesamewayasTpw,werealsocalculated.Taisthefirstdatewhenanarticleis
capturedbyanyaltmetricssourcetrackedbyAltmetric.com.
3.6. Distributioncalculationandclassificationschemafordisciplines
TostudythedistributionofWeiboaltmetrics,wecountthenumberofWeibopostsforeacharticle,eachsourceand eachdiscipline.Asobserved,Altmetric.comhasmaintainedthedisciplinecategorybasedontheScopusschema(Ss)andtwo
otherclassificationsystems,i.e.publisherdiscipline(Sp)andMedlinediscipline(Sm).48.2%oftheweiboedarticleshaveall
threeclassificationschemes,while78.7%ofarticleshaveatleastoneofthesethreeclassificationcode.Specifically,Sscovers
themostarticles(72.8%),Spcoversthesecondmostarticles(68.7%),andSmcoverstheleastarticles(59.5%).21.3%ofarticles
Table2
Motivationcodingscheme.
Firstlevelcode Secondlevelcode Definition
1Dissemination 1.1Dissemination−Interesting Tohighlighttheinterestingpart(s)ofthearticletoattractattention 1.2Dissemination−Surprising Tohighlightthesurprisingfact(s)beyondnormalexpectationtoattract
attention
1.3Dissemination−Academicallyuseful Tohighlighttheacademicusefulnessofthearticletoattractattention 1.4Dissemination−Practicallyuseful Tohighlightthepracticalusefulnessofthearticletoattractattention 1.5Dissemination−Linkonly Toprovidethelink
1.6Dissemination−Perfunctoryintroduction Toprovidethelinkwithverybrief,perfunctoryintroduction 1.7Dissemination−Requestforaccess Toaskforhelpwiththeaccessofthearticle
2Discussion 2.1Discussion−Interesting Toelaboratetheinterestingpart(s)ofthearticletoarouseinteractive communication
2.2Discussion−Surprising Toelaboratethesurprisingfact(s)ofthearticlebeyondnormalexpectationto arouseinteractivecommunication
2.3Discussion−Academicallyuseful Toelaboratetheacademicvalueofthearticletoarouseinteractive communication
2.4Discussion−Practicallyuseful Toelaboratethepracticalvalueofthearticletoarouseinteractive communication
2.5Discussion−Supportingaclaim Toreferencethearticletosupportaclaim 2.6Discussion−Criticizing Tocriticizethearticle
2.7Discussion−Responding Torespondtorelevantreportsofthearticle 3Marketing 3.1Marketing−Self-promotion Topromoteone’sownwork
3.2Marketing−Otherpromotion Topromoteothers’work 4Triggering 4.1Triggering−Reuse Tosaveforfuturereuse
4.2Triggering−Association Torelatethearticletorelevantideas
on,orfromothersmallscalepublishers,whomaintaintheirownclassificationsystemthatare,however,toosparsetobe recordedandanalyzed.
ConsideringthatSshasthehighestcoverage,hereinthisstudyweuseitinthedisciplinelevelanalysis.Itmustbe
noticedthatSsisslightly differentfromthecurrentScopusclassificationschema.ThecurrentScopusclassificationhas
divided“PhysicsandAstronomy”intotwosmallercategories,i.e.,“Astronomy,Astrophysics,SpaceScience”and“Physics”.Ss
has30disciplinesofwhichtheabbreviationandfulltitlecanbereferencedinAppendixA.PublisherSpmainlyconsistsof
theclassificationsystemsadoptedbytheERA(ExcellenceinResearchforAustralia),theNPG(NaturePublishingGroup), andSpringer.Specifically,ERAhas155disciplinesinitsclassificationsystem,Springerhas250,andNPGhas882,according totheAltmetric.comdata.AmidstweiboedarticlescoveredSp,ERAarticlestakeup76.6%,NPGarticlestakeup17.5%and
Springerarticlestakeup6.9%.TheNPG’sdisciplinesarefoundtobemorelikekeywordsratherthandisciplines.Duetothe heterogeneousnatureofSp;publisherdisciplinewasusedforreference.MedlinedisciplineSmprovidesdetaileddisciplines
ofgeneralmedicalscienceandhas96disciplines.Itcouldprovideinsightinthefurtheranalysisofdisciplinarydistribution ofthemedicalfield.Agoodcombinationofthesethreeclassificationsystemscanclearlyrevealthedisciplinarydistribution oftheweiboedarticles.
3.7. Contentanalysis
Inordertounderstandwhyusersweibothehighlyweiboedscholarlyarticles,contentanalysiswasconductedonweibos ofthetop1%(109of10,754)ofweiboedarticles,whichaccountsfor29%(10,775of37,200)ofthetotalweibos.Giventhat repostsdonotdiscloseenoughinformationfortheanalysisofmotivation,inthisstudywefocusonoriginalweibos,which occupy41%ofthetotal.Foreachofthe109highlyweiboedarticles,5originalweiboswererandomlyselected.Ifforan articlethenumberoforiginalweibosislessthan5,alloriginalweibosofthisarticlewerecollected.Asaresult,321original weibosweresampledandanalyzed.
Inthefirststep,wereferencedthecodingschemeofNa’swork(Na,2015)whenanalyzingmotivationfortweeting scholarlyarticlestoformabasicideaofthemotivationcategories.50weiboswerethencoded bythreecoders.After discussion,theinitialcodingschemewasformed.Inthesecondstep,another50weiboswerecodedusingtheinitialscheme. Theagreementratewas72%.Threecodersdiscussedagain,withaparticularfocusonthecodingdisagreementandpotential newcategories.Theinitialschemewasthenrevisedtothefinalversionofcodingscheme.Inthethirdstep,twocoderscoded all321weibos.Theagreementratewas87%.Thedisagreedweiboswerecodedagainbythethirdcoder.
Mainlythreeaspectsofweibocontentwereanalyzed.ThecodingschemaarepresentedinTables2–4.Allweiboswere manuallycoded.
Table3
Elementcodingscheme.
Code Definition
1Title Titleofthearticle 2Abstract Abstractofthearticle 3Methodology Methodologyofthearticle 4Conclusion Conclusionofthearticle
5Concept Termsorotherconceptsinthearticle
6Fragment Apieceofcontentinthearticle(anumber,afigureorasentence) 7Topic Maintopicofthearticle
8Summarize Briefsummarizationofthearticle 9Overall Generalfeelingofthearticle
10Indirectmention Mentionsindirectsources(e.g.,areporttalkingaboutthearticle) 11Purelink Mentionsnoelementofthearticle
Table4
Sentimentcodingscheme.
Code Description
1Neutral Whenweiboshowsnoclearpositiveornegativeattitudetowardsthearticle 2Positive Whenweiboshowsaclearpositiveattitudetowardsthearticle
3Negative Whenweiboshowsaclearnegativeattitudetowardsthearticle
Table5
RelativecoverageofWeibocomparedwithotheraltmetricssources.
Altmetrics No. Percentage Altmetrics No. Percentage Altmetrics No. Percentage Twitter 1308015 65.7% GooglePlus 48965 2.5% PeerReviews 9188 0.5% Facebook 347256 17.5% Policy 17638 0.9% Video 8293 0.4% Blogs 123656 6.2% Reddit 16300 0.8% Q&A 2983 0.2% Wikipedia 122309 6.2% F1000 11354 0.6%
News 119759 6.0% Weibo 10754 0.5%
criticizingspecificaspectsofthearticle;Marketingiswhenanarticleispraisedandrecommendedexplicitly;Triggering iswhenanarticleremindstheWeibouserofsomethingrelevant.(SeeTable2.)
(2) Element.ElementmentionedintheWeiboiscodedtodemonstratewhichpartofarticlesattractsthemostWeibo attention.(SeeTable3.)
(3) Sentiment.Sentimentoftheweibosindicateswhethertheuserhasapositive,neutral,ornegativeattitudetowardsthe articlementioned.(SeeTable4.)
3.8. Limitation
Thisstudyconsidersonlyarticlesamongallavailabletypesofresearchproducts,andheavilyreliesontheaccuracyof datacollectionbyAltmetric.com.However,AltmetricLLPiscurrentlytheonlyWeibotracker,andhasthemostprofessional articletrackingexperience(Zahedi,Fenner&Costas,2014).Therefore,thedatasetisconsideredcompleteandvalidenough toexploretheresearchquestions.
WhencalculatingtheimmediacyofWeiboaltmetrics,Altmetricpublicationdateisusedastheproxyofthefirstpublic onlineappearanceofVoR,becausethereishardlyasystematicwayofcollectingtheidealpublicationdate.Thisbottleneck awaitsbettersolutionbymakingvariousdatesreportedbypublishersmoretransparentandstandardized(Hausteinetal., 2015).
4. Results
4.1. CoverageofWeiboaltmetrics
Fig.2.ImmediacydistributionofWeiboaltmetrics.
4.2. ImmediacyofWeiboaltmetrics
Altmetricswasproposedtobemoreimmediatethancitations,whichusuallytakemonthsoryearstoaccumulate(Priem, Taraborelli,Groth,&Neylon,2010).Toconfirmthis,wedefinedandcalculatedtheimmediacyofWeiboposts,aswellas Twitterandthegeneralaltmetrics.ResultsareshowninFig.2.RegardingWeibo,Fig.2-AshowsthatWeiboaltmetricsis moreimmediatecomparedwithcitations,inthat69%ofarticleswithWeiboattentionarecapturedwithin180days.It’s highlightedthat44%ofarticlesinthedatasetgettheirfirstWeibopostinnomorethan7days,andparticularly,7%ofthem haveWeibopostspriortotheirformalpublication.Still,27%ofthearticlesreceivefairlylagged(Tpw>360days)Weibo
attention,implyingthatWeibousersalsodiscussoldarticles.ThegeneralaltmetricsrespondmoreslowlythanWeibo.As Fig.2-Billustrates,46%ofgeneralaltmetricshappenmorethan360daysafterpublishing.Thisimpliesthataltmetricssources havedifferentlevelsofimmediacy,andsomeofthemmaynotbeasimmediateasexpected.
Next,wecomparedtheimmediacyofWeibowithTwitter.InFig.2-C,itcanbeseenthatTwittersharesasimilarimmediacy distributionwithWeibo,reflectedinthat64%oftweetedarticlesarefirstlytweetedwithin180days,37%ofthemreceivetheir firsttweetwithin7days,andparticularly,12%aretweetedbeforeformalpublishing.Fig.2-Distheimmediacydistribution ofTwitterinabroadertimespan,showingaslightdropintimeintervalof[0,1]and(1,7],andabitofrisein[180,360]and (360,).Nevertheless,theshapeofthecurveisbasicallythesamewithFig.2-C,demonstratingthatthedistributionisstable andreflectsthenatureofTwitteraltmetrics.
4.3. DistributionofWeiboaltmetricsonthearticlelevel
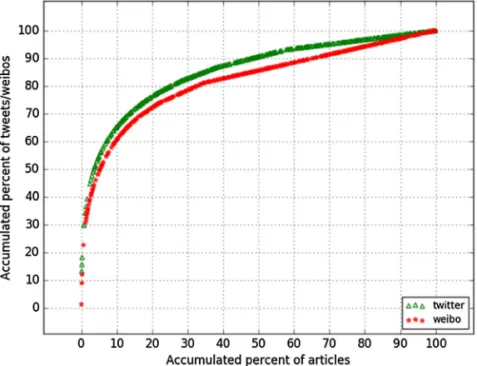
Fig.3.DistributionofWeibovs.Twitter.
Fig.4.DistributionofTwittervs.citation.
ofTwitteraltmetricsandcitation,usingScopuscitationdataandAltmetric.comdataoverthreeperiods(i.e.January2012, January2013andJanuary2014).Adetaileddescriptionofthedatasetcanreference(Yu,2016a).AsshowninFig.4,10%of journalarticlesaccumulateonlyaround42%oftotalcitations,and20%ofjournalarticlesaccountforabout61%ofoverall citations.Hence,theoverallskewnessofmicroblogaltmetricsishigherthancitations.
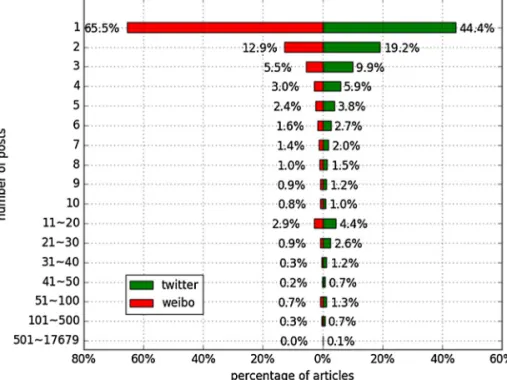
Fig.5.FrequencydistributionofWeibovs.Twitter.
Table6
Motivationcodingresult.
Code No. Percentage
1.1Dissemination−Interesting 18 5.6% 1.2Dissemination−Surprising 10 3.1% 1.3Dissemination−Academicallyuseful 11 3.4% 1.4Dissemination−Practicallyuseful 7 2.2% 1.5Dissemination−Linkonly 17 5.3% 1.6Dissemination−Perfunctoryintroduction 67 20.9% 1.7Dissemination−Requestforaccess 1 0.3%
1Overalldissemination 131 40.8%
2.1Discussion−Interesting 24 7.5% 2.2Discussion−Surprising 33 10.3% 2.3Discussion−Academicallyuseful 37 11.5% 2.4Discussion−Practicallyuseful 33 10.3% 2.5Discussion−Supportingaclaim 23 7.2% 2.6Discussion−Criticizing 3 0.9% 2.7Discussion−Responding 12 3.7%
2Overalldiscussion 165 51.4%
3.1Marketing−Self-promotion 3 0.9% 3.2Marketing−Otherpromotion 17 5.3%
3Overallmarketing 20 6.2%
4.1Triggering−Reuse 1 0.3%
4.2Triggering−Association 4 1.3%
4Overalltriggering 5 1.6%
4.4. ContentanalysisofWeiboaltmetrics
Resultsofthecontentanalysisofthetop1%ofweibosareshowninTables6,7and9.Inaddition,statisticalresultof howmotivationandelementco-occurisshowninTable8.
Table6showsthatthemostcommonmotivationforweiboinganarticleistodisseminatethisarticlebyprovidingbotha linkandsomeperfunctoryintroduction(code1.6,20.9%).Itisfollowedbytodiscussbyelaboratingtheacademicusefulness ofthearticle(code2.3,11.5%),todiscussbyelaboratingthepracticalusefulnessofthearticle(code2.4,10.3%)andtodiscuss byelaboratingthesurprisingpart(s)(code2.2,10.3%)orinterestingpart(s)(code2.1,7.5%)ofthearticle.Meanwhile,asmall percentageofmarketing(6.2%)andtriggering(1.6%)areobserved.Ingeneral,discussionisthemajormotivationcategory (51.4%).
Table7
Elementcodingresult.
Code NO. Percentage
1Title 19 5.9%
2Abstract 1 0.3%
3Methodology 18 5.6%
4Conclusion 73 23.1%
5Concept 1 0.3%
6Fragment 28 8.7%
7Topic 46 14.3%
8Summarize 17 5.3%
9Overall 9 2.8%
10Indirectmention 2 0.6%
11Purelink 106 33.0%
Table8
Distributionofmotivation-elementpair(NO.>3).
M. E. NO. Percentage M. E. NO. Percentage M. E. NO. Percentage 1.6 11 45 14.0% 2.3 8 9 2.8% 2.5 4 5 1.6%
2.4 4 25 7.8% 1.1 11 7 2.2% 2.3 3 4 1.3%
2.1 4 16 5.0% 2.3 7 7 2.2% 2.3 11 4 1.3%
2.2 6 15 4.7% 1.1 7 6 1.9% 2.1 7 4 1.3%
1.5 11 15 4.7% 2.5 11 6 1.9% 2.4 9 4 1.3%
1.6 1 14 4.4% 2.2 7 5 1.6% 1.2 7 4 1.3%
3.2 11 13 4.1% 2.5 3 5 1.6% 1.4 11 4 1.3%
2.2 4 11 3.4% 1.6 7 5 1.6% 1.3 3 4 1.3%
2.3 4 10 3.1% 1.2 6 5 1.6%
*M.ismotivation;E.iselement;NO.isthenumberofcombinationofM.andE.;Percentage.isthepercentageofthecombinationinallpossiblecombinations. Forthecodenumber,pleaserefertoTables6and7.
Table9
Sentimentcodingresult.
Sentiment NO. Percentage
1Neutral 272 84.7%
2Positive 43 13.4%
3Negative 6 1.9%
Table8showsthepatternofhowthemotivationcategoriesco-occurwiththeelementcategories.Itiscommontosee inweibosthatanarticlelinkwithperfunctoryintroductionco-occurwithnomentionofanyelementofthearticle(14%). Plentyofweibosdiscusstheconclusionsofthearticlebecausetheyarepracticallyuseful(7.8%)orinteresting(5%).Users alsomentionfragmentofcontentinthearticlebecausetheyfinditbeyondnormalexpectation(4.7%).
Table9showsthatmostofweibosareneutral(84.7%),certainpercentagearepositive(13.4%),andveryfewarenegative (1.9%).
4.5. DistributionofWeiboaltmetricsonthesourcelevel
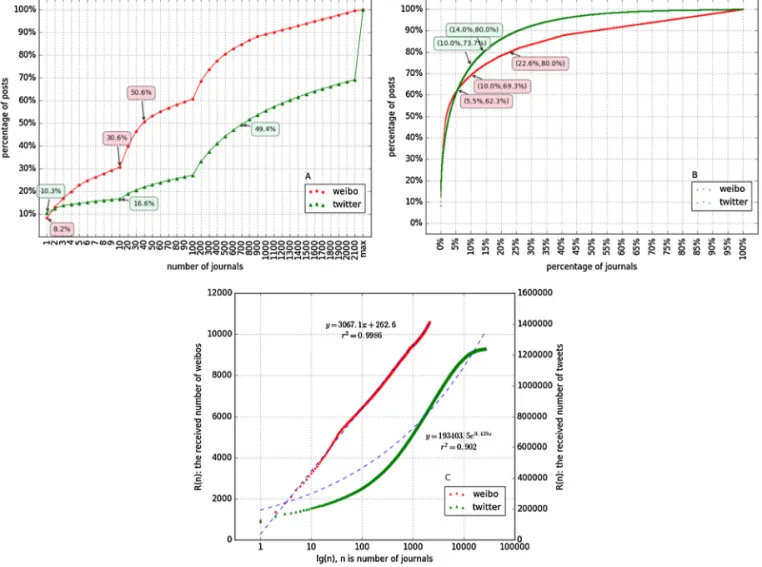
Fig.6.SourcedistributionofWeibovs.Twitter.
Table10
Topweiboedsourcesvs.toptweetedsources(top15).
No. weiboedsource Nw No. Tweetedsource Nt
1 Nature 866 1 arXiv 127413
2 arXiv 495 2 PLoSONE 25678
3 Science 421 3 SSRN 16308
4 Cell 319 4 Nature 6169
5 PNAS 308 5 PNAS 5916
6 NatureCommunications 205 6 Science(AAAS)News 5914
7 PLoSONE 165 7 BritishMedicalJournal(ClinicalResearchEdition) 5561 8 CellReports 160 8 ScientificReports 4716 9 NewEnglandJournalofMedicine 156 9 Science 4133 10 SSRN 152 10 AngewandteChemie.InternationalEdition 3809
11 MolecularCell 113 11 TheLancet 3342
12 JournalofClinicalOncology 112 12 NatureCommunications 3101 13 ScienceTranslationalMedicine 107 13 Figshare 2998
14 Neuron 99 14 JAMA 2939
15 TheLancet 99 15 PhysicalReviewLetters 2844
*Sharedtoppostedsourcesaredenotedinbold.
mentionedby10,606Weiboposts,while37,986sourceswerementionedby3.16milliontweets.Thenumberofboththe sourcesandpostsofWeiboweredwarfedbythoseofTwitter.
Fig.7.Overlappedjournalsofweiboed&tweetedjournals.
Shen,2011).AccordingtoTable10,CellgainshighattentiononWeibo,butnotequalattentiononTwitter,beingranked87th amongallthehighlytweetedjournals.OtherexamplesareScienceTranslationalMedicineandNeuron,whicharebothhighly mentionedonWeibobutmuchlessvisibleonTwitter.Ingeneral,multidisciplinaryjournalsandmedicalsciencesources getthemostattentiononWeibo.Twitteruserspaymuchattentiontochemicalsciencesources,forexample,Angewandte ChemieInternationalEdition(aGermanchemicaljournal)andJAMA.
Inaddition,aSpearman’srank-ordercorrelationwasruntodeterminetherelationshipbetweenthelistsofweiboed and tweetedsources.Intotal, 2414sourcesarementioned onWeibo;37986sourcesarementioned onTwitter.2006 sourcesarementionedbybothWeiboandTwitter.Thereisastrong,positivecorrelationbetweenthesetwolistofsources (rs(2006)=0.75,p=0.00).
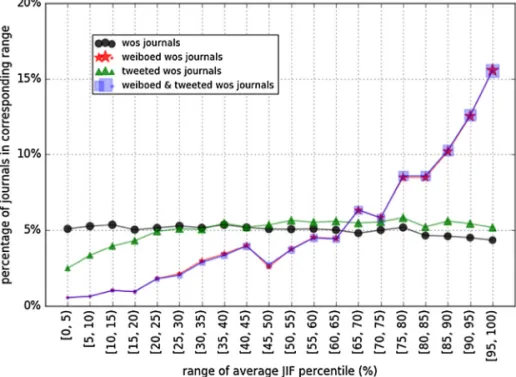
Asobservedabove,journalsthatarebothhighlyweiboedandtweetedhavehighImpactFactors.Toexplorethe relation-shipbetweenImpactFactorandtheattentiononbothWeiboandTwitter,wefirstexaminedhowmuchcommonjournals WeiboandTwitteruserspayattentionto.Fig.7showsthatlargely,around40%ofjournalsarebothweiboedandtweeted, regardlessofthenumberoftopjournalswelookat.Particularly,themosttopweiboedandtweetedarticlesoverlapeven more.WethenexaminedwhetherweiboedortweetedjournalshavehigherImpactFactors.TheaverageJIF(JournalImpact Factor)percentilereportedinJCR(JournalCitationReports)2015,designedformeasuringImpactFactorofjournalsacross field,isusedforcomparison’spurpose.Fig.8showsthattheaverageJIFpercentilesofthetweetedjournalsareevenly distributed,withapproximately5%ofthetweetedjournalsfallingoneachlevelofaverageJIFpercentile.Comparedwith Twitter,weiboedjournalshavetheiraverageJIFpercentilesmoreprevailinglyfallingonthehigherlevels.Forexample, morethan15%ofweiboedjournalshaveaverageJIFpercentileshigherthan95%.ThisindicatesthatWeibouserspaymore attentiontohigherimpactjournals,butTwitterusersdonothaveapreferenceonhighimpactjournals.
4.6. DistributionofWeiboaltmetricsonthedisciplinelevel
Therearesignificantdisciplinary differencesregardingcitationindicators.Comparisonbetweencitations ofphysics publicationsandthatofpsychologyones,forexample,canthusbemisleading.Weinvestigatethedisciplinarydifferencesof WeiboaltmetricsbasedonSs(seeMethodology,Section3.6).FromFig.9,weseethatthemostfrequentlyweiboedarticlesare
fromGeneraldisciplines(20.5%).ThismeansthatinterdisciplinarycontentgainsthemostattentionfromWeibo.Biochemistry, GeneticsandMolecularBiology(14.4%)isrankedthesecond.It’sfollowedbyHealthsciences(13.4%)andMedicine(13.2%), whichgetthethirdandfourthpositionrespectively.Thenextis“LifeSciences”,whichisrankedthefifth.Thesefivedisciplines arethemostfrequentlyweiboeddisciplines.Eachofthemhasapercentageover10%,andtheytogetheroccupy72.3%ofall theweiboedarticles.Thefollowingdisciplinesare“SocialSciences”(6.4%),“PhysicalSciences”(4.2%),“Neuroscience”(2.2%), “Psychology”(1.8%),“Economics,EconometricsandFinance”(1.7%),“AgriculturalandBiologicalSciences”(1.5%),and“Physics andAstronomy”(1.2%).These7disciplineshavepercentagesover1%andtogetheroccupy19.1%ofallweiboedarticles.The rest19disciplinesoccupytheremaining8.6%ofalltheweiboedarticles.
Fig.8. RelationshipbetweenImpactFactorandattentionfromWeibo/Twitter.
Fig.9. DisciplinedistributionofWeiboaltmetrics(basedonSs)..
discussextensivelyaboutHealthScienceandMedicineindicatesthatthesetwodisciplinesareofspecialinteresttousers ofmicroblogservices.Meanwhile,WeibouserspaythemostattentiontoGeneralandBiochemistry,GeneticsandMolecular Biology,showingChinesescientists’attentiontothesetwodisciplines.
WhilethedisciplinedistributionbasedonSsprovidesamacroview,thedistributionbasedonSpandSmprovidefurther
insightasshowninTable11.FromTable11,weseedisciplinedistributionsbasedonSpandSmarebasicallyinaccordance
withthatbasedonSs,butwithmoredetails.Forexample,undergeneral“BiologySciences”,itisfoundthat“Cellbiology”(8.6%, Sm#3),“Molecularbiology”(3.3%,Sm#6),and“Genetics”(1.1%,Sm#18)aremorementionedanddiscussedbyWeibousers.
Table11
Topweiboeddisciplines(basedonSpandSm).
N. Sp P. Sm P.
1 MedicalandHealthSciences 19.8% Science 28.7%
2 BiologicalSciences 11.5% Medicine 11.4%
3 Multidisciplinary 9.2% Cellbiology 8.6%
4 CognitiveScience 4.3% Neoplasms 5.3%
5 ClinicalSciences 4.0% Neurology 4.4%
6 Neurosciences 3.4% Molecularbiology 3.3% 7 OncologyandCarcinogenesis 3.3% Biology 2.4%
8 Psychology 3.1% Psychology 2.3%
9 PsychologyandCognitiveSciences 3.0% Allergyandimmunology 2.0% 10 PublicHealthandHealthServices 2.0% Biotechnology 1.6% 11 BiochemistryandCellBiology 1.8% Nutritionalsciences 1.6%
12 ChemicalSciences 1.7% Chemistry 1.5%
13 InformationandComputingSciences 1.5% Clinicallaboratorytechniques 1.4%
14 Immunology 1.2% Geneticsmedical 1.4%
15 PhysicalSciences 1.2% Endocrinology 1.3%
16 Engineering 1.2% Pediatrics 1.2%
17 Economics 1.0% Nanotechnology 1.1%
18 PoliticalScience 1.0% Genetics 1.1%
*Sp#1representsNo.1inSpcategory.
“SocialSciences”category,“CognitiveScience”(4.3%,Sp#4),“Psychology”(3.1%,Sp#8;2.3%,Sm#8),“Economics”(1%,Sp#17), and“PoliticalScience”(Sp#18)aremostfrequentlyweiboed.
5. Discussion
Thisisatype-Bstudy,whichpaysparticularattentiontohowinternationalresearchisdiscussedlocally.Thepapershows thattherelativecoverageofWeiboaltmetricsoverglobalscienceis0.5%.ThispercentageissimilartoPeerReview(0.5%), andhigherthanseveralglobalaltmetricssourceslikeVideo(0.4%)andQ&A(0.2%).However,itissignificantlydwarfedby Twitter(65.7%).Thisshowsdifferentlevelsofattentionbetweenalocalandaglobalmicroblogservice.Bycombiningour findingwiththepreviouslymeasuredabsolutecoverage,forexample,theTwittercoverageofPubMedarticles(Haustein etal.,2014c),theabsolutecoverageofWeibocanbeestimated.ChinesescholarshavebeencallingonestablishingChinese altmetricsinfrastructure.ThefullscholarlycommunicationactivenessofWeiboonbothdomesticandinternationalresearch shouldbemeasuredinthefuture.
Immediacycanbearelativeconceptaccordingtodifferentinterpretationsandresearchgoals.Comparedwiththecitation window,captureswithin180daysonWeibo areacceptabletobedefinedasimmediate.Thestudyshowsproofofthe immediacyofWeibo,Twitterandgeneralaltmetrics.69%ofweiboedarticlesreceivedtheirfirstweibowithin180daysof publication,44%werewithin7days,and7%werepriortoformalpublishing.Incontrast,64%oftweetedarticleshadtheir firsttweetwithin180days.
ThedistributionofWeiboaltmetricsis,comparedwithcitations,moreskewedonthearticlelevel,ismoreconcentrated onthesourcelevel,andpresentssignificantdifferencesonthedisciplinelevel.Specifically,20%ofweiboedarticlesare mentionedby70%oftheweibos.Theaveragenumberofweiboseacharticlereceivesis3.5,despitethefactthat84%ofthe weiboedarticlesreceivenomorethan3weibos.Twitterhasthissimilarpattern−20%oftweetedarticlesobtains77%of tweets.Eacharticlereceivesanaverageof6.2articles,and74%ofthetweetedarticleshadnomorethan3tweets.Thehigh skewnessindicatesthatWeiboaltmetricsisabletodistinguishfeaturedstudies.ThesourcedistributionofWeiboaltmetrics isconcentrated,evenmoresothanBradford’slawdistribution.ThisreflectsChina’sbiasedattentiontoprestigiousjournals, becauseChineseuniversitiesandinstitutionshaveunbalancedrewardsonpublicationsinthesejournals(Shao&Shen,2012; Hvistendahl,2013).Incontrast,Twitterusersdiscussmorediversesources,reflectedinthatFigshareisalsoamongthetop tweetedsources.Nevertheless,bothWeiboandTwitteruserspaymuchattentiontomedicalsources,whichindicatesthat medicalresearchisofsimilarlevelofinteresttoChinaandothernations.
6. Conclusion
Thestudy,basedonalarge-scaledataset,revealscharacteristicsofSinaWeiboasanimportantlocalaltmetricsplatform onwhichglobalscienceisdiscussed.WeconductedasystematiccomparisonbetweenWeiboandtheglobalmicroblogging platform,Twitter,aimingtodrawattentiontolocalaltmetricsindevelopingcountries,toinvestigatethecommonfeaturesof microblogaltmetrics,andtoshedlightonculturaldifferencesinscholarlycommunicationonthesesocialmediaplatforms. SinaWeibo,asalocalsocialmediaplatforminChina,ismeanwhiletheworld’ssecondlargestmicroblogservice.Weibo usersdiscussglobalsciencemoreactivelythanitisdiscussedonseveralglobalaltmetricssources.Beingachannelconnecting globalscienceandregionalcommunity,localsocialmediashouldbeconsideredasanintegralpartofthealtmetricslandscape. StrongevidenceshowsthatWeibo,aswellasTwitterandgeneralaltmetrics,havesignificantimmediacyadvantageover citations,endorsingearlierclaimsthataltmetricscanpotentiallydetectmorerealtimeimpactofresearchproducts.
ThehighlyskeweddistributionofWeiboandTwitteraltmetricsisnotsurprisingconsideringtheirnatureofsocialmedia (Banditwattanawong,Masdisornchote,&Uthayopas,2014;Jiang,Wang,Yang,&Li,2015).However,certaintypesofarticles, anumberofjournalsandspecificdisciplinesarefoundtoattractmoreWeiboattention.Thecommonmotivationsfor postingscientificweibosistodisseminateordiscussthearticlesbecausetheyareinteresting,surprising,academically useful,orpracticallyuseful.WeibouserspayparticularattentiononprestigiousjournalsbecauseoftheChineseacademic rewardsystem,whichhasbiasedawardsforpublicationsinthesejournals.Inaddition,discussionofarticlespublishedon importantopenaccessplatformsconfirmsChina’sacceptanceofnewformsofscientificcommunication.Whilefocusingthe mostonGeneraland“Biochemistry,GeneticsandMolecularBiology”,Weibousersshareinterestintopdiscusseddisciplines suchasHealthscience,MedicineandLifeScience,withTwitter.Thesedisciplineswithcomparativelyhighercoverageof altmetrics,aboveotherdisciplines,canmakeuseofsocialmediascholarlycommunicationandaltmetricstobetterachieve theirdevelopmentgoals.
Thisstudyconsidersonlyarticles.However,othertypesofresearchproductsalsomatter.Asaltmetricsstudiesevolve, researchershavenotedthatTwitteraccountsareofdifferentbackgrounds,forexample,automaticbots maintainedby individualsorinstitutions(Hausteinetal.,2016).Differentusercategoriesarealsoshowntohaveinfluenceonthevalueof tweets(Yu,2016b).Therefore,morecontentanalysistakingcontextinformationintoaccountisneeded,tofurtherreveal thenatureofWeiboandgeneralaltmetrics.
Acknowledgements
ThisresearchwassupportedbyChinaScholarshipCouncil(NO.201506270024)andsponsoredbyHumanitiesandSocial ScienceFoundationbytheMinistryofEducationofChina(16YJA870011)andtheResearchCenterofInformationTechnology &EconomicandSocialDevelopmentinZhejiangProvince.TheauthorsthankAltmetric.comforprovidingthedatasetand ProfessorJunpingQiuforhisinsightfulcomments.
AppendixA.
SeeTableA1.
TableA1
AbbreviationofScopusdisciplines
No. Abbv. FullName No. Abbv. FullName 1 AGRI AgriculturalandBiologicalSciences 16 HEALP HealthProfessions 2 ARTS ArtsandHumanities 17 HEALS HealthSciences
3 BIOC Biochemistry,GeneticsandMolecularBiology 18 IMMU ImmunologyandMicrobiology 4 BUSI Business,ManagementandAccounting 19 LIFES LifeSciences
5 CENG ChemicalEngineering 20 MATE MaterialsScience 6 CHEM Chemistry 21 MATH Mathematics 7 COMP ComputerScience 22 MEDI Medicine 8 DECI DecisionSciences 23 NEUR Neuroscience 9 DENT Dentistry 24 NURS Nursing
10 EART EarthandPlanetarySciences 25 PHAR Pharmacology,ToxicologyandPharmaceutics 11 ECON Economics,EconometricsandFinance 26 PHYSS PhysicalSciences
12 ENER Energy 27 PHYSA PhysicsandAstronomy 13 ENGI Engineering 28 PSYC Psychology
14 ENVI EnvironmentalScience 29 SOCI SocialSciences 15 GENE General 30 VETE Veterinary
References
Alperin,J.P.(2015).Geographicvariationinsocialmediametrics:ananalysisofLatinAmericanjournalarticles.AslibJournalofInformationManagement, 67(3),289–304.
AltmetricLLP.(2016).HowistheAltmetricAttentionSaltmetricattentionscorecalculated?https://goo.gl/nDKbCL
Araújo,R.F.,Murakami,T.R.M.,Lara,J.L.D.,&Fausto,S.(2015).DoestheGlobalSouthhavealtmetrics?analyzingaBrazilianLISjournal.Proceedingsof ISSI2015-15thinternationalconferenceoftheinternationalsocietyforscientometricsandinformetrics,111–112.
Banditwattanawong,T.,Masdisornchote,M.,&Uthayopas,P.(2014).Thesmartdistributionofsocialmediacontents.InElectricalengineeringcongress (iEECON)2014international(pp.1–4).
Brody,T.,&Harnad,S.(2006).Earlierwebusagestatisticsaspredictorsoflatercitationimpact.JournaloftheAmericanSocietyforInformationScienceand Technology,57(8),1060–1072.
Das,T.(2015).Measuringscholarlyuseofgovernmentinformation:Analtmetricsanalysisoffederalstatistics.GovernmentInformationQuarterly,32(3), 246–252.
Friedrich,N.,Bowman,T.D.,Stock,W.G.,&Haustein,S.(2015).Adaptingsentimentanalysisfortweetslinkingtoscientificpapers. https://arxiv.org/abs/1507.01967
Garfield,E.(1972).Citationanalysisasatoolinjournalevaluation.Science,1972(178),471–479. Garfield,E.(1998).Randomthoughtsoncitationologyitstheoryandpractice.Scientometrics,43(1),69–76.
Haustein,S.,Bowman,T.D.,Macaluso,B.,Sugimoto,C.R.,&Larivière,V.(2014).MeasuringTwitteractivityofarXive-printsandpublishedpapers. https://dx.doi.org/10.6084/m9.figshare.1041514.v1
Haustein,S.,Peters,I.,Bar-Ilan,J.,Priem,J.,Shema,H.,&Terliesner,J.(2014).Coverageandadoptionofaltmetricssourcesinthebibliometriccommunity. Scientometrics,101(2),1145–1163.
Haustein,S.,Peters,I.,Sugimoto,C.R.,Thelwall,M.,&Larivière,V.(2014).Tweetingbiomedicine:Ananalysisoftweetsandcitationsinthebiomedical literature.JournaloftheAssociationforInformationScienceandTechnology,65(4),656–669.
Haustein,S.,Bowman,T.D.,&Costas,R.(2015).Whenisanarticleactuallypublished?Ananalysisofonlineavailability,publication,andindexationdates. https://arxiv.org/abs/1505.00796
Haustein,S.,Bowman,T.D.,Holmberg,K.,Tsou,A.,Sugimoto,C.R.,&Larivière,V.(2016).Tweetsasimpactindicators:examiningtheimplicationsof automatedbotaccountsonTwitter.JournaloftheAssociationforInformationScienceandTechnology,67(1),232–238.
Holmberg,K.,&Thelwall,M.(2014).DisciplinarydifferencesinTwitterscholarlycommunication.Scientometrics,101(2),1027–1042. Hvistendahl,M.(2013).China’spublicationbazaar.Science,342(6162),1035–1039.
ImpactStory.(2016).Let’svaluethesoftwarethatpowersscience:Introducingdepsy.http://blog.impactstory.org/introducing-depsy
Jiang,B.,Wang,L.,Yang,C.,&Li,R.(2015).Miningmultiplexpower-lawdistributionsandretweetingpatternsonTwitter.Fuzzysystemsandknowledge discovery(FSKD),201512thinternationalconference,1437–1443.
Kolahi,J.(2015).Altmetrics:Anewemergingissuefordentalresearchscientists.DentalHypotheses,6(1),1–5.
Kousha,K.,Thelwall,M.,&Abdoli,M.(2012).Theroleofonlinevideosinresearchcommunication:AcontentanalysisofYouTubevideoscitedinacademic publications.JournaloftheAmericanSocietyforInformationScienceandTechnology,63(9),1710–1727.
Kraker,P.,Lex,E.,Gorraiz,J.,Gumpenberger,C.,&Peters,I.(2015).ResearchdataexploredII:TheanatomyandreceptionofFigshare. http://arxiv.org/abs/1503.01298
Liu,J.,Konkiel,S.,&Williams,C.(2015).UnderstandingtheimpactofresearchonpolicyusingAltmetricdata.[RetrievedDecember29,2016,from http://figshare.com/articles/Understandingtheimpactofresearchonpolicyusing Altmetricdata/1439723]
Liu,B.(2012).Grass-rootpopularscienceinthecontextofnewmediumera:Anamateurauthor’sunderstandingsandexperienceofpopularscience writing.SciencePopularization,6,4–9.
Loach,T.V.,&Evans,T.S.(2015).Rankingjournalsusingaltmetrics.http://arxiv.org/abs/1507.00451
Moed,H.F.(2015).Altmetricsastracesofthecomputerizationoftheresearchprocess.https://arxiv.org/abs/1510.05131
Mohammadi,E.,&Thelwall,M.(2013).Assessingnon-standardarticleimpactusingF1000labels.Scientometrics,97(2),383–395.
Na,J.C.(2015).Usermotivationsfortweetingresearcharticles:Acontentanalysisapproach.Proceedingsofthe17thinternationalconferenceonasian digitallibraries,197–208.
Peters,I.,Jobmann,A.,Eppelin,A.,Hoffmann,C.P.,Künne,S.,&Wollnik-Korn,G.(2014).Altmetricsforlarge,multidisciplinaryresearchgroups: comparisonofcurrenttools.Bibliometrie-PraxisUndForschung,3(1),1–19.
Peters,I.,Kraker,P.,Lex,E.,Gumpenberger,C.,&Gorraiz,J.(2015).Researchdataexplored:Citationsversusaltmetrics.https://arxiv.org/abs/1501.03342 Poplaˇsen,L.,&Zrni ´c,L.(2014).Altmetrics−newmetricsanditsapplicationinCroatia.InLibrariesinthedigitalage(LIDA)proceedings
http://ozk.unizd.hr/proceedings/index.php/lida/article/view/132
Priem,J.,Taraborelli,D.,Groth,P.,&Neylon,C.(2010).Altmetrics:Amanifesto.http://altmetrics.org/manifesto/ Priem,J.(2013).Scholarship:Beyondthepaper?Nature,495(7442),437–440.
Qiu,J.P.,&Yu,H.Q.(2015).SomebasicproblemsinadvancingthedevelopmentofAltmetrics.TheJournalofLibraryScienceinChina,41(1),4–15,in Chinese.
Rehemtula,S.,Rosa,M.,Leitão,P.,&Avilés,R.(2014).Altmetricsininstitutionalrepositories:newperspectivesforassessingresearchimpact.InLibraries inthedigitalage(LIDA)proceedingshttp://ozk.unizd.hr/proceedings/index.php/lida/article/view/141
ScienceOpenGmbH.http://goo.gl/GzTP5o
Seglen,P.O.(1992).Theskewnessofscience.JournaloftheAmericanSocietyforInformationScience,43(9),628.
Shao,J.F.,&Shen,H.Y.(2011).TheoutflowofacademicpapersfromChina:whyisithappeningandcanitbestemmed?LearnedPublishing,24(2),95–97. Shao,J.F.,&Shen,H.Y.(2012).Researchassessmentandmonetaryrewards:theoveremphasizedimpactfactorinChina.ResearchEvaluation,21(3),
199–203.
Shema,H.,Bar-Ilan,J.,&Thelwall,M.(2012).Researchblogsandthediscussionofscholarlyinformation.PLoSOne,7(5),e35869.
Shema,H.,Bar-Ilan,J.,&Thelwall,M.(2014).Doblogcitationscorrelatewithahighernumberoffuturecitations?Researchblogsasapotentialsourcefor alternativemetrics.JournaloftheAssociationforInformationScienceandTechnology,65,1018–1027.
Tammaro,A.M.(2014).Altmetricsinthehumanities:PerceptionsofItalianscholars.InLibrariesinthedigitalage(LIDA)proceedings http://ozk.unizd.hr/proceedings/index.php/lida/article/view/167
Thelwall,M.,&Kousha,K.(2015).ResearchGate:Disseminating,communicating,andmeasuringscholarship?JournaloftheAssociationforInformation ScienceandTechnology,66(5),876–889.
Thelwall,M.,&Wilson,P.(2015).Mendeleyreadershipaltmetricsformedicalarticles:ananalysisof45fields.JournaloftheAssociationforInformation ScienceandTechnology,http://dx.doi.org/10.1002/asi.23501
Thelwall,M.,Tsou,A.,Weingart,S.,Holmberg,K.,&Haustein,S.(2013).Tweetinglinkstoacademicarticles. http://citeseerx.ist.psu.edu/viewdoc/download?doi=10.1.1.385.6234&rep=rep1&type=pdf
Torres,D.,Cabezas,A.,&Jiménez,E.(2013).Altmetrics:Newindicatorsforscientificcommunicationinweb2.0.http://arxiv.org/abs/1306.6595 Vickery,B.C.(1948).Bradford’slawofscattering.JournalofDocumentation,4(3),198–203.
Wang,Y.,Guo,S.,&Zhang,J.(2015).Studyoncorrelationofresearcherinfluenceindicators.LibraryandInformationService,5(5),29–38. Yu,H.Q.(2016a).ContextofAltmetricsdatamatters:Aninvestigationofcounttypeandusercategory.Scientometrics,
http://dx.doi.org/10.1007/s11192-017-2251-z
Zahedi,Z.,Costas,R.,&Wouters,P.(2014).Howwelldevelopedarealtmetrics?Across-disciplinaryanalysisofthepresenceof‘alternativemetrics’in scientificpublications.Scientometrics,101(2),1491–1513.
Zahedi,Z.,Fenner,M.,&Costas,R.(2014).Howconsistentarealtmetricsproviders?Studyof1000PLOSONEpublicationsusingthePLOSALM,Mendeleyand Amendeleyaltmetric.comAPIs.https://dx.doi.org/10.6084/m9.figshare.1041821.v2