Emma C. Boettcher. Predicting the Difficulty of Trivia Questions Using Text Features. A Master’s Paper for the M.S. in I.S. degree. April, 2016. 70 pages. Advisor: Stephanie W. Haas
In numerous contexts, including community question answering systems, school exams, and trivia competitions, a need to assess the difficulty of questions arises. This study examines what features predict difficulty in the realm of trivia questions, considering features related to readability and the question’s topic as potential contributors. Using clues from the game show Jeopardy!, the study finds that features relating to a trivia question’s length, the inclusion of audiovisual media, and its constituent noun and verb phrases have a significant impact on the clue’s difficulty. Based on these findings, this study proposes that finding more nuanced ways to depict the amount of information in a trivia question would lead to further advancements.
Headings:
Text mining (Information retrieval) Question-answering systems Text categorization
PREDICTING THE DIFFICULTY OF TRIVIA QUESTIONS USING TEXT FEATURES
by
Emma C. Boettcher
A Master’s paper submitted to the faculty of the School of Information and Library Science of the University of North Carolina at Chapel Hill
in partial fulfillment of the requirements for the degree of Master of Science in
Information Science.
Chapel Hill, North Carolina April 2016
Approved by
Table of Contents
Table of Contents... 1
Introduction... 2
Literature Review... 6
Readability ... 6
New event detection ... 8
Novelty detection and similarity ... 9
Question answering ... 11
Trivia ... 14
Methods... 17
Feature generation ... 21
Experiments... 27
Results... 31
Unigram threshold... 31
Readability features... 32
Topic features... 34
Discussion ... 36
Conclusion ... 46
Appendix A... 48
Appendix B ... 50
Appendix C ... 52
Appendix D... 55
Appendix E ... 58
Appendix F... 59
Introduction
Questions asked by people seeking information take many forms, depending on
the asker, the audience, and the information sought. A question that addresses common
knowledge may regardless be expressed complexly, if the person asking does not have
enough information to communicate precisely. Conversely, a question about a more
obscure piece of information may be expressed clearly if the person asking is otherwise
an expert. Questions may even be designed to be difficult, as with trivia questions or
questions on exams, in order to learn about or reward those who respond correctly
(Heilman, 2011).
Though many contexts exist in which questions’ difficulty levels might be
manipulated, the context explored by this paper is that of writing trivia questions, which
require their answerers to recall information but may not require any higher cognitive
function. These questions, while they may be addressed toward an individual, known
audience, are often addressed to a group audience whose levels of knowledge are mixed
or otherwise unknown. Trivia-based board games, quiz nights, and game shows all rely
on human estimates of what makes a question difficult or easy for an unknown audience.
difficulty ratings of trivia clues (what the show terms “answers,” though they are more
similar to other contexts’ trivia “questions”), rewarding contestants with more money if
they respond correctly to more difficult questions. In this dataset, the clues are clearly
assigned labels as to their difficulty levels, with each label having required an individual
human judgment of the clue’s difficulty.
Though these human evaluations of difficulty are commonplace, it is more
challenging to automatically assess difficulty through machine learning. This problem is
most commonly addressed by community question answering systems, though those
solve the slightly different problem of matching a user’s profile to a question. The system
can learn about what questions the user has previously answered, and use that
information to recommend recently submitted questions based on the user’s perceived
knowledge base. However, even in these question answering systems, information about
the users is not always available (particularly for new users). In addition, experts prefer to
answer questions without good answers because the harder it is to answer a question, the
more valuable their answer is (Pal & Konstan, 2010). Giving experts questions that are
determined to be difficult relative to the knowledge level of the community, rather than to
the knowledge level of specific users, can promote engagement (Pal & Konstan, 2010).
Estimating the difficulty of questions with regard to an unknown community can also
provide information on the users who answer them by demonstrating the users’ behavior
2013). Learning more about what makes a question objectively difficult therefore may
have broader implications beyond creating questions for trivia games.
In order to study what features contribute to trivia clue or question difficulty, two
possible underlying factors are studied: readability (or the form of a question) and topic
(or the content or subject of a question). Readability addresses how much cognitive effort
is required to make sense of the form of a question. Literature on using text mining to
predict readability suggests that features such as the rarity of a word in a corpus, the
syntactic structure of a document (its phrases, clauses, and parts of speech), and the
presence of specific vocabulary may contribute toward readability. Difficult syntax,
complicated or unfamiliar terminology, and overly long phrases, sentences or documents
can make readers perceive a text as difficult. Though media is not often addressed when
considering readability, in this study, the use of video, audio, and image files are grouped
with readability as it relates to the form (non-verbal) of the trivia question or clue being
studied.
Another contributor to the difficulty of a trivia question or clue is the subject of
the information need, which is operationalized in this study by assigning clues to topics
and determining whether a clue represents a new topic. Novelty detection, new topic
detection and other fields provide framework for this endeavor, as newer, more obscure
topics may be found in more difficult clues. Examining latent features such as the novelty
difficulty level. If a topic is very new, and therefore rarely asked about, the knowledge in
it is likely expert level. In contrast, if a topic is asked about frequently, the frequency of
the information need perhaps counter-intuitively demonstrates that the need may be at the
novice level. In a community question answering system, novices may submit more
questions than experts; in the dataset of trivia clues, topics that appear over and over
again may reflect the opportunity its audience has had to become familiar with the topic.
Recording the topic (or topics) of each trivia clue shows how these topics and their
representation in the dataset affect its perceived difficulty level.
Using text mining, this paper addresses whether those two groups of features,
readability and topic, can predict whether a trivia clue is considered easy or difficult.
Using clues from the game show Jeopardy!, which rates the difficulty of its clues on a
five-point scale, these features are used to answer the following research questions:
Research Question 1: What text features predict difficulty for fact-finding questions?
Research Question 2: How do features associated with readability contribute to
predictions of difficulty for fact-finding questions?
Research Question 3: How does the topic of an information need contribute to
Literature Review
Readability
In the field of education, readability can be calculated on an ordinal scale which reflects how children learn to read, such as the Flesch-Kincaid scale. Readability is often therefore only considered in the context of documents for children (Paukkeri, Ollikainen & Honkela, 2013). However, even though a document may not be meant for children, as is the case for clues in the Jeopardy! corpus, its text may occupy any number of
readability levels. These levels, though, are also interpreted differently throughout the literature. Researchers often propose variations on these readability scales without attempting to precisely pinpoint readability. Liu, Croft, Oh & Hart (2004), instead of testing whether their classifier can correctly predict the exact readability, divided reading levels into two or three broad categories at opposite ends of the scale and evaluated if their classifier could predict the correct category. Further reducing the need for an exact scale, Tanaka-Ishii, Tezuka, & Terada (2010) predicted the difficulty of documents relative to each other without attempting to rank absolute readability. With this in mind, exact readability is not computed for any clue in this study, but the features that predict readability are assessed for each document.
particularly the frequency of n-grams in a document in comparison to other documents. Syntactic features, on the other hand, relate to the structure of a document and the words within it. Liu et al. placed sentence length, average number of characters per word, average number of syllables per word, and the distribution of different parts of speech in this syntactic category. Subsequent work attempts to isolate which of these features are the most predictive of readability. Tanaka-Ishii et al. (2010) modeled only a document’s vocabulary and ignored length altogether when developing a model that predicted relative readability of two documents. Though their model was successful in predicting relative readability, it did not output absolute readability evaluations. However,
Collins-Thompson & Callan (2005) also used unigram features (including stopwords) to predict the absolute readability of a document, obtaining a low root mean squared error.
Feng, Jansche, Huenerfauth & Elhadad (2010) divided their features into six sets: discourse features (such as presence of named entities, synonyms in lexical chains, resolved coreferences), language modeling that removes words with a low information gain, syntactic features (such as number of phrases, average phrase length and average number of phrases per sentence), shallow features (usually relating to words per sentence or number of syllables per word), perplexity features, and part-of-speech features. They divided parts of speech into content words (nouns, verbs, numbers, adjectives, adverbs) and function words to analyze their impact on prediction, observing that part-of-speech features, particularly nouns, are the strongest predictors of readability, though they
suggested that discourse level features may be more useful when texts are more complex. Based on these findings, certain features from the readability literature are
the threshold for how many documents a unigram needs to appear in to be included as a feature is also evaluated at three levels, in order to capture somewhat how the rareness of a word affects difficulty predictions. (As seen in the next section, the unigrams are assigned binary weights, though inverse document frequency weights would likely also prove fruitful.) In addition, features relating to the length of the clues are used, as in Liu et al. (2004), and features relating to noun and verb phrases, since nouns are considered the most salient parts of speech for predicting readability.
New event detection
In addition to considering readability features, this study also examines how the presence of new topics or new information affects difficulty predictions. Measuring a new fact in a corpus is analogous to detecting a new event in a news stream. In both instances, a document is being compared to what already exists in order to determine the amount of new information it contains. Most new event detection systems use temporal features and sudden increases of relevant information (text “burstiness”) as features to inform the system, but these features may be less useful when analyzing fact-finding questions, particularly fact-finding questions which are designed to be difficult and not repeat answers too often, as in the Jeopardy! corpus (McCown, 2015). However, new event detection systems also measure similarity between topics. In addressing news streams, Kumaran & Allen (2005) used cosine similarity based on names, topics, and the entire document to predict whether a document represents a new event. They concluded that this model performs well for predicting whether a document is part of an older news story, though it is less successful for predicting a new topic. Topics are therefore
Novelty detection and similarity
Novelty detection is a specific problem that looks at whether a document contributes new information to existing documents. Usually expressed in terms of a binary classification (a document either contributes new information or it does not), the task has seen progress despite the fact that human annotators struggle to agree on what constitutes new information. Otterbacher & Radev (2006) found that human annotators could usually agree on what constituted relevant information for a topic but agreed less often about whether a piece of information constituted new information for a particular information need. This apparent disparity between topic and information is reflected in the balance of research; more has been done about topic similarity and new topics than new information itself, suggesting that modeling a clue’s topic would be more fruitful for this study than addressing whether it contains new information.
More success has been found in augmenting the vocabulary used in a document in order to increase the accuracy of predictions of semantic similarity. Two major toolkits exist: the Stanford GloVe system, which computes the cosine similarity between word vectors and automatically determines their similarity, and WordNet, a manually created corpus that defines synonyms and hypernyms (that is, words of a which a given word is a subset) of each word the corpus (Pennington, Socher & Manning, 2014). GloVe system is considered state-of-the-art for detecting paraphrases. Karampatsis (2015) used GloVe to evaluate existing potential paraphrases was able to accurately predict when one Tweet paraphrased another. Similarly, Sanborn & Skryzalin (2015) used the Stanford NLP GloVe system to evaluate the semantic similarity of statements. However, in research more closely related to this study, WordNet has been used to create paraphrases, instead of simply evaluate them. Petrović, Osborne & Lavrenko (2012) used WordNet to
paraphrase their documents, considering all words in a synset as candidates to paraphrase any given word. This method improved over a baseline method to detect new events from documents. Li & Manandhar (2011) combined WordNet paraphrases with unigram features in order to measure similarity in question answering systems. Paraphrasing documents, no matter what toolkit, allows researchers to look at the information need itself instead of the language used to express it. For this paper, creating paraphrases allows the distinction between readability of the question (operationalized through unigrams) and newness of the underlying information need.
individual words occupying dimensions and being weighted by term frequency, term frequency-inverse document frequency (TF.IDF), or even binary weights. This approach is computationally expensive to do for all documents in a large corpus (Karkali,
Rousseau, Ntoulas & Vazirgiannis, 2013). The alternative is to model the topics of the documents using a probabilistic model and then compare the topics of new documents to those topics (Aksoy, Can & Kocberber, 2012; Wanas, Magdy, & Ashour, 2009).
Question answering
in community question answering research is the representation of users, the representation of text may be as important.
Many studies on community question answering systems use topic modeling to detect a new question’s similarity to older ones. Duan, Cao, Lin & Yu (2008) proposed modeling the similarity of questions based on their topic and focus. With a similar motivation, many studies use the categories that have been assigned to the question as a feature or as a criterion for feature selection (Cai, Zhou, Liu, & Zhao, 2011; Zhou, Chen, Zeng & Zhao, 2013; Zhou, Li, King, Lyu, Song, & Cao, 2011). Nomoto (2010), while working in novelty detection, addressed the information a document’s collection provides in addition to the information in a document itself, showing that information from both the collection and the document can assist in detecting similarity. Adding additional information to reduce the number of features and address the focus of the question specifically is important for long queries, but short queries need to be augmented with other information (Zhou, Lai, Liu & Zhao, 2012).
identical), useful (relevant), and neutral (not related to the information need). In this case, both paraphrases and useful questions provide information on the novelty of the question in the corpus.
With regard to these finds, this study assigns its clues to topics created using other clues not in the dataset, and creates and assigns topics based on a clue’s text, its category, and the correct response. In addition to using this text, the study also tests three different variants on building topic models: topic classification using the original clue text, topic classification using the original clue text expanded with hypernyms, and topic
classification using the original clue text expanded with synonyms. These hypernyms and synonyms are obtained using WordNet, since it has been previously used to paraphrase documents to detect topic similarity. A clue’s membership in topics and the number of topics it could plausibly belong to are used as approximations for the clue’s overall obscurity.
Trivia
Question answering systems may comprise a variety of questions, but this study only addresses trivia questions, using specifically clues from the game show Jeopardy! While the nuances of this dataset are discussed in the Methods section, it is worthwhile to discuss how scholars and trivia writers alike differentiate levels of difficulty. A common taxonomy of cognitive processes separates learning objectives into six levels:
remembering, understanding, applying, analyzing, evaluating, and creating (Krathwohl, 2002). Remembering requires a person to recall details or facts, but understanding involves making inferences from established facts, among other processes. Both of these processes appear in the dataset, and are discussed below, but the higher levels of learning objectives discussed by Krathwohl are more complicated than the ones summoned when responding to trivia questions.
These two simplest processes, however, are further broken down by trivia experts and writers. Jennings (2007) described a nine-part taxonomy of trivia, of which the key attributes are how answerable and entertaining a question or clue may be. Though some of these categories overlap, Jennings (2007) isolated three categories of interest for this study: the plain vanilla recall, plain vanilla with hot fudge, and the puzzler. The baseline for a trivia question or Jeopardy! clue, Jennings explains, is the “plain vanilla recall,” where the answerer will either know the answer or not (Jennings, 2007, p. 113). One example is the following clue, which appeared on Jeopardy! in 1989:
AIRPORT DESIGNATIONS $1000: DTW (Detroit)1
1 This paper formats clues as they appear in online Jeopardy! archives and discussion
The simplicity of these questions can easily become repetitive or boring, so where trivia is meant to entertain, the clue can be expanded with inessential facts - the “hot fudge” to the original question’s vanilla (Jennings, 2007, p. 113). Seventeen years later, the same information as above was used again on Jeopardy!:
AIRPORT CODES $1000: Its McNamara Terminal is also the Northwest Airlines World Gateway: DTW (Detroit)
A few might know the McNamara Terminal or the Northwest Airlines World Gateway, but this additional information mainly prevents repetition and makes the clue less dry. Jennings did not discuss the impact of this additional information on the clue’s level of difficulty, though according to the show, the clue is considered to be the most difficult of its category (as indicated by its being worth $1000) regardless of the additional
information provided.
Most of Jennings’ taxonomy further focuses on these factual recall clues that fit into the first level of Krathwohl’s taxonomy, but the last category Jennings described is that of the “puzzler,” which “nobody knows the answer to” but can be deduced with enough peripheral trivia knowledge and a logical inference (Jennings, 2007, p. 116). Most closely corresponding to the “understand” level of Krathwohl’s taxonomy, this plays out in Jeopardy! clues such as the following:
$800 GO GREYHOUND: Dedicated to the adoption of ex-racing greys, First State Greyhound Rescue places dogs in N.J., Penn. & this state (Delaware) First State Greyhound Rescue, according to this clue, only operates in three states, so the likelihood that any contestant would have heard of it and know the extent of its
person still has to know what the first state is in order to respond to the clue correctly, so the clue is predicated both on the “remember” and “understand” levels of cognition. While trivia mainly focuses on remembering pieces of information (with or without bonus material accompanying the main part of the clue) it does also occasionally require people to make inferences from the information they can recall, especially where the goal is to entertain.
Methods
The research questions for this paper are restated here:
Research Question 1: What text features predict difficulty for fact-finding questions?
Research Question 2: How do features associated with readability or the form of
a question contribute to predictions of difficulty for fact-finding questions?
Research Question 3: How does the topic of an information need contribute to
predictions of difficulty for fact-finding questions?
are assigned a value before contestants wager on them, the Final Jeopardy! clue is not assigned a value and therefore has no implied difficulty level.
Clues from Jeopardy! are available from the J! Archive.2 As of March 13, 2016, the J! Archive consists of 301,463 clues, which are organized into 5,211 games as they originally appeared on the show. The show number and airdate are recorded for each game. A clue’s text, correct response category, original value, and actual value (if it is a Daily Double) is recorded, as well as information about which contestants responded to the clue and if they did so correctly. Within the clue’s text, there may also be links to media materials that were presented with the clue and are stored in the J! Archive.
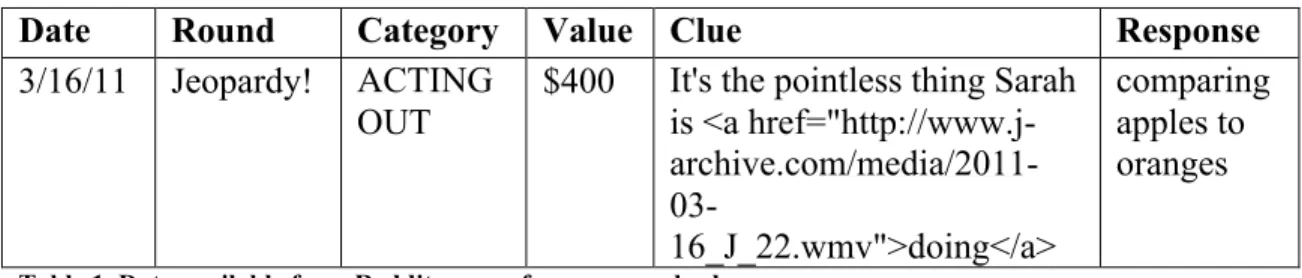
In January 2014, the J! Archive was scraped, and a file of 216,930 clues from 3,640 games was posted on Reddit. In this scrape, the text of the clue (including links to media materials) is recorded, along with the show number, airdate, category, and correct response, as shown in Table 1.
Date Round Category Value Clue Response
3/16/11 Jeopardy! ACTING
OUT $400 It's the pointless thing Sarah is <a href="http://www.j- archive.com/media/2011-
03-16_J_22.wmv">doing</a>
comparing apples to oranges
Table 1. Data available from Reddit scrape for an example clue.
Though the scrape does not include all data from the J! Archive, it contains sufficient information and its convenient format made it an ideal source of clues for the study.
From this scrape, a narrower selection of clues was used as the dataset for this study. The selection needed to capture a uniform selection of clues, while still
maintaining a large enough scope so that patterns of difficult clues or obscure topics could emerge. In order to achieve these goals, the dataset consisted of clues from only
two seasons (from 9/14/2009 to 7/29/2011) from the scrape. Including multiple seasons worth of clues allowed for the possibility that topics could be reused, but limiting the dataset to two seasons minimized any variations in clue writing or language that might have occurred over the course of the show.
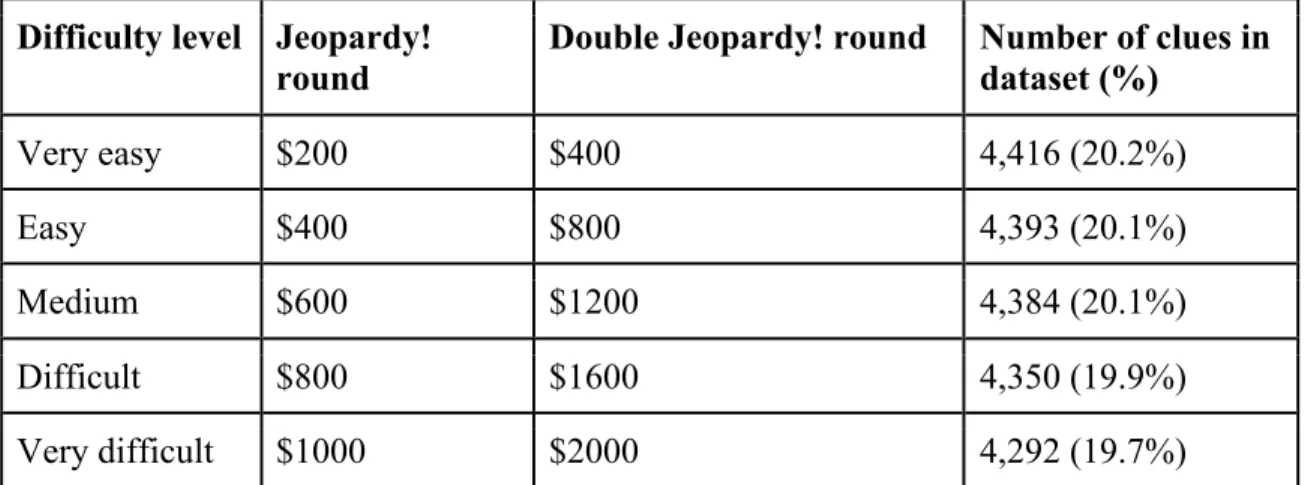
After the two seasons were selected from the scrape, additional clues were removed from the dataset to make it more uniform. Within those two seasons, a number of tournaments were held for specialized contestant groups (including teens, college students, and returning multi-day champions), but clues from these groups were also removed from the dataset in order to minimize variations in clue difficulty assignments. Similarly, clues that did not require the contestant to remember information but instead solely required the contestant to perform a higher cognitive function were also removed to make the assignments of clue difficulty more consistent. (A list of these clues, all of which involved solving math problems, can be found in Appendix A.) Finally, clues that originally had had no difficulty value assigned to them (those in the Final Jeopardy! round and end-of-game tiebreaker clues) were also removed from the dataset.
Difficulty level Jeopardy!
round Double Jeopardy! round Number of clues in dataset (%)
Very easy $200 $400 4,416 (20.2%)
Easy $400 $800 4,393 (20.1%)
Medium $600 $1200 4,384 (20.1%)
Difficult $800 $1600 4,350 (19.9%)
Very difficult $1000 $2000 4,292 (19.7%)
Table 2. Difficulty levels of clues and their proportion in the dataset.
Date Round Category Value Clue Response Difficulty
3/16/11 Jeopardy! ACTING
OUT $400
It's the pointless thing Sarah is <a href="http://ww
w.j-archive.com/med ia/2011-03-16_J_22.wmv"> doing</a>
comparing apples to oranges
easy
Table 3. Example clue with its assigned difficulty level.
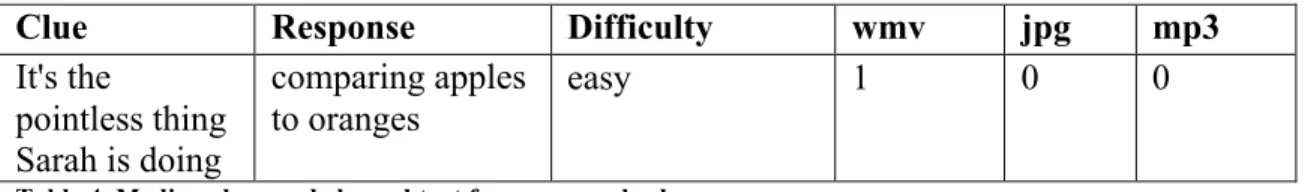
recorded in the metadata for this study as a .wmv file. An example clue and its media values are shown in Table 4.
Clue Response Difficulty wmv jpg mp3
It's the
pointless thing Sarah is doing
comparing apples
to oranges easy 1 0 0
Table 4. Media values and cleaned text for an example clue.
Feature generation
Once the clues were cleaned and their values were normalized, features for each clue were generated. Five groups of features were generated for each clue: unigrams, length, media, phrase, and topic. As described in the literature review, these features were thought to have some correlation with the difficulty of a clue.
Unigrams were generated using the LightSide text mining software.3 Three versions of the set of unigrams were created based on the number of clues a unigram appeared in within the dataset:
• unigrams1: All unigrams that appeared in at least one clue (in effect, all unigrams
in the dataset)
• unigrams5: All unigrams that appeared in at least five clues, but excluding
unigrams that only appeared in four or fewer clues
• unigrams10: All unigrams that appeared in at least ten clues, but excluding
unigrams that only appeared in nine or fewer clues
For each version of unigrams, the unigrams were assigned binary weights. Since the clues are short, the frequency of a given term in any clue is relatively small, so term frequency weights were not considered. Though inverse document frequency weights would have
indicated a word’s rareness in the corpus, binary weights were judged to be sufficient based on the literature.
Since each clue may contain references to media files, the references were stored as metadata for the clue, as previously described. Occasionally these references included descriptions of what was present in the media (e.g., “Kelly of the Clue Crew shows a map on the monitor” to describe the content of a video), but these descriptions were removed so that the text of the clue only consisted of the actual wording given to the contestants. The number of pictures (.jpg files), videos (.wmv files), and audio files (.mp3 files) presented to the contestants within clue was stored for each clue.
Length was also considered as a predictor of clue difficulty. The length of each clue was measured in three ways: characters, syllables, and words. Syllables were counted using the Carnegie Mellon University Pronouncing Dictionary in the Python Natural Language Toolkit (NLTK). This dictionary assigns the second halves of contractions their own syllables, though as in the following example, this adds an extra syllable to the sentence.
It • 's • the • point • less • thing • Sar • ah • is • do • ing 11 syllables Words not in the CMU dictionary were handled by counting the number of
synonyms; where the use of a polysyllabic word reflects the choice not to use a
monosyllabic word (and vice versa), the same cannot be said for numbers. However, to compensate for the numbers not being in the syllable count, the number of numbers in each clue was stored as a separate feature, along with the number of words and the total count of words and numbers. Words were counted using spaces to determine the
beginnings of new words; contractions such as “can’t” and “it’s” were counted as two words.
It • 's • the • pointless • thing • Sarah • is • doing 8 words
The total number of syllables and the total number of characters were also both divided by the number of words and the number of words and numbers, respectively, to calculate the average syllables and characters per word. Length features for an example clue are shown in Table 5.
Clue Char. Syl. Words Numbers Words
and numbers
Char. per word
Syl. per word
It's the pointless thing Sarah is doing
39 11 8 0 0 4.75 1.375
Table 5. Length features for an example clue.
tagged with their parts of speech, and these representations were used to chunk the noun and verb phrases of each clue using the regular expressions, as shown in Figure 1.
Once each clue had been chunked into its noun and verb phrases, numeric data about these phrases was stored as features for the clue, including the number of noun and verb phrases, the average length in words of these phrases, and the total number of phrases (noun, verb, and other). Table 6 shows the phrase features for an example clue.
Clue Noun
phrases
Avg. length of noun phrases
Verb phrases
Avg. length of verb phrases
Total phrases
It's the pointless thing Sarah is doing
3 1.666666667 2 1.5 5
Table 6. Phrase features for an example clue.
In addition to readability features being generated for each clue, the topic of a clue was also considered as a potential indicator of difficulty. Since each clue is already assigned to a category and since Jeopardy! contestants must rely on the category to estimate what unseen clues are about, the categories were treated as reliable predictions of topic. However, category names often appear only in a single game, and each category has a clue assigned to each difficulty level within it. Using the category names as topics would therefore result in 4,244 topics, all of which would have roughly the same amount of clues from each difficulty level and would be unable to provide helpful information for
a classifier. Rather than treat each category name as its own topic, a method for discovering larger topics that could apply to clues in multiple categories was devised.
In order to discover larger topics existing in the dataset, the category names of the Jeopardy! corpus were studied for underlying patterns. Using a subset of 4,084 clues not in the tested dataset, all unigrams, bigrams, and trigrams appearing in category titles over the span of at least 2 games were generated. The least ambiguous of these phrases (for example, “movie_characters” and “book_characters” are less ambiguous than simply “characters”) were then grouped into 65 topics using WordNet,4 Library of Congress subject headings,5 and relationships in category names to measure similarity. (These unigrams, bigrams and trigrams can be found in Appendix C.) The categories of 22,185 clues not in the tested dataset were then searched for the unigrams, bigrams and trigrams that had been grouped into the topics, and clues whose categories matched those phrases were assigned to their corresponding topics. In this way, each topic had constituent clues that described how the topic manifested itself in the Jeopardy! corpus.
Next, these clues were used to create a model for each topic. Clues assigned to a particular topic were combined with an equal number of clues that had been assigned to other topics in order to build a training and test set on which to build the models. Twenty percent of this data was set aside for testing; the rest was used to build a model to predict the topic. After a model was built on the training data using LightSide, it was tested on the remaining data. (A list of the generated models and statistics about their accuracy can be found in Appendix D.) This was repeated for the 65 different topics.
Each topic model was then used to predict the topics of clues in the tested dataset, using the category names and responses as well as the clue text. Three versions of the clue text were used to assign the clues to topics. One version was the original clue text, one expanded the clue text using hypernyms from WordNet, and one expanded the original clue text using synonyms. An example is shown in Table 7.
Clue version Clue text
Original clue text It's the pointless thing Sarah is doing
Hypernyms It's the pointless thing Sarah is doing situation state_of_affairs Synonyms It's the pointless thing Sarah is doing unpointed make do Table 7. Clue text expanded with hypernyms and synonyms for an example clue.
(No attempt was made to incorporate the hypernyms and synonyms naturally into the clue, since the model did not incorporate the position of words into its predictions.) The model for each topic independently predicted topic membership using each version of the clue text, as well as the clue’s category and correct answer. Membership in any topic was represented as a binary feature, though each clue could belong to multiple topics. Three versions of topic features were created:
• topicsORIG: the predictions made using the clue text as it was originally stated, as
well as a clue’s category name and response
• topicsHYP: predictions made using clue text expanded with the hypernyms of any
nouns or verbs, as well as a clue’s category name and response
• topicsSYN: predictions made using clue text expanded with the synonyms of any
nouns or verbs, as well as a clue’s category name and response.
Feature group Feature set Component features Versions
Unigrams unigrams unigrams1
unigrams5
unigrams10
Media number of pictures number of video files number of audio files
N/A
Length number of characters number of syllables number of words number of numbers
number of words and numbers characters per word
syllables per word
N/A Readability
Phrase number of noun phrases number of verb phrases
average length in words of noun phrases average length words of verb phrases total number of phrases (noun, verb, and other)
N/A
Topic Topic membership for 65 topics
total number of topics clue belongs to topicstopicsORIGHYP
topicsSYN
Table 8. Features used in study. Another version of this table, which details the potential values for each feature, is shown in Appendix E.
Experiments
To determine which sets of features were predictors of difficulty, several experiments were run using Weka.6 Each experiment compared the accuracy of naïve Bayes classifiers built using different feature sets, determined through ten-fold cross validation. In ten-fold cross-validation, the data is partitioned into ten folds, then a model is created by training on nine folds of the data and testing on the tenth, held-out fold. This is repeated ten times, with a different fold being held out each time. In these experiments,
the data was partitioned into ten folds by the date of each clue, in order to prevent clues in the same category from appearing in different folds.
After each model was built using nine folds, the accuracy for each model was recorded and then compared to other models built on the same combination of folds with different feature sets using Fisher’s randomization test. Fisher’s randomization test evaluates whether the accuracy associated with one fold for a particular set of features represents a significant difference from the accuracy associated with that fold for a different set of features (Smucker, Allan & Cutterette, 2007). To calculate the statistic, the mean accuracy of the ten folds is calculated for both sets of features being evaluated, and the difference between those two means is recorded. Then, for each fold, the
accuracy from the two models is randomly assigned or reassigned to either set of features. The mean accuracy for each set of features’ folds (now with some accuracies switched between the two groups) is computed again and the difference between them is recorded. This is repeated 100,000 times in order to create an adequate sample of the existing random permutations of the results. The number of times the difference between the mean accuracies is greater than or equal to the original mean is divided by 100,000 to obtain the probability that the original difference between the two models was due to chance. If the p-value was less than .05, the difference between the models was considered significant.
Using this procedure, a number of different comparisons between groups of features were evaluated. First, the optimal set of unigrams was determined by comparing the three versions of unigram features: unigrams1, unigrams5, and unigrams10. In order to
to the accuracy of a model built using unigrams5. Then, if a significant difference was
found, the model with the highest accuracy was compared to the models built on unigrams1. If a significant improvement in accuracy was made according to Fisher’s
randomization test, the more accurate model was used for the next stage of the study. If in either comparison, there was no significant difference in accuracy between the two
models, the model with a smaller feature set was used for further experiments because it was more efficient. A summary of these experiments is shown in Figure 2.
Figure 2. Plan for comparisons between different versions of unigrams.
Evaluating what kinds of features had significant impacts on accuracy was broken down into two feature ablation studies. The accuracy of the folds of the model built using all of the readability features (length, media, phrase, and the best-performing version of unigrams) was compared to the accuracy of the folds of models built without one set of features. The difference between the models’ accuracies was evaluated for significance using Fisher’s randomization test. A significant decrease in accuracy in a model that was not built using a particular set of features would indicate that the set of features was useful to the model in predicting difficulty.
features and the successful combination of readability features. As above, a ten-fold cross-validation process was used, and the accuracy of each fold was compared the accuracy of the corresponding fold in the model built using only the significant readability features. A significant decrease in accuracy compared to the model that incorporated topic features, as judged by Fisher’s randomization test, would indicate that the topic features were useful to the model in predicting difficulty.
In addition to the experiments run above, models were built using a naive Bayes classifier and individual groups of features, in order to study how the model was using each group of features and the confusion matrix associated with each. These models were also built using ten-fold cross validation, but their accuracy was not evaluated for
Results
Unigram threshold
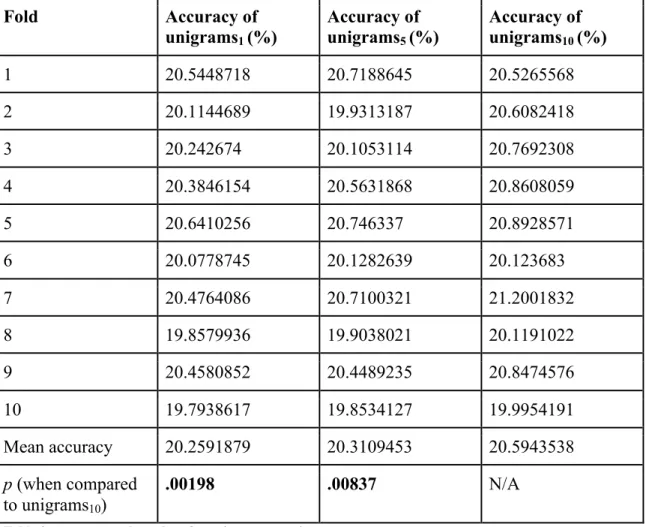
Three models were created, each using a different group of unigrams: all the unigrams in the dataset (unigrams1), all the unigrams appearing in at least five clues in
the dataset (unigrams5), and all the unigrams appearing in at least ten clues in the dataset
(unigrams10). The accuracy and results from this experiment are shown in Table 9.
Fold Accuracy of
unigrams1 (%)
Accuracy of unigrams5 (%)
Accuracy of unigrams10 (%)
1 20.5448718 20.7188645 20.5265568
2 20.1144689 19.9313187 20.6082418
3 20.242674 20.1053114 20.7692308
4 20.3846154 20.5631868 20.8608059
5 20.6410256 20.746337 20.8928571
6 20.0778745 20.1282639 20.123683
7 20.4764086 20.7100321 21.2001832
8 19.8579936 19.9038021 20.1191022
9 20.4580852 20.4489235 20.8474576
10 19.7938617 19.8534127 19.9954191
Mean accuracy 20.2591879 20.3109453 20.5943538 p (when compared
to unigrams10)
.00198 .00837 N/A
Using Fisher’s randomization test, the probability that improvements in accuracy between unigrams10 and unigrams5 was determined to be significant (p = .00837). The
accuracy of unigrams10 and unigrams1 was then compared and also determined to be
statistically significant (p = .00198). Because the unigrams10 was determined to be a
significant improvement over the other versions of unigrams, unigrams10 was used for
later experiments. Readability features
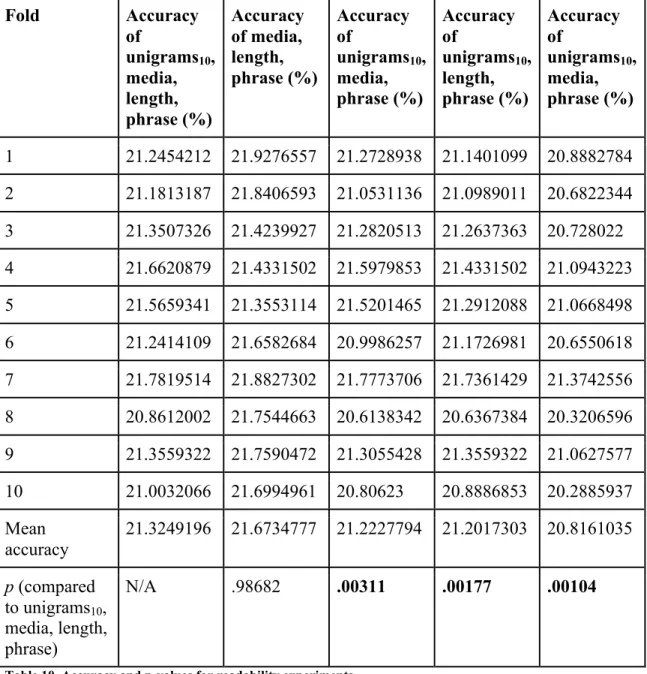
Five models were created: one with all sets of readability features, and four others which represented the total group of readability features without one of the member sets - unigrams10, media, length, and phrase. The accuracy and results from this experiment are
Fold Accuracy of
unigrams10, media, length, phrase (%) Accuracy of media, length, phrase (%) Accuracy of
unigrams10, media, phrase (%)
Accuracy of
unigrams10, length, phrase (%)
Accuracy of
unigrams10, media, phrase (%)
1 21.2454212 21.9276557 21.2728938 21.1401099 20.8882784 2 21.1813187 21.8406593 21.0531136 21.0989011 20.6822344 3 21.3507326 21.4239927 21.2820513 21.2637363 20.728022 4 21.6620879 21.4331502 21.5979853 21.4331502 21.0943223 5 21.5659341 21.3553114 21.5201465 21.2912088 21.0668498 6 21.2414109 21.6582684 20.9986257 21.1726981 20.6550618 7 21.7819514 21.8827302 21.7773706 21.7361429 21.3742556 8 20.8612002 21.7544663 20.6138342 20.6367384 20.3206596 9 21.3559322 21.7590472 21.3055428 21.3559322 21.0627577 10 21.0032066 21.6994961 20.80623 20.8886853 20.2885937 Mean
accuracy
21.3249196 21.6734777 21.2227794 21.2017303 20.8161035
p (compared to unigrams10,
media, length, phrase)
N/A .98682 .00311 .00177 .00104
Table 10. Accuracy and p-values for readability experiments.
Using Fisher’s randomization test, the probability that the differences between the models not incorporating media, length, or phrase features and the model incorporating all sets of readability features was determined to be less than .05, and therefore significant.
incorporating unigrams10 had a better mean accuracy than the model that did), this set of
features was not used in the topic experiments. Topic features
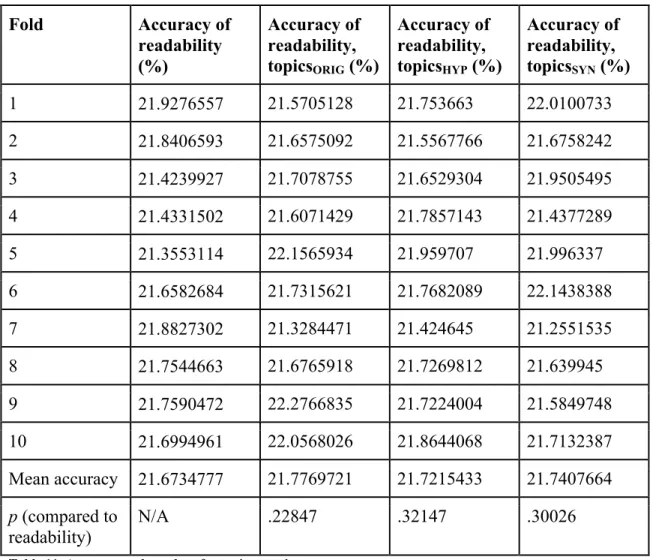
Four different models were created to evaluate the impact of topic on difficulty predictions. The first combined only the significant readability features (media, length, and phrase features). The other three models that combined the significant readability features with different versions of the topic set of features. One combined the significant readability features with topic membership based on the original text of the clue
(topicsORIG), another combined the significant readability features with topic membership
based on the text of the clue expanded with hypernyms (topicsHYP), and the last combined
the significant readability features with topic membership based on the text of the clue expanded with synonyms (topicsSYN). The accuracy and results from this experiment are
Fold Accuracy of readability (%)
Accuracy of readability, topicsORIG (%)
Accuracy of readability, topicsHYP (%)
Accuracy of readability, topicsSYN (%)
1 21.9276557 21.5705128 21.753663 22.0100733
2 21.8406593 21.6575092 21.5567766 21.6758242
3 21.4239927 21.7078755 21.6529304 21.9505495
4 21.4331502 21.6071429 21.7857143 21.4377289
5 21.3553114 22.1565934 21.959707 21.996337
6 21.6582684 21.7315621 21.7682089 22.1438388
7 21.8827302 21.3284471 21.424645 21.2551535
8 21.7544663 21.6765918 21.7269812 21.639945
9 21.7590472 22.2766835 21.7224004 21.5849748
10 21.6994961 22.0568026 21.8644068 21.7132387
Mean accuracy 21.6734777 21.7769721 21.7215433 21.7407664 p (compared to
readability)
N/A .22847 .32147 .30026
Table 11. Accuracy and p-values for topic experiments.
Discussion
Overall, many of the features hypothesized to have a significant bearing on predicting difficulty were in fact useful in predicting clue difficulty. However, though media, length and phrase features had some impact on accuracy, it was still very slight, and unigrams and topic did not affect accuracy significantly, contrary to what was suggested by the literature. Below, I discuss the potential reasons behind the significance of results.
The significant improvement in accuracy after decreasing the number of unigrams used is not surprising. Including unigrams that have appeared at least ten times in the dataset in the training set prevents the model from assigning importance to relationships between unigrams and difficulty classes that may only occur by chance. For example, the unigram “Wozniak” only appears twice in the dataset; once in the very easy class, and one in the difficult class. If these instances are split between the training and test sets during cross-validation, the model will use the information from the training set to wrongfully predict the difficulty of the clue with that unigram in the test set. However, if the set of unigrams is limited to only those that appear in at least ten clues in the dataset, those ten instances provide a fuller picture of which classes the unigram is frequently associated with.
to read and therefore in a higher level of difficulty than other clues. Future research in this regard might involve using inverse document frequency weights for unigrams, but those weights might also generate wrong predictions on the test set. Though the 21,834 clues used had only 33,494 types (including words, numbers, and punctuation), some of the hapax legomana comes from misspellings (either from typos made in data entry or categories where contestants are required to correctly spell misspelled words) and anagrams, where the contestant is not required to make meaning from the words but instead assess their components. The following two clues show how a word may not just have multiple meanings, but multiple cognitive interpretations:
ANAGRAMMED NOTABLES $2000: An ancient playwright: Pi residue (Euripides)
ACCIDENTAL INVENTIONS $1200: In 1879 a chemist's unwashed hands got residue on a roll, which tasted sweet; he'd patent this, 300x sweeter than sugar (saccharin)
In the latter, “residue” is a word that carries meaning; in the former, “residue” is only an arrangement of letters.
This ambiguity between unigrams that convey meaning and unigrams that only combine letters may have somewhat contributed to the fact that unigrams are not
significant in predicting difficulty, but there were likely other factors. Among these is the idea that each clue might contain a mix of information; instead of being composed of only “easy” unigrams or only “difficult” unigrams, there are mixes of unigrams in each clue which present mixes of “easy” or “difficult” trivia. For example, a clue that the unigrams-only classifier correctly identified as “easy,” two entities are mentioned:
In Jeopardy! clues, Jose Reyes only appears one other time, in a clue that is classified as “difficult.” However, Sosa appears in other clues marked “easy” or “very easy.” The identification of this clue as “easy” by the writers may therefore be more dependent on Sammy Sosa than it is on Jose Reyes, making Sosa a more meaningful unigram than Reyes. This idea suggests that the unigrams of a clue do not combine equally to create a clue’s difficulty, but that easier unigrams can outweigh more difficult ones. In addition, it suggests that weighting unigrams by their inverse document frequency may create
superior models.
The example above also supports an idea from the literature that suggests that named entities may be more useful predictors of difficulty than common nouns. “Caribbean,” “Reyes,” and “Sosa” all arguably provide more information, or at least more specific information, than simply “nation” or “players.” The specificity of this information also means that there is less chance it appears ambiguously in the dataset; “Sosa” always refers to Sammy Sosa, and Caribbean always refers to a particular region of the Atlantic, though Reyes may also reference different named entities. While there appears to be no pattern to how the model currently uses named entities in its predictions, incorporating information about named entities along with inverse document frequency weights may increase the performance of the model.
model built using only the set of length features correctly predicted the difficulty levels of the following clues, for example:
MOVIE TITLE OBJECTS $400: “Soylent Green” (people (or food))
WORLD OF GESTURES $1000: In much of the world, the twirled finger means "you're crazy", but in Argentina, it means you may have one of these--pick up! (phone call)
These clues, which are considered very easy and very difficult, respectively, contrast in the density of the information they provide. In contrast to that example, a long clue could indicate that a contestant has been given multiple pieces of information, which makes giving a correct response easier than if the contestant has only been given one piece of information. However, this could also signal that the clue is perceived as being easier by those assigning labels, since a clue that requires one piece of information to figure out and therefore be labeled very easy. This duality is reflected by the confusion matrix of the model that uses only length features (included in Appendix F), which classifies 18,098 instances (83%) as being either very easy or very difficult. One example of where this conclusion plays out is in the classification of the following “very easy” clues, both of which the model accurately predicted to be “very easy”:
CROSS WORLD CLUES “C” $200: Sea known as the American Mediterranean (9) (the Caribbean)
LITERARY E-MAIL ADDRESSES $400: hogwarts_ headmaster@ harrypotter.edu (Dumbledore)
These clues are both relatively short in length going by the number of characters, syllables, and words.
$200: Thespian (correctly predicted “very easy”) $400: Lexicographer (predicted “very easy”) $600: Philatelist (predicted “easy”)
$800: Ichthyologist (correctly predicted “difficult”) $1000: Terpsichorean (predicted “very easy”)
The model using only features based on length was able to correctly classify two of the clues, but incorrectly classified the most difficult clue as being very easy. A similar problem occurs in BEFORE & AFTER clues, which require contestants to come up with two different responses and combine them, which involves long clues no matter what the difficulty value. Of the 25 clues in the BEFORE & AFTER category, 8 were classified as being very difficult and 15 were classified as being very easy. The presence of multiple pieces of information in these long clues exacerbates the model’s inability to distinguish between levels of difficulty.
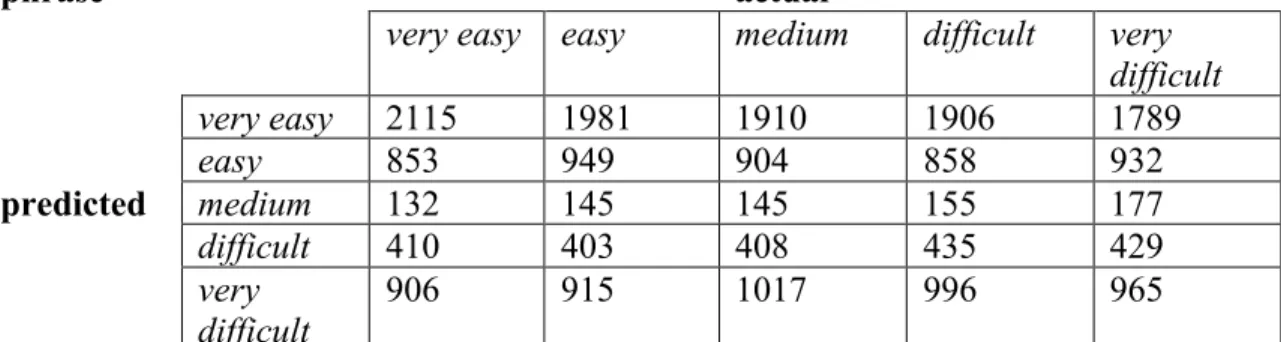
The component phrases of a clue perhaps are closest to capturing the mixture of information, as different noun phrases may contribute different pieces of information to the clue. The number of these phrases, as well as their average length and how many parts the clue was chunked into overall, can indicate whether a clue provides many pieces of information about a topic that are all rather shallow, or whether it provides fewer pieces of more detailed information. The following clues indicate this phenomenon:
INTERNATIONAL SEAFOOD $200: A Maltese specialty, lampuki pie is made with the fish better known by this double talk name (mahi mahi)
OPERA $200: "Twilight of the Gods" is the last part of this composer's "Ring" cycle (Wagner)
“C” IN SCIENCE $1000: The two streams of water form one, because water molecules are so attracted to each other that when they come near, they stick together, a uniting action known as this (cohesion)
In the two clues correctly identified as “very easy,” the number of noun chunks vary but the length is usually at least two words: “A Maltese specialty,” “lampuki pie,” “this double talk name,” “Twilight of the Gods” (parsed as a proper noun), “this composer’s ‘Ring’ cycle.” In contrast, the noun phrases in the two more difficult clues - even though there are more of them for the “C” IN SCIENCE clue - are shorter and signal that less information has been given in a clue. Further research might also explore the impact of phrases containing determiners, such as “this” or “these,” since they identify what entity the clue is quizzing contestants on. Longer phrases containing determiners might signal more information being given about that entity, as opposed to just “this” and “they” in the more difficult clues referenced above.
Media was also a significant predictor of difficulty, though this was more
Though media is a more extreme version of this phenomenon, each model built using individual sets of readability features had higher recall for the very easy and very difficult clues at the expense of recall for the three intermediate levels. (Confusion matrices that illustrate this point can be found in Appendix F.) While the models usually did not agree on their predictions, they tended to be correct and agree most on short clues without media. For example, the models built using only media, length, and phrase features correctly predicted the following clues to be very easy:
FILM FIRST NAMES $400: Title spy guy from "The Bourne Identity" (Jason) LITERARY BROTHERS $400: Dmitry & Ivan are 2 of this novel's title quartet (The Brothers Karamazov)
This might be because these clues have less information in across all three significant categories: they contain no audiovisual content (media), they are relatively short (length), and they have fewer noun phrases that are still relatively information rich, like “Title spy guy” and “this novel’s title quartet” (phrase).
Though media, length and phrase features were somewhat predictive of difficulty, topic was not significantly predictive. Since topic was operationalized as topic
membership, it may have had too close a correspondence with the clue categories themselves to be useful in predicting difficulty. Since every category contains one clue from each difficulty level, if the clues’ category corresponded to their topic assignments, these assignments would do little to differentiate between the clues. Even in more
miscellaneous categories, such as “POTPOURRI,” topic assignments might be less useful if they were made using less relevant information in the clue. The following medium-difficulty clue was assigned to the “books” topic:
However, it could also plausibly be assigned to the “philosophy” topic, or even no topic at all. Schopenhauer’s authorship, as opposed to his status as a philosopher, his personal life, or the actual substance of the quote, was used to assign the clue to the books topic, but it may not have been the most important part of the clue. This likely also explains why including synonyms or hypernyms did not significantly increase accuracy; they may have only entrenched the model’s existing distortion of what a clue was about.
Topic membership also does not cover the granularity of the information mentioned. Because membership was treated as a binary feature for each topic, the obscurity of the information related to the topic was not included. Schopenhauer, for example, is likely a more obscure author than Charles Dickens, but they would be considered equal members of the literature topic. Dickens might have less overlap with other topics, but a clue’s interdisciplinary nature or lack thereof is not a reliable estimate of its difficulty. In addition, using only category names as ways to generate topics meant the topics’ granularity was restricted by the show’s representation of topics and not any real world representations (for example, “Africa” was a topic, but North America was represented by separate topics for the United States and Canada). Using an external, possibly hierarchical resource to generate topics would create a more objective and possibly more useful method of predicting topics.
Though the topic features did not have a statistically significant impact on accuracy, including any kind of topic features - topicsORIG, topicsHYP or topicsSYN -
difficulty class more often, with a slight improvement in precision for that class as well: 20.1% for topicsHYP, 20.4% for topicsORIG, and 20.4% for topicsSYN, as opposed to 19.7%
precision for the medium difficulty class with only the significant readability features. This might indicate some underlying pattern to the medium difficulty class - perhaps clues at that level are more weighted to certain topics, or perhaps they are more or less likely to be members of multiple topics. However, the number of correct predictions for very easy and very difficult classes is still higher without the topic features, so having higher precision and recall for the medium difficulty class is a trade-off with other predictions.
While the limitations for topic and the earlier ones for unigrams discussed above may have contributed to the models’ low accuracy, the significant impact of length, phrase and media features offers a new framework in which to cast these features. Instead of examining unigrams in the context of readability, it will likely be more helpful to consider them in terms of how much information they provide. Disambiguating words by looking particularly at named entities or by considering bigrams or trigrams along with unigrams would create a better representation of how specific the clues are, which might be a better predictor of difficulty. Similarly, detecting more granular topics would allow a model to differentiate between how on-topic clues were.
Though not discussed extensively here, further research might also focus on a different way of approaching the dataset altogether. One assumption made in this study is the independence of the difficulty classes, but as mentioned above, there may be a
Conclusion
Though unigrams and topic membership were not shown to be significant features for predicting the difficulty of trivia clues, features relating to media, length and phrases all had significant impact on difficulty. This may be because these features correspond to the amount of information offered in a clue. In contrast, unigrams and topic membership are closer approximations to the subject of a clue than the density of the information it contains. A more concrete representation of the volume of information in a clue would likely prove useful when conducting further research.
Since the significant results are based on the structure of the clues and not their contents, they may generalize to more specific domains, as long as the underlying structure remains the same. Though topics themselves were not significant features for predicting difficulty, any one of the 65 topics used might be used as a domain to test whether the results from this study hold true. In addition, researching clue difficulty only within a specific domain would prevent the model from comparing apples to oranges, which might yield better results for predictions made using unigrams.
This research has also shown how even texts written under constraints have meaningful variations that can be used to infer meaning. Though every Jeopardy! clue is rather short, and efforts to expand the text with synonyms and hypernyms were
unsuccessful for the purposes of this research, significance still exists within the
knowing the form of media materials linked to by a text is significant without knowing what the media itself contains, suggesting that for similar projects in text mining,
gathering or creating exhaustive descriptions of peripheral media files for similar projects may not be necessary.
Appendix A
Clues Removed Based on Cognitive Level
MATH-POURRI $800: It's the square root of the square root of 81 (3) MATH-POURRI $2,000: It's -5 x -5 x -5 (-125)
STORY PROBLEMS $400: 12 hens each lay a half dozen eggs, but 2 get broken; then a hen lays one more, leaving this many unbroken eggs (71)
STORY PROBLEMS $800: If a lepidopterist spots 4 butterflies, each with 3 black spots & 5 yellow spots, he spots this many spots (32)
STORY PROBLEMS $1,200 The "Jeopardy!" writers drank 72 beers after work yesterday: 20 in the 1st round, 26 in the 2nd & this many at last call (26)
STORY PROBLEMS $1,600: A widget costs 64 cents & you pay with a dollar; you get 4 coins in change, these (a penny, a quarter & two nickels)
STORY PROBLEMS $2,000: A scout troop hikes 3 miles due north, 4 miles due east & straight back this far to their starting point (5)
MULTIPLY BY THE CLUE'S VALUE $200: 7 (1400) MULTIPLY BY THE CLUE'S VALUE $400: 30 (12,000) MULTIPLY BY THE CLUE'S VALUE $600: 700 (420,000) MULTIPLY BY THE CLUE'S VALUE $800: 0.6 (480)
MULTIPLY BY THE CLUE'S VALUE $1,000: 10,001 (10,001,000) x 2 $400: In a bowling game, it's a perfect score x 2 (600)
x 2 $800: It's the total number of sides on an octagon & a nonagon x 2 (34) x 2 $1,200: It's the number of stars & stripes on the U.S. flag x 2 (126) TIME $200: 180 minutes after noon (3:00 PM)
TIME $400: 360 seconds before 2:00 am (1:54 AM) TIME $600: 13 half hours after 6:30 PM (1:00 AM) TIME $800: 4 dozen minutes after 3:15 PM (4:03 PM) TIME $1,000: 1,800 seconds before 8:11 AM (7:41 AM)
ALL THINGS CONSIDERED $400: It's 4 cubed minus 4 squared (48) MULTIPLY BY 5, DIVIDE BY 2, ADD 3 $400: 2 (8)
MULTIPLY BY 5, DIVIDE BY 2, ADD 3 $800: 10 (28) MULTIPLY BY 5, DIVIDE BY 2, ADD 3 $1,200: 16 (43) MULTIPLY BY 5, DIVIDE BY 2, ADD 3 $1,600: 60 (153)
GIMME 5 $800: Cubed (25)
GIMME 5 $1,200: x the equivalent of the Roman numeral XX (100) GIMME 5 $1,600: x the number of degrees in a circle (1800)
Appendix B
Regular Expressions Used to Parse Clues for Phrase Features
After the clues were tagged with their parts of speech, the following regular expressions were used to chunk noun phrases (NP) and verb phrases (VP). The abbreviations for parts of speech are the same used in the Penn Treebank.7
Noun phrases:
{<DT><JJ><,><JJ><NN>} {<DT><VBD><[N].*>} {<DT><POS><JJ><[N.*>} {<NNP><DT><JJ>}
{<DT>*<NNP>+<\.><NN|NNP>+} {<``><FW><NNP>+<">}
{<DT><NNS><POS><JJ><VBD><NN>+} {<DT><VBG><[N].*>*}
{<CD><DT><NNS>} {<DT><NNP><CD><NN>} {<DT><CD><NN><CD>}
{<DT>*<NNP><DT|IN><NNP>}
{<DT>*<CD>*<NNP><DT|IN><NNP>+} {<DT>*<NNP><CD><,><CD><NN>} {<DT|PRP|CD>}
{<DT>*<[N].*>*<POS><[J].*|VBD>*<[N].*>+<">*<DT>} {<``><[J].*><NN><">}
{<DT>*<PRP\$>*<RB>*<[J].*><[N].*>+<"><[N].*>*} {<DT>*<PRP\$>*<RB>*<[J].*><[N].*>+<">*}
{<``><NNP>+<\.>*<">}
{<DT>*<\$|[J].*|RB><CD><[N].*>} {<DT>*<[J].*><[N].*><CD>} {<CD><POS>*<[N].*>+<">*}
{<NNP><">*<POS>*<NNP>*<DT><[J].*><NN|NNP>+<">*} {<DT><JJ>}
Verb phrases:
{<MD><RB>*<VB><VBN>*} {<TO><MD>}
Appendix C
List of Category Titles’ Unigrams, Bigrams and Trigrams Used to Create Topics
Africa: africa, african
Anatomy: doctor, eyes, health, human_body, medical, medicinal, medicine
Animals: animal, animals, bee, bird, birds, cats, creatures, dog, dogs, fish, mammal
Annual events: annual events, christmas, holidays, observances
Art: art, arte, artist, artists, arts, arty, paintings Asia: asia, asian
Astronomy: astronomers, astronomical, astronomy, planet
Bible: bible, biblical, testament
Books & literature: authors, bestsellers, book, book_title, books, bookstore, fiction, haiku, literary, literary_characters, literature, nonfiction, novel, page, pages, poems, poet, poetic, poetry, poets, pulitzer, shakespeare, writers
Branding: brand, brand_name, branded, brands, logos, slogan, slogans
Business: business, business_industry, company, organizational
Canada: canada, canadian, canadians
Celebrities: actors, celebrities, celebrity, celebs, hollywood China: china, chinese
Classical music: composers, opera, operas
College: college, colleges_universities, school, university Cities & towns: cities, city, town
Dance: ballet, ballets, dance, dances, dancing English/UK: british, english, england
Fashion: fashion, fashionable Flags: flag, flags
Food & drink: beer, cuisine, drink, eateries, food, food_drink, foodie, fruits, seafood, soup
Foreign languages: espanol, language, languages
Games: game, games
Geography (all): bodies_water, capital, capitals, city, countries, country, geographic, geography, island, islands, lakes, land, landmark, lands, map, mountains, nation, places, river, rivers, seas, state, states, travel, travels, world
Germany: german, germany Gods: god, gods, myths Greece: greece, greek
History: 80s, 90s, 1600s, 1800s, 1890s, 1930s, 1960s, 1980s, 19th_century,
20th_century, century, historical, history, war, warcraft, wars, year, years House & home: address, estate, home, house, housekeeping
Inventions: inventions, inventive, inventors Italy: italian, italiano, italy
Jobs: jobs, work
Leaders: leaders, king, kings, president, presidential, presidents, queen Military history: battle, battles, civil_war, military, war, wars, warcraft
Money: money
Movies: movies, cinema, movie_characters, films, film, best_picture, screen, movie,
movie_title, movie_titles, who_played_em, movie_taglines, moving_pictures
Museum: museum, museums
Music: album, albums, band, bands, beatles, grammy, grammys, ipod, lyrics, music,
musical, musicals, no_1_hitmakers, record, singer, song, songs, tunes Nature: flower, flowers, nature, tree
Opera: opera, operas
Philosophy: philosophy, philosophic
Places: landmark, place, places Poetry: haiku, poetic, poetry, poets
Politics: cabinet, congressmen, government, governors, leaders, political, politically, politicians, politics, president, presidential, presidents, senator, supreme_court Presidents: president, presidential, presidents
Publications: magazines, newspapers
Religion: bible, biblical, pope, religions, religious, saints, testament Royalty: king, kings, queen
Russia: russia, russian
Science: biology, element, elemental, elements, physics, science, scientists
Shakespeare: shakespeare, shakespearean
Spain: spain, spanish
Sports: athletics, ballpark, baseball, football, nba, nfl, racing, sporting, sports, sports_illustrated, sports_teams, sportsmen
Technology: computer, internet, online, website, websites
Theater: broadway, drama, dramas, musicals, play_title, shakespeare, theater TV: episodes, TV, TV_series,
US (country): america, american, americana, americans, president, presidential, presidents, u_s