Robert Capra
This study developed and evaluated a method for generating thumbnails for archival documents utilizing open source image saliency software. Salient thumbnails were evaluated against a baseline by running a lab study that assessed the thumbnails’ usefulness during finding and re-finding tasks. Results did not find any significant difference in time, user confidence, or user preference of salient thumbnails compared to the baseline. However, salient thumbnails resulted in improved accuracy during re-finding tasks, suggesting that they may offer some advantage for representing archival correspondence.
Headings:
Digital Archives Digital Humanities. Digital Image Processing Image Saliency
Thumbnails
by Bailey A. Jones
A Master’s paper submitted to the faculty of the School of Information and Library Science of the University of North Carolina at Chapel Hill
in partial fulfillment of the requirements for the degree of Master of Science in
InformationScience.
Chapel Hill, North Carolina April 2016
Approved by
I
NTRODUCTIONOver the past two decades, a staggering number of paper documents from archives around the globe have been scanned and uploaded to the Web. For an example of scale, the National Digital Newspaper Project (NDNP), a subset of the U.S. Library of Congress’ total digitization efforts, provides grants to institutions willing to digitize roughly 100,000 pages of their historic newspaper collections at a time. As of this writing, their website lists 107 grants (“Award Recipients”), resulting in well over 10 million images that reside on a purpose-built website.1 Smaller institutions also generate an abundance of scans. Though their problems of scale are less daunting, they also tend to have more limited options for custom web design than large national projects. The Southern Historical Collection at the University of North Carolina at Chapel Hill, for example, has scanned portions of more than 500 of its 46,000 collections. Most these digital images have been retroactively incorporated into existing finding aids on the SHC website. Unlike the National Digital Newspaper Project, which is in a position to
establish standard metadata requirements for its grant recipients, the amount information available for each image on the SHC’s website varies considerably between collections.
documents, because they tend to feature dark text on a light background, they often look similar to each other. This limits their potential use as tools for distinguishing one document from another. The text on the thumbnail is often too small to be readable, further limiting a user’s ability to tell which document any given thumbnail represents.
Due to promising research on creating distinctive, recognizable thumbnails in other domains (Amrutha et al., 2009; Asai et al., 2011; Lam and Baudisch, 2011; Suh et al., 2003; Teevan et al., 2009) and because many archival websites use thumbnails when rendering their digitized material online, this project seeks to determine whether an improved model for thumbnail generation might yield archival websites that are easier for users to navigate and browse. Image saliency, the idea that certain portions of an image inherently stand out to capture a viewer’s attention more than others, provides a
framework for identifying the most visually important portions of an image to feature in a thumbnail.
is often inexpensive or freely available, an improved method of thumbnail generation could provide a relatively quick, cheap method of improving user experiences. Notes
L
ITERATURER
EVIEWAs scanning documents and placing images online becomes faster and cheaper, many archives have begun digitizing vast portions of their collections and placing them online. This practice allows users across the globe to access collections without spending the time and money necessary for a visit; however, to date relatively few studies have considered how to best render this digital content for users. As institutions incorporate thousands of scans into new or existing websites and finding aids, the gains in
accessibility are undeniable. But without investigating the usability of the interfaces that serve as gateways to this wealth of digital content, these expensive, highly prioritized resources run the risk of being underused and underappreciated (Chowdhury, 2015, p. 140). User studies can provide insight into which design choices will minimize the amount of time necessary to complete a task and maximize the users’ sense of satisfaction, encouraging more people to investigate and explore digitized content.
visitors to their website must download before they can view.5 Thumbnails feature in many of the interfaces, though different flavors of thumbnails result in some subtle differences in approach. When presenting items from a collection, the Library of
Congress presents each thumbnail on one half of a content pane, with an image to the left of a block of descriptive text.6 NARA’s catalog search results page looks similar, but only at the collection level, with one thumbnail representing a link to an entire
collection.7 Once the user navigates to a particular collection, approaches for document viewers vary depending on the format of the images presented. Given the wide variation in approaches, it seems reasonable that certain configurations would prove more
advantageous for searching and browsing a collection than others.
As digitization efforts at a wide range of institutions continue to mature, patrons have gained experience using various digital collections. These digital resources began accumulating in large quantities starting around the 1990s, meaning that many historians who currently use digitized material developed strategies for examining archival
documents before digitized versions were available (Sinn and Soares, 2014). However, two decades of digitization effort also means that younger or less experienced users may have developed research strategies during this period. Repositories of digital resources therefore are likely to serve both users who grew up with computers and users who did not.
Some researchers do consider the divide between digital natives and digital naïve in assessing the design of a digital library system (Dobrevra and Chowdhury, 2010; Nicholas et. al, 2013). For instance, digital natives tend to prefer simplification,
while older users do not demonstrate as strong a preference (Nicholas et. al., 2013). However, in this particular area of digital archives, researchers have also expressed concern that many digital resources have been designed without sufficient data on user analysis and usability research (Chowdhury, 2015, p.140). While the diversity of an archive’s potential users can complicate the choices taken to design a particular interface, it is important to start somewhere. Investigation into user requirements can start to reveal which design choices will likely provide the greatest benefit for the most users.
Certain user groups are willing to overlook a lackluster interface if it contains items that are particularly important to them. Historians care far more about the
authenticity and uniqueness of the materials contained in an online archive than they do the interface (Sinn, 2012) and they are often willing to sift through an unwieldy interface if they believe they will find a particularly useful document from a well-respected
together, these observations suggest that academics choose whether to use digital or physical collections based on a mixture of practical and emotional or philosophical concerns. The convenience of digitized collections is an important factor for adoption, but encouraging widespread reliance might be best served by an approach that highlights the new affordances offered by a digital platform, rather than attempting to mimic the experience of visiting a physical collection. Such an approach would have the benefit of improving the experience of academics, for whom digitized archives are a critical resource, as well as individuals who may have a more casual interest.
Even with an ideal interface, some researchers undertake projects that cannot be completed even with the best online resources. A researcher analyzing DNA samples taken from parchment (Stinson, 2010) can never complete their project using an online interface alone. Art historians are also particularly critical of digital reproductions, citing the inconsistent and often sub-standard quality of digital images compared to print resources as a major barrier to reliance on digital collections (Kachaluba et al., 2014). An online viewer is a powerful tool for increasing access and understanding of an archival collection, but it is important to remember that certain user needs may be met in unexpected ways, or may not be met at all, using digital reproductions.
Despite these caveats, it is useful to explore what a usable interface for archival collections should look like based on research in interface design for other domains. Even though archival user interfaces present unique considerations, the fundamental problem of presenting more content than will fit on a screen at once is not unusual. Thumbnails provide one approach for presenting many useful summaries while minimizing the
amount of screen real estate required for each one, allowing multiple objects to be viewed at once (Teevan et al. 2009; Kaasten et al., 2002; Cockburn and Greenberg, 2000).
Early work on thumbnails tended to focus representing a webpage, and many researchers experimented with techniques that combined various elements that could be used to represent a webpage into a single small image (Cockburn and Greenberg, 2000; Dziadosz and Chandrasekar, 2002; Teevan et al., 2009; Woodruff et al., 2001).
2002), or addressed both concerns (Teevan et. al, 2009). Rather than considering which elements of a webpage could be combined into the most meaningful thumbnail, Kaasten et al (2002) considered the optimal thumbnail size, determining that larger sizes aided recognition.
Even though archival documents are different from webpages, concerns about how to present them are sometimes similar. Like webpages, archival documents do not always scale well to small sizes, resulting in thumbnails containing text that is too small to be readable and few visual clues other than layout. This problem has been investigated in the context of small screens for mobile devices, where it was evident that layout alone (discernable in a scaled down thumbnail of a webpage) was not always sufficient for enabling a user to locate a particular piece of content without some additional, readable text (Lam and Baudisch, 2005).
Lam and Baudisch (2005) had the advantage of selecting words for their
portion with the highest score (Asai et al., 2011). The algorithm at no point tried to interpret the meaning of the marks it analyzed, instead successfully relying on the visual properties that usually designate text as important. Both the Lam and Baudisch (2005) and Asai et al (2011) papers recognize that whatever technique is used to generate alternatives, generating useful thumbnails presents special challenges when the base images primarily contain text, mainly because text quickly becomes unreadable as it is scaled down.
Additional work in the area of thumbnail generation tends to focus on identifying the most important or distinctive portion of an image. It is possible to rate a portion of an image as being more or less salient by considering its color, intensity, and orientation compared to the rest of the image. Teevan et al. (2009) considered saliency when selecting images and logos to for combined approach to thumbnails for webpages; however, they did so manually, relying on designers to craft each thumbnail. Subsequent work has allowed researchers to do similar work automatically. Multiple models exist that identify image saliency, but the Itti-Koch model remains one of the most cited and most accessible, due to the open-source toolkit that allows researchers to easily generate their own saliency maps (Walther & Koch, 2006). Once a saliency map has been
rendered, it is then possible to generate thumbnails by cropping the original image down to the most salient region. This technique appears promising compared to thumbnails generated by more arbitrary techniques, like cropping the center of an image or simply shrinking it (Amrutha et al., 2009).
their use in automatic cropping, Itti-Koch scored particularly high on precision
(Ardizzone et. al., 2013). More of the resulting cropped image tended to be salient, even if other areas of interest in the original photo had been cropped out. Since the small size of thumbnails inevitably necessitates excluding some useful information compared to the full image, either because of a close crop or through loss of detail as images are scaled down, a model that favors precision could help make the most of a thumbnail’s limited space.
Digitized archival collections have unique concerns based on their often
specialized content and users, yet some of the usability problems many collections face can still be aided by more generalized research. Previous user studies address options for creating more useful thumbnails in different domains, some of which may be able to solve similar problems for digitized archival content, especially since variations on thumbnails comprise the bulk of the designs that have been implemented on existing archival websites. By using the results of previous studies to form hypotheses about which techniques will likely work well, it is possible to begin critically examining the design choices made when representing a digitized archival collection.
Notes
2 https://www.flickr.com/photos/britishlibrary/ 3 https://www.pinterest.com/europeana/
4 Thumbnails are incorporated into finding aids. For an example of this configuration, see the finding aid for the Frank Porter Graham Papers,
http://www2.lib.unc.edu/mss/inv/g/Graham,Frank_Porter.html 5 http://www.oac.cdlib.org/
6 This configuration refers to the view presented once users have navigated to a specific collection. For an example, see the Aaron Copeland collection,
https://www.loc.gov/collections/aaron-copland/
M
ETHODThis study collected data from 24 undergraduate students as they worked through a series of search tasks using two digitized document sets from the Southern Historical Collection’s Frank Porter Graham Papers (collection number: 01819). Participants
completed half of their tasks on a document set represented by thumbnails generated with the saliency toolkit (referred to as salient thumbnails), and half on a document set
represented by thumbnails generated by simply shrinking the original images (referred to as full thumbnails). After completing four initial finding tasks, participants read a brief article about Frank Porter Graham and then completed the four tasks again in the same order as re-finding tasks. At the end of each session, participants completed a brief survey related to the exercise.
Document Sets
Graham’s work as co-chairman of President Franklin Delano Roosevelt’s Economic Security Advisory Council, which informed the president’s plans for Social Security legislation. Each set covers a different 11 day period in Graham’s career: The Citizen’s Library Council document set spans 10 November 1938 to 21 November 1938, and the Economic Security Advisory Council document set spans 17 October 1936 to 28 October 1936.
Although many images in the collection might have been suitable for the
experiment, these sets were created because they are the same length, from the same era, and contain similar types of documents (mainly typewritten correspondence). The Citizen’s Library Movement documents deal primarily with Graham’s efforts to recruit members for the organizations various committees, and the Economic Security Advisory Council documents outline council members’ reaction to a statement Graham prepared on pensions and unemployment benefits. Each set contains enough variety to support
multiple search tasks related to particular documents, and the context of both can be easily explained to a non-expert participant. Additionally, pilot testing demonstrated that the sets contained an appropriate number of images for participants to examine during an hour-long session.
the experimental interface was intended as an exploration of thumbnail options, not as an alternative to the SHC’s current approach of keeping digitized items from the same folder together. Because the researcher did not identify two extant folders that were
appropriately similar and met all of the criteria described in the paragraph above, selective sampling was used in order to generate document sets that would best support the requirements of the experimental interface.
Thumbnail Generation
Salient thumbnails were generated programmatically using the open-source Saliency Toolbox (http://saliencytoolbox.net), which generates saliency maps of images using the Itti-Koch model of Visual Attention. The code takes a bottom-up approach, using an iterative sampling process to scan the input image for pixels with high intensity scores (the most distinctive color values) and regions that it can detect as distinct objects separate from the background. These regions compete in a winner-takes-all contest in order to select a single most salient region, which is then presented in a saliency map (Walther & Koch, 2006). Since Saliency Toolbox provides the x,y coordinates of the winning regions’ central pixel, and because its winning region tends to be small, it is possible to generate thumbnails with a few modifications to the code.
The thumbnail generation technique used in this experiment is based in part on a paper from the International Conference on Interaction Sciences by Amrutha et. al
only the Itti-Koch model, resulting in saliency maps with small regions of interest that sometimes excluded almost all of the background from the original image. To counter this effect, the cropping rectangle applied to the most salient region employed a much larger buffer than Amrutha et al.’s approach.
In order to generate a set of salient thumbnail images, the full-size scans were first run through Saliency Toolbox9 in order to obtain x,y coordinates for the central point of the most salient region identified in the image. Images were then cropped to a 600 pixel by 600 pixel region centered on those coordinates. None of the images used in the experiment had a length or width of less than 600 pixels. In cases where one or both of the coordinates was located less than 300 pixels away from an edge of the original image (making selection of a full 600x600 square centered on those coordinates impossible), the bounding box began at the edge of the original image nearest to that coordinate. For example, an image that was 1000 pixels square and had its most salient region centered at coordinates (50, 500) would position the top left corner of the bounding box at
coordinates (0, 200). Finally, thumbnails were scaled down to a 275x275 square, about the largest a thumbnail could be that might reasonably be used for a real online
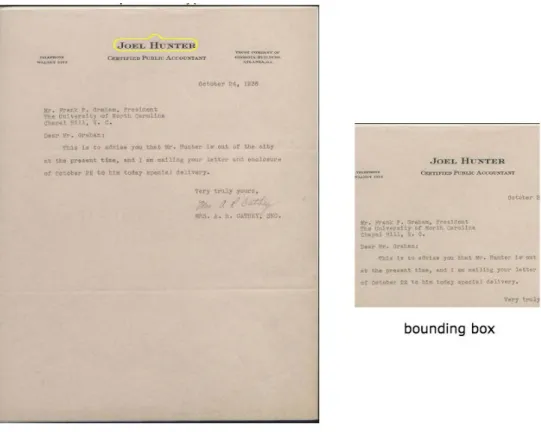
Figure 1. The saliency map (showing the most salient region in yellow) generated from a document in the Economic Security Advisory Council document set and the resulting bounding box for the thumbnail, centered as closely as possible on the salient region.
This technique appeared reasonably successful at identifying areas of interest on the original documents and creating thumbnails centered on those areas. Letterheads, images and seals, or areas of a scan where the text was larger and darker than on the rest of the page (for example, a large signature) tended to feature in the salient thumbnails. Even on documents that weren't particularly distinctive (just blocks of text), the
thumbnails reliably featured a portion of the image containing images or characters rather than the margins.
errors as the image’s most salient region (see Figure 2). Fortunately scans with such defects were rare in the Frank Porter Graham Papers, and none of the images belonging to the two document sets curated for this experiment happened to contain any. However, using this process on a document set containing many errors could be problematic. Similarly, the inclusion of goldenrods or scale markers in scans, a practice not uncommon in digitization of archival documents, might fool a naïve saliency-based model into creating thumbnails centered on those objects instead of on a feature of the document.
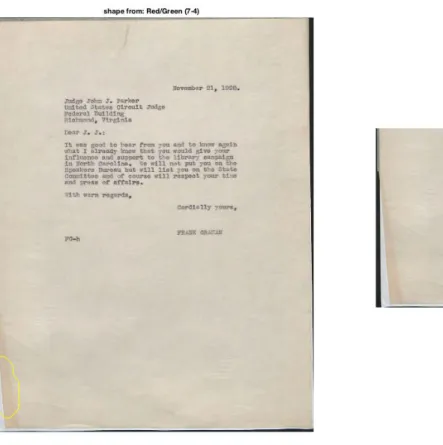
Figure 2. A saliency map that identifies a scanning defect as the image’s most salient region, and the resulting thumbnail.
Full thumbnails were generated by simply scaling down the original image so that its largest dimension (length or width) was 275 pixels. This was straightforward to
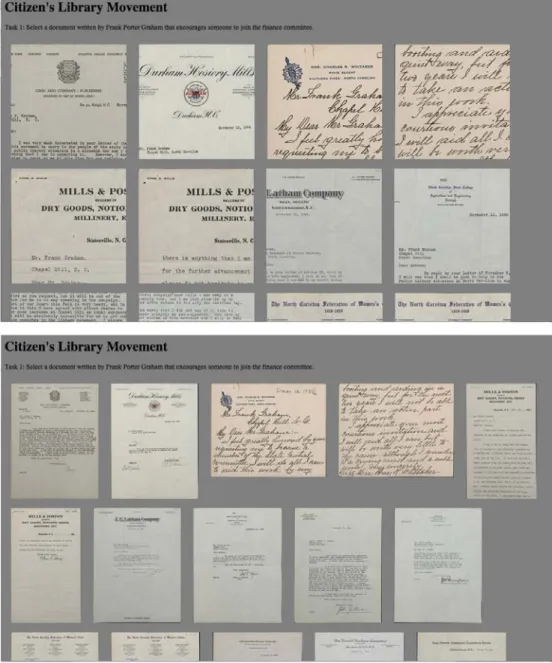
Figure 3. Screenshots of two versions of the experimental interface for the Citizen's Library Movement document set, showing the difference between salient (top) and full (bottom) thumbnails on a screen that is the same size. For a similar comparison of the Economic Security Advisory council, see Appendix C, Figure 9.
Participants
UNC’s School of Information and Library Science. Many participants did not require the full hour to complete the session. All sessions took place over the course of three weeks, from 16 February 2016 to 4 March 2016. Students had to confirm that they were at least 18 years old, currently enrolled as an undergraduate, and fluent in English before
beginning the experiment. Participants were spread across all four years of study, with 58.3% identifying as first years or sophomores and 41.6% identifying as juniors or seniors. A majority of participants had at least some experience working with archival material before the experiment. 50% stated that they had previously worked with archival materials one or two times, 33.3% percent stated that they had never worked with
archival materials, and 16.7% stated that they had worked with archival materials three to five times in the past. All participants were able to complete the tasks for the study, and all received ten dollars as compensation at its conclusion.
Experiment Procedure
background and instructions for the interface, which the moderator reviewed with them (see Appendix B). Participants were given a few minutes to read the sheet and instructed to tell the moderator when they were ready to begin. Once they indicated they were ready, the moderator turned on the monitor, which had been loaded with the screen for the first task. The moderator read the name of the first document set and instructions for the first task aloud, then provided a brief demonstration of the interface by clicking on the first thumbnail to show a document at full size, indicating the “found it” button and stating that clicking it would guide the participant on to the next task, and clicking the close button (see Figure 4) to return to the task screen (see Figure 3). The moderator then stepped back from the monitor and instructed the participant to begin when ready and work at their own pace. The moderator remained in the room for the duration of the experiment but did not intervene unless the participant asked a question.
Figure 4. Screenshot of document viewer displaying the “found it” button and close button (the small white x) before the found it button has been clicked.
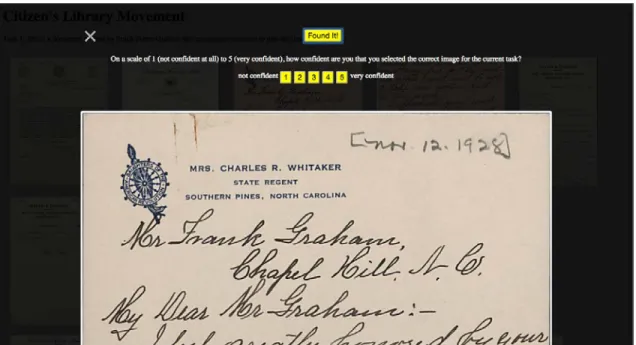
Figure 5. Screenshot of document viewer after the “found it” button has been clicked, prompting for input before the next task begins
see which folder they were looking at and which task they were being asked to complete by looking at the upper right hand corner of the screen. The interface alternated between document sets so that a finding task in one set was always followed by a finding task in the other. Each task was specific to its document set, i.e. tasks 1 and 3 were always presented with the Citizen’s Library Movement and tasks 2 and 4 were always presented with the Economic Security Advisory Council. Moving at their own pace, participants were asked to use the interface to complete the following tasks:
1. Select a document from a librarian that mentions receiving a donation. (Citizen’s Library Movement)
2. Select a document signed by Graham's vice-chairman, Paul Kellogg, that
mentions the New York Herald Tribune. (Economic Security Advisory Council) 3. Select a document written by Frank Porter Graham that encourages someone to
join the finance committee. (Citizen’s Library Movement)
4. Select a document in which someone declines to add his or her name to Graham's proposed statement and expresses regret that Social Security has become a
partisan issue. (Economic Security Advisory Council)
After completing the initial four finding tasks, participants were directed to a web
page containing an article about Frank Porter Graham and instructed to read the main text
of the page. The text contained approximately 1300 words and three images: two portraits
of Graham and one poster.11 On average, the article took 304.83 seconds to read. The
article provided an interlude between the finding and re-finding tasks by presenting text
and images that were related to, but different from, the content presented in the
same website in between consulting other sources on their topic of interest, and this
activity was meant to simulate a version of that experience. Once they completed reading
the article, participants informed the moderator that they were ready to continue, and the
moderator loaded the screen for the first re-finding task. They were instructed to re-find
the same four documents in the same order that they identified them initially. For each
re-finding task, participants were given the same instructions and interface they had
previously seen for the corresponding finding task.
In order to control for learning effect and other confounding variables, the order in which the document sets were presented and the type of thumbnail used to represent each set differed from session to session. Although all participants saw both document sets, they saw only one thumbnail version for each. Half of the participants saw the
Citizen’s Library Movement document set represented by full thumbnails and the
Economic Security Advisory Council represented by salient, while the other half saw
salient thumbnails for the Citizen’s Library Movement and full for the Economic Security
Advisory council. No participant saw the same type of thumbnails for both document
sets.
Given the constraint of alternating between document sets, the two variables (type of thumbnails and which task is seen first) allow for a total of sixteen different
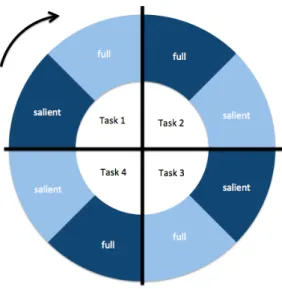
configurations, eight of which were used in the experiment. To visualize how conditions were established, it may be helpful to think of each task as existing on a section of a circle. The experiment could begin with any task and either thumbnail condition, but once the conditions for the first task were established, the participant had to complete the remaining four tasks by moving clockwise around the circle, using the opposite
thumbnail condition for the next task (see Figure 6). Moving counter clockwise around the circle would have resulted in an additional eight valid configurations; however, due to the challenges of obtaining a sample size large enough to balance all sixteen possible configurations, only eight were used.
Figure 6. Diagram representing the possible configurations for the experiment. A participant may start at any of the eight segments on the outer ring, but they must subsequently move clockwise around the circle, visiting only segments that are the same color as the one representing the condition for the starting task, until they have visited all four tasks.
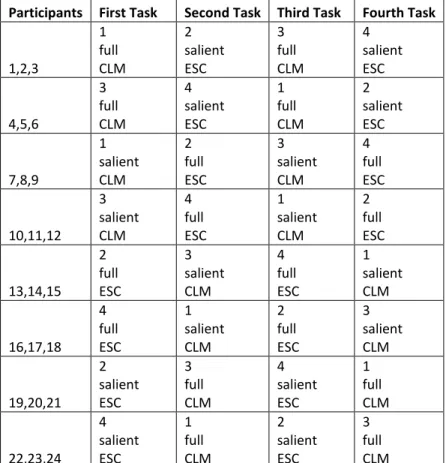
assigned using a random number generator. Once a configuration had been used for three participants, it was not assigned again. For the exact conditions used for each participant, see Table 1. Stating the document set for each task is technically redundant, since tasks 1 and 3 could only be completed using the Citizen’s Library Movement (CLM) document set and tasks 2 and 4 could only be completed using the Economic Security Advisory Council document set (ESC), but it has been included for convenience. The table also shows only the first through fourth tasks (i.e. the finding tasks) because the fifth through eighth tasks (i.e. the re-finding tasks) used exactly the same conditions as the initial four.
Participants First Task Second Task Third Task Fourth Task
1,2,3 1 full CLM 2 salient ESC 3 full CLM 4 salient ESC 4,5,6 3 full CLM 4 salient ESC 1 full CLM 2 salient ESC 7,8,9 1 salient CLM 2 full ESC 3 salient CLM 4 full ESC 10,11,12 3 salient CLM 4 full ESC 1 salient CLM 2 full ESC 13,14,15 2 full ESC 3 salient CLM 4 full ESC 1 salient CLM 16,17,18 4 full ESC 1 salient CLM 2 full ESC 3 salient CLM 19,20,21 2 salient ESC 3 full CLM 4 salient ESC 1 full CLM 22,23,24 4 salient ESC 1 full CLM 2 salient ESC 3 full CLM
Table 1. Task id, thumbnail condition, and document set in the order presented to each participant.
page load and end time was captured when the “found it” button was clicked. This decision included reading the name of the document set and the task as part of the task, but excluded selecting a confidence value. For the first task, the page was loaded before the participant arrived. Immediately before the participant began task one, the moderator provided a short demonstration by clicking on a thumbnail to show how to open the document viewer, then closed it and instructed the participant to begin. Start time was recorded from the moment the researcher closed the document viewer, handing control to the participant.12 The interface captured how many thumbnails they clicked on before indicating that they had found the document for the current task, including which thumbnails and in what order. It also recorded the confidence score and re-finding comment for each task. A confidence score value was required before the participant could move on to the next task, while a re-finding comment was optional and was only requested in the re-finding tasks.
Notes
8 Digitized content used for this study can be accessed at http://www2.lib.unc.edu/mss/inv/g/Graham,Frank_Porter.html
9 This study used Saliency Toolbox version 2.3 with default settings and parameters. It was run on a Macbook Air running Mac OS X Yosemite and MatLab R2014b.
Downloads can be requested at http://www.saliencytoolbox.net/download.html. 10 MatLab R2014b on a Macbook Air running Mac OS X Yosemite.
11 Text by J. Carlyle Sitterson available at http://ncpedia.org/biography/graham-frank-porter.
R
ESULTSResults for this study were concerned with measuring any main effects of task type, thumbnail type, and task id on the evaluation metrics used in the study (completion time in seconds between the start of the task and the end, thumbnails clicked between the start of the task and the end, participants’ reported confidence rating, and success rate) as well as any interaction effects between task type and thumbnail type or between task type and task id. Results did not consider success rate by task type due to the different coding scheme used for finding and re-finding tasks. All observations are addressed in the following five research questions:
RQ1. Does task type (finding v. re-finding) have an effect on a) completion time, b)
thumbnails clicked, or c) confidence?
RQ2. Does thumbnail type (salient v. full) have an effect on a) completion time, b)
thumbnails clicked, c) confidence, or d) success rate?
RQ3. Does the specific task (task id) have an effect on a) completion time, b) thumbnails
clicked, c) confidence, or d) success rate?
RQ4. Is there an interaction effect of task type and thumbnail type for a) completion
time, b) thumbnails clicked, or c) confidence?
RQ5. Is there an interaction effect of task type and task id for a) completion time, b)
Coding Success and Failure
For each finding task, there was only one document in the associated set that fully met the criteria provided in the instructions for that task. The tasks were not designed to be particularly deceptive; however, most participants struggled with them. To receive a perfect score on all eight tasks, participants needed to select the expected document for each of the four finding tasks, then select the same four documents in the same order for the four corresponding re-finding tasks. Only five participants (20.8%) out of the total 24 successfully completed all eight tasks.
Among those who selected an incorrect document for a finding task, participants frequently satisfied a portion the given criteria but did not identify an exact match. For example, for task 1: “Select a document from a librarian that mentions receiving a donation,” eight participants (33.3%) selected the same incorrect document. This incorrect document mentions a donation received on behalf of the Citizen’s Library Movement, but the letterhead clearly identifies the author as a “dealer in dry goods, notions, shoes millinery, etc.” rather than as a librarian. Similarly, for task 4: “Select a document in which someone declines to add his or her name to Graham's proposed statement and expresses regret that Social Security has become a partisan issue,” four participants (16.7%) selected the same incorrect document. In that document, an
criteria without fully satisfying it. Only three participants had a failure on a finding task, and no participant had more than one failure out of the four finding tasks.
For re-finding tasks, success was defined as correctly identifying the same document as the one selected for the corresponding finding task, even if the document initially selected for that finding task was not the original target. This definition is derived from the expected behavior of participants who followed instructions after making a mistake on a finding task, since when the re-finding portion of the study began they were told verbally, “do exactly what you did for the first four tasks.” The definition does not allow partial success, since a document selected for a re-finding task must be either the same one selected for the earlier finding task or not. Five participants (20.8%) selected an incorrect document for a re-finding task, and no participant made more than one re-finding error.
However, one of these five participant’s data for a re-finding task was excluded from the dataset due to a unique re-finding scenario. This participant selected an incorrect document for the initial finding task and appeared to realize their mistake during the associated re-finding task, selecting the expected document and writing “I don't think I chose this on the first try” when prompted to explain whether the thumbnail had helped them recognize the document as one which they had selected previously. Since none of other participants provided a comment like this at the end of a re-finding task, it is impossible to know whether any more participants recognized their mistake as they continued with the experiment.
had during the associated finding task. All four true re-finding mistakes occurred when participants were using full thumbnails. Participants did not make any re-finding mistakes when they were using salient thumbnails, except for the unusual case mentioned above.
Success
In order to determine if task type or thumbnail type had an effect on the success rate, several Pearson’s square tests were run on subsets of the data. Pearson’s chi-square was deemed appropriate since success for each task was coded in mutually exclusive categories as either failure, partial success, or success for finding tasks, and either failure or success for re-finding tasks. Due to the nature of a chi-square test and the fact that different categories were applied to different task types, it was not possible to directly compare success and failure rates for finding versus re-finding tasks. However, within the finding and re-finding tasks, the study was interested in determining whether the categorical variables of thumbnail type (salient v. full), and task id (1, 2, 3, or 4) had any effect on the success rate.
There was a significant effect of thumbnail type on task success χ2(1, N=95) = 4.089, p = .043 for re-finding tasks only. During re-finding tasks, failures were more likely to occur (indeed, they only occurred) when participants were using salient
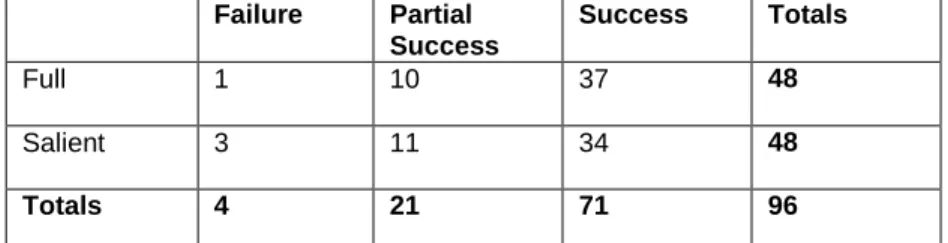
thumbnails (see Table 2). For finding tasks, there was no significant effect of thumbnail type on task success, χ2(2, N=96) = 1.174, p = .556 (see Table 3). This analysis answers
RQ2 part d: there is a significant effect of thumbnail type on success for re-finding tasks,
Failure Success Totals
Full 4 44 48
Salient 0 47 47
Totals 4 91 95
Table 2. Failure and success counts by thumbnail type for re-finding tasks only.
Failure Partial Success
Success Totals
Full 1 10 37 48
Salient 3 11 34 48
Totals 4 21 71 96
Table 3. Failure, partial success, and success counts by thumbnail type for finding tasks only
Within the finding tasks, there was an effect of task id on success rate, χ2(6, N=96) = 17.981, p = .006, with tasks 1 and 4 being more prone to partial successes than tasks 2 and 3 (see Table 4). Within the re-finding tasks, there were more failures for task 1 than any of the other tasks, but the effect was not significant, χ2(3, N=95) = 6.200, p =
.102 (See Table 5). This analysis answers RQ3 part d: there is a significant effect of task id on success rate for finding tasks, but not for re-finding tasks.
Task ID Failure Partial
Success
Success Totals
1. From a librarian that mentions receiving a donation. (CLM)
1 11 12 24
2. Signed by Graham's vice-chairman, Paul Kellogg, that mentions the New York Herald Tribune. (ESC)
2 1 21 24
3. Written by Frank Porter Graham that encourages someone to join the finance committee. (CLM)
0 2 22 24
4. In which someone declines to add his or her name to Graham's proposed statement and expresses regret that Social Security has become a partisan issue. (ESC)
1 7 16 24
Totals 4 21 71 96
Task ID Failure Success Totals 1. From a librarian that mentions receiving a
donation. (CLM)
3 21 24
2. Signed by Graham's vice-chairman, Paul Kellogg, that mentions the New York Herald Tribune. (ESC)
1 22 23
3. Written by Frank Porter Graham that encourages someone to join the finance committee. (CLM)
0 24 24
4. In which someone declines to add his or her name to Graham's proposed statement and expresses regret that Social Security has become a partisan issue. (ESC)
0 24 24
Totals 4 91 95
Table 5. Failure and success counts by task id for re-finding tasks only.
Effect of Thumbnail Type and Task Type on Task Time
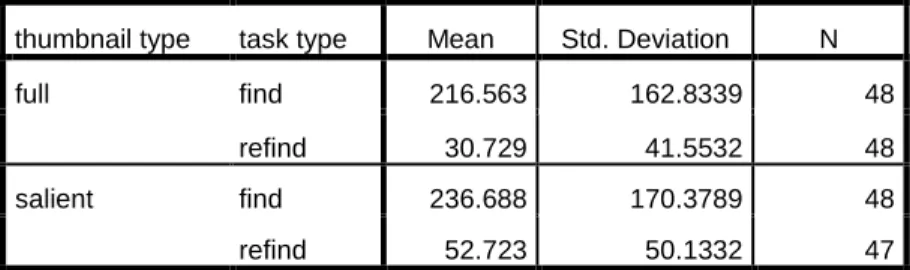
A 2X2 ANOVA that considered thumbnail type (salient v. full) and task type (find v. re-find) found no significant interaction effect for task type and thumbnail type on seconds to completion, F(1, 187)=.003, p=.958. The test did identify a significant main effect for task type, F(1, 187) = 108.731, p<.0001, with finding tasks requiring less time to complete than re-finding tasks. It did not reveal a significant effect for thumbnail type, F(2, 187)=1.411, p=.236. The average number of seconds to completion was higher for salient thumbnails than for full thumbnails under both task type conditions; however, the observed difference was weak (see Table 6). This analysis addressed RQ4 part a: there was no interaction effect for task type and thumbnail type on time to completion, RQ2 part a: there was no main effect of thumbnail type on seconds to completion, and
RQ1 part a: there was a main effect of task type on seconds to completion, with finding
thumbnail type task type Mean Std. Deviation N
full find 216.563 162.8339 48
refind 30.729 41.5532 48
salient find 236.688 170.3789 48
refind 52.723 50.1332 47
Table 6. Average seconds to completion by thumbnail type and task type.
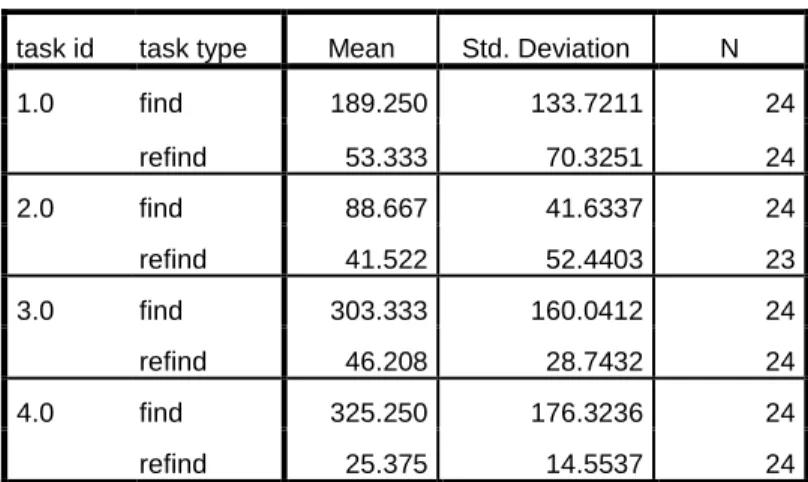
Effect of Task Type and Task ID on Task Time
A 2x2 ANOVA that considered task type (find v. re-find) and task id (1, 2, 3, or 4) revealed a significant interaction between task type and task id, F(3, 183)=14.766, p<.0001. Analysis found a significant effect of task type on time to completion during finding tasks, F(3, 183)=27.010, p<.0001, but no significant effect of task type on time to completion during re-finding tasks, F(3, 183)=.316, p=.814. Post-hoc pairwise
comparison tests revealed that, in the finding condition, all tasks were significantly different from one another except for tasks 3 and 4 (see Table 8). When task 2 was completed in the finding condition, on average it took nearly 100 fewer seconds than the next fastest finding task, task 1, which was in turn completed almost 100 seconds faster than tasks 3 and 4 (see Table 7.) This analysis addresses RQ3 part a: task id had a significant effect on task time, and RQ5 part a: there was a significant interaction
task id task type Mean Std. Deviation N
1.0 find 189.250 133.7211 24
refind 53.333 70.3251 24
2.0 find 88.667 41.6337 24
refind 41.522 52.4403 23
3.0 find 303.333 160.0412 24
refind 46.208 28.7432 24
4.0 find 325.250 176.3236 24
refind 25.375 14.5537 24
Table 7. Average seconds to complete by task id and task type.
Pairwise Comparisons
Dependent Variable: seconds to complete
task type (I) task id (J) task id
Mean
Difference
(I-J) Std. Error Sig.b
95% Confidence Interval
for Differenceb
Lower
Bound
Upper
Bound
find 1.0 2.0 100.583* 29.825 .001 41.738 159.429
3.0 -114.083* 29.825 .000 -172.929 -55.238
4.0 -136.000* 29.825 .000 -194.845 -77.155
2.0 1.0 -100.583* 29.825 .001 -159.429 -41.738
3.0 -214.667* 29.825 .000 -273.512 -155.821
4.0 -236.583* 29.825 .000 -295.429 -177.738
3.0 1.0 114.083* 29.825 .000 55.238 172.929
2.0 214.667* 29.825 .000 155.821 273.512
4.0 -21.917 29.825 .463 -80.762 36.929
4.0 1.0 136.000* 29.825 .000 77.155 194.845
2.0 236.583* 29.825 .000 177.738 295.429
3.0 21.917 29.825 .463 -36.929 80.762
Based on estimated marginal means
*. The mean difference is significant at the .050 level.
b. Adjustment for multiple comparisons: Least Significant Difference (equivalent to no adjustments). Table 8. Pairwise comparison of task id on seconds to complete for finding tasks.
Effect of Thumbnail Type and Task Type on Thumbnails Clicked
and task type on the number of thumbnails clicked, RQ2 part b: there was no main effect of thumbnail type on the number of thumbnails clicked, and RQ1 part b: there was a significant main effect of task type on thumbnails clicked.
Effect of Task ID and Task Type on Thumbnails Clicked
A 2X2 ANOVA that considered task id and task type found a significant interaction between task id and task type on the number of thumbnails clicked, F(3, 183)=11.522, p<.0001. It found a significant simple main effect of task id on thumbnails clicked during finding tasks, F(3, 183)=17.261, p<.0001 but no simple main effect of task id on thumbnails clicked during re-finding tasks, F(3, 183)=1.243, p=.295. For the
Figure 8. Interaction of task id and task type on thumbnails clicked.
Pairwise Comparisons
Dependent Variable: thumbnails clicked
task type (I) task id
(J) task
id
Mean
Difference
(I-J) Std. Error Sig.b
95% Confidence Interval
for Differenceb
Lower
Bound
Upper
Bound
find 1.0 2.0 3.542 2.415 .144 -1.224 8.307
3.0 -10.625* 2.415 .000 -15.391 -5.859
4.0 -9.875* 2.415 .000 -14.641 -5.109
2.0 1.0 -3.542 2.415 .144 -8.307 1.224
3.0 -14.167* 2.415 .000 -18.932 -9.401
4.0 -13.417* 2.415 .000 -18.182 -8.651
3.0 1.0 10.625* 2.415 .000 5.859 15.391
2.0 14.167* 2.415 .000 9.401 18.932
4.0 .750 2.415 .757 -4.016 5.516
4.0 1.0 9.875* 2.415 .000 5.109 14.641
2.0 13.417* 2.415 .000 8.651 18.182
3.0 -.750 2.415 .757 -5.516 4.016
Based on estimated marginal means
b. Adjustment for multiple comparisons: Least Significant Difference (equivalent to no
adjustments).
Table 9. Pairwise comparisons of task id on thumbnails clicked for finding tasks.
Effect of Thumbnail Type and Task Type on Confidence
A 2X2 ANOVA that considered thumbnail type and task type found no significant interaction effect between thumbnail type and task type on confidence, F(1, 187) = .640, p= .425. The test revealed a significant main effect for task type, F(1, 187) = 14.058, p<.001, with participants likely to report a higher confidence value for re-finding tasks than finding tasks. There was no significant main effect for thumbnail type, F(1, 187) = .094, p=.760. This analysis addressed RQ1 part c: confidence was significantly higher for re-finding tasks, RQ2 part c: there was no main effect of thumbnail type on confidence, and RQ4 part c: there was no interaction effect of thumbnail type and task type on confidence.
Effect of Task ID and Task Type on Confidence
A 2x2 ANOVA that considered task ID and task type found no significant interaction between task id and task type on confidence, F(3, 183)=2.314, p=.077. As observed in the previous test, there was a significant main effect of task type, F(1, 183)=16.649, p<.0001. There was also a significant main effect of task id, F(3,
addressed RQ3 part c: there was a main effect of task id on confidence value, and RQ5 part c: there was no interaction effect of task ID and task type on confidence.
User Preference
At the end of the experiment, participants were asked whether they preferred one type of thumbnail over the other, as well as which properties they found most useful for recognizing thumbnails (for the full survey, see Appendix D). Opinions were split, with 12 participants (50%) preferring full thumbnails, 10 (41.7%) preferring salient, and 2 (8.3%) stating no preference. Participants were also asked to rate four thumbnail features (the thumbnail’s position relative to other thumbnails on the page; the layout of the text as you could see it on the thumbnail, including blank space; the color of the thumbnail; and reading words on the thumbnail) as extremely important, very important, somewhat important, a little important, or not important. Opinions were mixed here as well, although there did seem to be some agreement that color was the least important. 11 (45%) rated “The layout of the text as you could see it on the thumbnail, including blank space” as extremely important or very important. 13 (54.2%) rated “Reading words on the thumbnail” as extremely important or very important. 9 (37.5%) rated “The
thumbnail’s position relative to other thumbnails on the page” as extremely important or very important. 7(29.2%) rated “The color of the thumbnail” as very important.
position layout color
reading words.
Extremely Useful 3 1 0 6
Very Useful 6 10 7 7
Somewhat Useful 7 9 6 4
A Little Useful 6 3 8 6
Not Useful at All 2 1 3 1
D
ISCUSSIONThis experiment considered whether, for a digitized archival collection,
thumbnails generated using a salient cropping technique could offer any advantage over thumbnails created by simply scaling down an image. While salient thumbnails might offer some advantages over full thumbnails, gains were modest. Very few significant statistical differences were identified regarding the difference between full thumbnails and salient thumbnails besides the result that they might increase the possibility of a participant mistaking one document for another during re-finding tasks. The better
accuracy of full thumbnails may come at the expense of time, since re-finding tasks using full thumbnails took longer than re-finding tasks with salient thumbnails (see Table 6); however, the difference was not statistically significant.
It is also important to note that the salient thumbnails in this experiment were all displayed at a size that allowed most of them to include at least some readable text, and all salient thumbnails contained at least some textual information. Participants generally rated both the layout of text on the thumbnail (a property emphasized in full thumbnails) and the ability to read words on the thumbnail (a property emphasized in salient
instead of the document’s true features. This type of error resulted in thumbnails that were worse than full thumbnails at representing layout and also provided few clues about the documents’ content (see Figure 2).
This experiment hypothesized that salient thumbnails might allow users to identify the correct document for a task, or at least reject some portion of the document set as incorrect, without having to click on as many thumbnails to view them at full size. The idea that zooming in on some significant portion of a document in order to make the text on a thumbnail legible is not novel, and it can decrease the amount of time required to find documents in some scenarios. In a similar experiment by Asai et al., (2011), zoomed in thumbnails reduced the amount of time required to find documents. However, statistical tests indicate different results for this experiment. There was no significant difference in the number of thumbnails clicked as an effect of thumbnail type, nor was there a significant difference in the number of seconds required to complete the task. Even though Asai et al.’s experiment examined thumbnail representations of textual documents, it considered digital born handwritten notes instead of archival material. The researchers expected their participants to be familiar with digital note taking, and they framed their experiment as an exploration of thumbnail representations for digital note taking services, which support users navigating collections of content that they created themselves. It is possible that archival documents are simply too unfamiliar and difficult to analyze for users to make quick decisions without viewing the documents at full size, even with the best possible thumbnails.
the fact that the suitability of a thumbnail for a given task often depends on whether the thumbnail happens to contain some portion of the information that a user is looking for, and both full and salient thumbnails might meet that requirement. Depending on the task, users might consider either type of thumbnail more suitable.
For instance, tasks 2 and 3 asked participants to find a document signed by a named individual. Since the salient thumbnails had a tendency to feature signatures or letterheads, they tended to be useful for these kinds of tasks. When asked to elaborate on their preference, seven participants (29.1%) mentioned that they liked how the salient thumbnails tended to include information about who had authored the letter or received it, even if they preferred the full thumbnails overall. In addition, the tendency of the saliency software to focus on letterheads and the large size of the bounding box sometimes
resulted in salient thumbnails that included information about both the sender and receiver of a given letter by featuring the letterhead and salutation (see Figure 1).
However, full thumbnails also sometimes included information about the sender and the receiver. Letterheads and signatures tend to be larger and darker than the body text, so the very properties that make them good targets for saliency software also make them the most legible feature in full thumbnails. The full thumbnails used in this
These preferences are heavily dependent on the scope of the study being limited to correspondence, and the fact that several tasks explicitly required participants to make note of senders and recipients as they searched for documents to meet the task criteria. Opinions could have differed substantially if the tasks had instead required participants to examine diaries, reports, maps, photographs, or one of the many other document types that are represented in digital archives. However, it is encouraging that many users preferred salient thumbnails because they had a tendency to contain information that was useful for certain search tasks.
More insidiously, user preference may not correlate with whether a particular interface tends to increase the likeliness of mistakes if users do not realize they have made one. For instance, the chi-square test measuring success for re-finding tasks shows that full thumbnails increase the probability of mistaking one document for another (see Table 2). However, if users do not notice that they have selected the wrong image, they might report high satisfaction with an interface that that causes them to become more error-prone. For one participant this appeared to be the case: the individual wrote after the experiment that “The images that weren't cropped made it easier mostly to re-find images,” apparently unaware that they had just incorrectly completed a re-finding task using a full thumbnail.
thumbnails for finding tasks and two that they preferred salient thumbnails for re-finding. One participant mentioned that they liked the full thumbnails for re-finding because they were “quicker.” However, most participants did not state a preference for one type of thumbnail for re-finding tasks. Ten participants took the stance that thumbnail suitability depended more on the task and the type of information they were looking for, while the remaining nine stated that their preference did not change.
The differences observed between the four finding tasks seem to reveal more about searching habits than thumbnail preference. The interaction effects observed between task id and task type for time to completion (see Figure 7) and for thumbnails clicked (see Figure 8) indicate that the difficulty of the four tasks was much more variable between finding tasks than between re-finding tasks, with re-finding tasks
harder to identify it initially. Even if this were the case though, the effect would be small compared to the high variability between finding tasks and the low variability between re-finding tasks.
The differences between the task ids appear to mark task 2 as the easiest finding task, task 1 as moderately difficult, and tasks 3 and 4 as the most difficult finding tasks. Task 2 received significantly higher confidence ratings than tasks 3 and 4, while task 1 received a significantly higher confidence rating than task 4. Tasks 1 and 2 also required less time to complete and fewer thumbnail clicks than tasks 3 and 4. These differences were statistically significant for tasks 1 and 2 compared to each other and to tasks 3 and 4 for seconds to complete (see Table 8), but only significant for task 2 compared to tasks 3 and 4 for thumbnails clicked (see Table 9). The relationship between the tasks is still visible in the graph considering the effect of task id and task type on thumbnails clicked (see Figure 8), but the coarser metric of thumbnail clicks probably resulted in a
statistically weaker observation than a similar effect on seconds to complete.
From the data, it appears that task 2 was substantially easier than tasks 3 and 4, while task 1 was at least slightly more difficult than task 2 and slightly less difficult than tasks 3 and 4. Tellingly, the target images for tasks 3 and 4 occurred later in the
complete tasks 3 and 4 probably resulted from the fact that many of them began each task at the top of the webpage and worked their way through almost the entire document set before completing the task, taking them substantially longer and requiring them to examine more thumbnails before completing the tasks. The observed difference between 1 and 2 may be related to the high number of partial successes for task 1 in the finding condition. Even though the target documents for tasks 1 and 2 are similarly close to the beginning of their respective document sets, the existence of an incorrect “red herring” document that many people selected for task 1 likely made task 1 more difficult.
Common partial success errors on finding tasks also lend support to the idea that participants favored documents placed close to the beginning of the document set. Two documents in particular showed up repeatedly as incorrect responses for the finding tasks 1 and 4. Again, both of these incorrect documents appear closer to the beginning of the document set than the correct, expected documents. Both of these documents were considered partial successes, as they met part of the criteria stated for the task, but not all of it. The prevalence of these repeated errors, as well as the prevalence of partial
successes in general among the finding tasks, seem to indicate that many participants engaged in satisficing behavior during the study, submitting documents that were “good enough” before exploring the full document set.
This experiment did not attempt to consider motivations for submitting a partially correct document for a finding task, as it was not anticipated that so many participants would do so. However, further research into interfaces for archival websites could benefit from studies that attempt to tease apart motivations for satisficing, especially since
C
ONCLUSIONThumbnails generated using image saliency software may offer an advantage to archival websites. However, the advantages measured in this study were relatively modest and occurred mostly for re-finding tasks. One of the most promising
characteristics of salient thumbnails over full thumbnails may be their ability to present similar-looking documents in distinctive ways, reducing the likelihood of a user
confusing one document for another. Both thumbnail types allowed users to re-find previously identified documents much more quickly than it took them to find the document initially.
On the other hand, the saliency software’s inability to distinguish between
characteristics of the documents and characteristics of the scans when identifying regions of interest could be problematic for institutions whose digitized collections contain scanning errors or contextual information. Generally, the characteristics of the search task, including how far into the document set a participant had to look in order to identify the correct document, seem to have a stronger effect on nearly all the dependent variables used to measure user performance than thumbnail type.
materials. It may be the case that researchers working with digital archives are often frustrated by similar looking thumbnails when they attempt to revisit a meaningful document, and salient thumbnails could alleviate this problem. However, it is also
possible that archival documents are so dense and information rich that researchers prefer to view nearly every document at full size as they explore a document set, and salient thumbnails would offer them little additional benefit.
A
PPENDIXA:
C
ODE FORT
HUMBNAILG
ENERATIONSalient Thumbnails
The following MatLab code was used to generate salient thumbnails from the output provided by Saliency Toolbox. In this example, the output from five images has been placed in the array saliencyWinners, where salincyWinners[1] is a sequential image id number, saliencyWinners[2] is the x coordinate of the most salient region in the image, and saliencyWinners[3] is the y coordinate.
saliencyWinners = [
1, 369,268
2, 447,596;
3, 272,1365;
4, 393,880;
5, 440,344; ];
n = 1;
while n <= numel(saliencyWinners)/3;
fileNumber = int2str(saliencyWinners(n, 1)); filename = strcat(fileNumber, '.jpeg');
image = imread(filename);
[y,x,z] = size(image);
winnerx = saliencyWinners(n, 2); winnery = saliencyWinners(n, 3);
if(winnerx-300)<0
winnerx=0;
elseif(winnerx+300)> x winnerx = x-600;
else winnerx = winnerx-300; end
if(winnery-300) < 0
winnery = 0;
elseif(winnery+300) > y winnery = y-600;
end
rect = [winnerx, winnery, 600, 600]; fprintf('winnerx = %f\n', winnerx); fprintf('winnery = %f\n', winnery); output = imcrop(image, rect); output =imresize(output, 275/600);
outputName = strcat('salient_', fileNumber, '.jpeg'); imwrite(output, outputName);
n = n+1; end;
Full Thumbnails
The following MatLab code was used to generate full thumbnails by reading in a directory of input images. It is a standalone function that was not combined with any output from Saliency Toolbox.
files = dir('*.jpeg');
for i = 1:numel(files) filename = files(i).name; image=imread(filename);
newFilename = strcat('full_', filename); [x,y] = size(image);
if (y/3)>x
output = imresize(image, 275/(y/3)); imwrite(output, newFilename); else
output = imresize(image, 275/x); imwrite(output, newFilename); end
A
PPENDIXB:
P
ARTICIPANTI
NSTRUCTIONSThe following instructions were provided to participants after they had signed an informed consent form and been verbally told the purpose of the experiment. The researcher reviewed the instructions with the participant, then asked them to finish reading on their own and indicate when they were ready to begin working with the interface. Participants retained this sheet as a reference as they worked through the interface.
Historical Background
Frank Porter Graham (b.1886, d.1972) was an activist, professor, and politician from North Carolina. He served as president of the University of North Carolina at Chapel Hill from 1930 to 1949, and many documents related to his life and tenure are kept at UNC’s Southern Historical Collection. The library is in the process of scanning these documents so that it will be possible for students and researchers studying the university to view them online.
You will be looking at documents, specifically letters, related to Graham’s involvement with the Citizen’s Library Movement and the Economic Security Advisory Council.
• Graham founded the Citizen’s Library Movement in 1928 as part of an effort to establish a public library in every county in North Carolina, and the documents you will be reading deal with his efforts to recruit local politicians, businessmen, and volunteers to serve on the movement’s various committees.
• Graham served as chairman of the Economic Security Advisory Council, which was part of President Franklin Delano Roosevelt’s Committee on Economic Security. Composed of business leaders, academics, and
activists, it met from 1934-1936 in order to advise the president’s plans for Social Security legislation. The documents you will be reading deal with Graham’s efforts to gather support for a statement regarding the
Participant Instructions
You will examine these two document sets as thumbnail images on webpages that you can interact with as you complete a series of tasks provided to you.
• Whenever possible, documents will be arranged in chronological order.
• Clicking on a thumbnail will allow you to view a document at full size.
• Closing the full size document viewer will return you to the webpage.
• The name of the current document set (Citizen’s Library Movement or Economic Security Council) and the criteria for your current task will be visible at the top of each page.
• If a task asks you to re-find a particular document, you should select exactly the same document that you selected in the previous related task.
A
PPENDIXC:
S
CREENSHOTSA
PPENDIXD:
E
XITS
URVEYSelect your current class status
o
First yearo
Sophomoreo
Junioro
SeniorBefore this session, how many times had you examined archival materials in any format, for a class, job, or your own interest?
o
Nevero
One or two timeso
Three to five timeso
More than five timesBefore this session, how many times had you examined digital
archival materials?
o
Nevero
One or two timeso
Three to five timeso
More than five timesFor the following questions, please rate how useful each property was for recognizing a thumbnail that you had seen before.
The thumbnail’s position relative to other thumbnails on the page.
o
Not useful at allo
A little usefulo
Somewhat usefulo
Very usefulo
Extremely usefulThe layout of the text as you could see it on the thumbnail, including blank space.
o
Extremely usefulThe color of the thumbnail.
o
Not useful at allo
A little usefulo
Somewhat usefulo
Very usefulo
Extremely usefulReading words on the thumbnail.
o
Not useful at allo
A little usefulo
Somewhat usefulo
Very usefulo
Extremely usefulThe two document sets you saw today were represented by two different types of thumbnails: one that was cropped, and one that showed the entire image. Of the two kinds (cropped and entire image), did you prefer one more than the other? Please explain.
A
PPENDIXE:
I
NFORMEDC
ONSENTF
ORMConsent to Participate in a Research Study
Title of Study: Exploring Image Saliency for Thumbnail Generation in Archival Collections Online.
Consent form version date: 01/25/2016 IRB Study #16-0062
Principal Investigator: Bailey Jones ([email protected])
Principal Investigator Department: School of Information and Library Science Faculty Advisor: Robert Capra ([email protected])
Faculty Advisor Contact: 919-962-9978
What are some general things you should know about research studies?
You are being asked to take part in a research study. To join the study is voluntary. You may refuse to join, or you may withdraw your consent to be in the study, for any reason, without penalty. Details about this study are discussed below. It is important that you understand this information so that you can make an informed choice about being in this research study.
What is the purpose of this study?
The purpose of this research study is to learn how people search through digitized archival collections using thumbnail previews. We will consider whether one type of thumbnail may be more useful for finding and identifying previously seen documents than another.
Are there any reasons you should not be in this study? You should NOT be in this study if:
• You are younger than 18 years old.
• You are not an undergraduate student at UNC Chapel Hill.
• You are not fluent in speaking and writing English.
How many people will take part in this study?
If you decide to be in this study, you will be one of approximately 24 people in this research study.
What will happen if you take part in the study?