1
ABSTRACT
The goal of this research is to determine whether an indicator displacement assay using organic small-molecule receptors and a fluorescent dye lucigenin (LCG) can correctly classify citrullination and acetylation in the context of histone tail peptides. Difference in fluorescent signal, dictated by the displacement of receptor-bound LCG, will be the benchmark by which the post-translational modifications (PTMs) of interest will be classified. Linear discrimination analysis (LDA) will provide the statistical means to visually separate and classify the
fluorescence data for several species into respective categories. The proposed assay schema was shown to be effective in differentiating similarly citrullinated and acetylated peptides at low concentrations (15 µM) and was shown to be sensitive enough for 10 µM in citrullinated H3 tail peptides and 5 µM in acetylated H3 tail peptides.
INTRODUCTION
Histone proteins make up the core of the DNA-protein complexes (nucleosomes) that package DNA into chromatin fibers. A myriad of covalent protein modifications, termed post-translational modifications (PTMs), are found in histones, such as methylation, acetylation, phosphorylation, and citrullination; the diversity of PTMs and their arrangement (termed the histone code) all affect how histones interact with DNA and other nuclear proteins, thus controlling gene expression.
Citrullination is one such PTM; arginine residues are transformed into citrulline residues in a reaction catalyzed by Protein Arginine Deiminase (PAD) enzymes1. Although much remains unknown about citrullination and its physiological roles, biologically
important effects of citrulline have been identified. Methylated arginine residues are demethylated by being citrullinated on the tails of histones 3 and 4 (H3 and H4), suggesting that citrulline plays a role in transcription regulation1. H3 hypercitrullination has been shown to mediate the decondensation of
neutrophil DNA associated with the formation of neutrophil extracellular traps, a natural safety net playing a vital role in innate immunity by binding pathogens and microorganisms4.
Citrullinated histone proteins have been linked to several neurodegenerative and Figure 1. Visual depiction of the histone code in
2 autoimmune diseases, including multiple sclerosis5 and rheumatoid arthritis6. Acetylation,
another common PTM in histones, also serves as an important regulator of biological function. Poly-acetylation of nucleosome histones have been shown to decondense euchromatin regions of DNA during the transcription process to allow for greater access by transcription factors7, and dysregulation of acetylation is associated with several types of cancer.
Because of the different properties of modifications, such as loss of positive charge in acetylation/citrullination, molecules can be
designed to selectively bind to and identify PTMs. Antibodies are a widely used tool in detecting the many PTMs that are possible in histone proteins, displaying high affinity and specificity for a target of interest. However, antibodies can vary in selectivity and can be
expensive2; it has been demonstrated that antibodies that were designed to selectively bind to certain H4 acetylation events (K5, K8, or K12) were found to preferentially bind to H4 peptides with multiple adjacent acetylation events3. It would benefit the further study of PTMs like acetylation and citrullination if there were a method that can detect and selectively differentiate between single, dual and poly-citrullinated and acetylated peptides.
Quantitative mass spectrometry (MS) is commonly used to identify and quantify PTMs on histones, and has been used extensively as the one of the only methods available to detect combinatorial PTMs occurring simultaneously on the same molecule8. While this is a powerful method, it has limitations, including the need for expensive equipment and the inability to perform real-time assays.
Herein, we propose to develop an assay using synthetic receptors to sense and differentiate combinations of PTMs. The assay will allow for real time identification in conjunction with enzymatic assays, as well as being relatively inexpensive. This approach is also high throughput and does not require the use of complicated equipment that requires training to operate. While these receptors certainly won’t replace MS, the addition of another tool for PTM identification would greatly aid in the efforts to study the histone code.
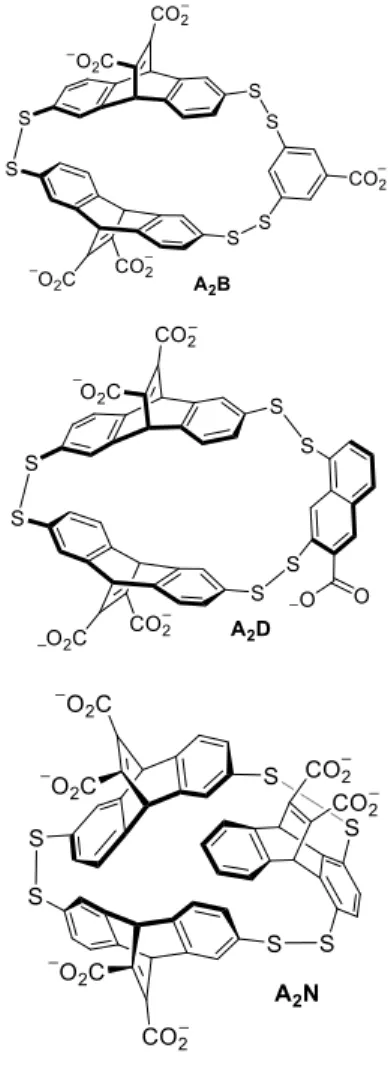
Prior work by the Waters lab has shown that three similar organic receptors consisting of disulfide-linked macrocycles, termed A2B, A2N, and A2D, have affinity in varying degrees for H3 tail peptides with different degrees of methylation on lysine residues. Having shown that
the receptors have affinity for histones, it was necessary to determine whether it was applicable to other PTMs as well.
Initial work with this project confirmed that the organic receptor molecule A2B could differentiate between an unmodified H3 tail and a singly-citrullinated H3 tail; this entailed synthesizing two peptides using solid phase peptide synthesis and using a fluorescent assay to obtain data. The fluorescent assay (Figure 3), based on indicator displacement, is derived from an assay designed by the Nau group, one of the first successful conversions of host-guest
3 chemistry into a biochemical assay9. The dye used is lucigenin (LCG), a
compound that does not fluoresce when bound to the receptor A2B, but does fluoresce when displaced by an arginine residue9. The peptides used were an unmodified H3 tail, residues 1-12, and the same peptide with arginine 8 citrullinated (H3 R8 cit). Both peptides had an additional tyrosine added to the C-terminus to allow for concentration determination.
The initial goal of this research is to be able to classify citrullination events in the context of a histone peptide with fluorescent assays. To determine whether the assay described above can distinguish between multiply, singly, and unmodified histones, all histone derivatives in Table 1 were evaluated. The fluorescence response was then evaluated using all three
receptors: A2B, A2D, and A2N. Because each has slightly different binding preferences, it is expected that their fluorescence response will differ. A sensor array utilizing multiple sensors will provide a pattern of responses which should allow for classification of individual peptides. Using multiple receptors (A2B, A2D and A2N) allows for greater dimensions in the analysis of the data, and by linear discriminant analysis (LDA), we can find clustering of data points that corresponds to each peptide and its response
area10,11. A significant grouping of data points corresponding to each type of H3 tail would be designated as a successful
classification of different citrullination events. To test these receptor molecules for affinity towards other PTMs, expansion from citrullination would logically nominate acetylation, which also results in a loss of charge. A fluorescent assay would be used similarly to how citrullination was
approached: evaluating peptides containing different single and multiple acetylations with the sensor array and LDA analysis.
MATERIALS AND METHODS
Histone (H3) Tail Derivative
Sequence
H3 1-12 ARTKQTARKSTGY
H3 1-12 R8 cit ARTKQTAR(Cit)KSTGY
H3 1-12 R2 cit AR(Cit)TKQTARKSTGY
H3 1-12 R2,8 cit AR(Cit)TKQTAR(Cit)KSTGY
H3 1-12 K4 Ac ARTK(Ac)QTARKSTGY
H3 1-12 K9 Ac ARTKQTARK(Ac)STGY
H3 1-12 R4,9 Ac ARTK(Ac)QTARK(Ac)STGY
Figure 3. Basic diagram of the fluorescent assay used in my previous work, and will be used for the continuation of the
project.
4
Peptide Synthesis
Peptide synthesis was accomplished via solid phase synthesis using FMOC protected amino acid residues on a rink amide resin. Coupling reagents were HBTU/HOBt in DMF. Peptides were synthesized on a Tetras Peptide synthesizer. N-terminus of all peptides were acetylated with a solution of 5% acetic anhydride and 6% 2,6-lutidine in DMF. Cleavage from resin was facilitated with a solution of 2.5% H2O, 2.5% triisopropylsilane and 95% TFA for 3 hours.
Peptides were purified by reverse-phase HPLC on a C18 column with a flow rate of 4 mL/min. Elution was monitored at 214 nm and 280 nm. First purifications of peptides were done with a linear gradient of solvents A and B (A: 95% H2O, 5% CH3CN and 0.1% TFA, B: 95% CH3CN, 5% H2O and 0.1% TFA). Additional purification were done on a similar gradient in which A remains the same, but solvent B was changed to methanol. Purified peptides were lyophilized to a powder and characterized by MS.
Citrullinated peptides were synthesized with 2 equivalents of FMOC-Arg(Cit)-OH and coupled for 4 hours. Acetylated peptides were synthesized with 2 equivalents of FMOC-Lys(Ac)-OH and coupled for 4 hours.
Synthesis of Receptors
Monomers A and B were synthesized following the reported procedure of Corbett, Sanders and Otto.12 Monomer D was synthesized following the reported procedure of Field and Kirrstettler.13 Monomer N was synthesized following the reported procedure of Waters and Pinkin.14
Libraries of receptors (A2B, A2D and A2N) were made in 10 mL aliquots in scintillation
vials, the pH of each was adjusted to 8.5 with 1M HCl and NaOH to fully deprotonate thiols and carboxylic acids. A2B libraries were made using 5mM A and 2.5 mM B along with 10 mM guest
(methylisoquinoline iodide). A2D libraries were made using 5mM A and 2.5 mM D along with
10 mM guest (methylisoquinoline iodide). A2N libraries were made using 5mM A and 2.5 mM N
along with 10 mM guest (acetylcholine).
After the libraries equilibrate, the receptors were isolated from the mixture through reverse phase HPLC on a C18 column. Purification of receptor was achieved through gradient elution in solvents A and B in buffered conditions (A: 10mM NH4OAc in H2O, B: 10mM NH4OAc in 10% H2O and 90% CH3CN). Isolated receptors were lyophilized to a powder and dissolved in a glycine buffer (pH 9.1) to a concentration of 2000μM and frozen in aliquots of 20μM at -20˚C.
5 Two plate assays were used in this research. The first was used with only one receptor (A2B: 20 μM), a dye (LCG: 7.5 μM) and two peptides (H3 1-12 and H3 1-12 R8cit, varying concentration). First assay was run on a 96 well Corning low volume plate. Material
concentration measured by UV-vis spectroscopy: A2B (315 nm), peptide (274 nm, due to tyrosine residue), LCG (367 nm). Approximate schema seen in Table 2, each data point was done in triplicate to get an average and standard deviation.
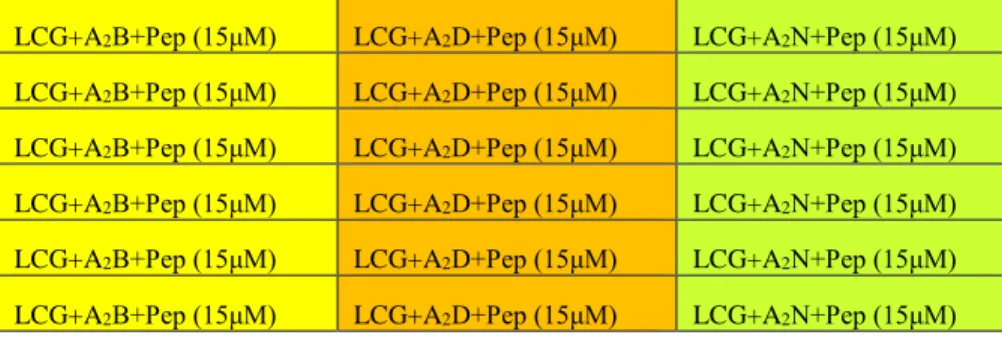
The second plate assay seen in this research utilizes three receptors (A2B: 10 μM, A2D: 5 μM, A2N: 15 μM), a dye (LCG: 1 μM), and the seven peptides listed in Table 1 (15 μM). The assay was run on 364 well Corning low volume plates. Material concentration was measured by UV-vis spectroscopy: A2B (315 nm), A2D (267 nm), A2N (300 nm), peptide (274 nm, due to tyrosine residue), LCG (367 nm). Approximate schema seen in Table 3. Assay fluorescence measured by Fluorescence spectroscopy on a Polarstar Plate Reader. Each peptide was run with 10-15 data points for linear discrimination analysis.
LCG+A2B+Pep (15μM) LCG+A2D+Pep (15μM) LCG+A2N+Pep (15μM) LCG+A2B+Pep (15μM) LCG+A2D+Pep (15μM) LCG+A2N+Pep (15μM) LCG+A2B+Pep (15μM) LCG+A2D+Pep (15μM) LCG+A2N+Pep (15μM) LCG+A2B+Pep (15μM) LCG+A2D+Pep (15μM) LCG+A2N+Pep (15μM) LCG+A2B+Pep (15μM) LCG+A2D+Pep (15μM) LCG+A2N+Pep (15μM) LCG+A2B+Pep (15μM) LCG+A2D+Pep (15μM) LCG+A2N+Pep (15μM) LCG+A2B+Pep (100μM) LCG+A2B+Pep (100μM) LCG+A2B+Pep (100μM) LCG+A2B+Pep (50μM) LCG+A2B+Pep (50μM) LCG+A2B+Pep (50μM) LCG+A2B+Pep (25μM) LCG+A2B+Pep (25μM) LCG+A2B+Pep (25μM) LCG+A2B+Pep (12.5μM) LCG+A2B+Pep (12.5μM) LCG+A2B+Pep (12.5μM) LCG+A2B+Pep (6.25μM) LCG+A2B+Pep (6.25μM) LCG+A2B+Pep (6.25μM) LCG+A2B “Quench” LCG+A2B “Quench” LCG+A2B “Quench”
LCG only LCG only LCG only
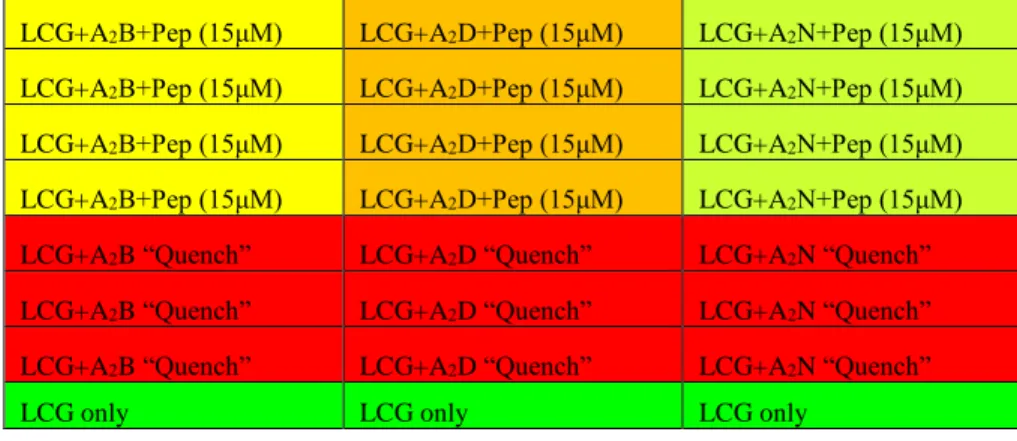
Table 3. Current model of the plate assay used in LDA analysis. Color closer to green indicates higher relative fluorescence. Well volume 15μL. [LCG]=1μM, [A2B]= 10μM, [A2D]=5μM, [A2N]=15μM. Assay run in 50μM glycine buffer (pH 9.1) at 0˚C
Table 2. First Plate assay utilizing only A2B. Color closer to green represents more relative fluorescence. Well volume 45μL. [LCG]=7.5μM, [A2B]=20μM. Assay run in 50μM glycine buffer
6 LCG+A2B+Pep (15μM) LCG+A2D+Pep (15μM) LCG+A2N+Pep (15μM)
LCG+A2B+Pep (15μM) LCG+A2D+Pep (15μM) LCG+A2N+Pep (15μM) LCG+A2B+Pep (15μM) LCG+A2D+Pep (15μM) LCG+A2N+Pep (15μM) LCG+A2B+Pep (15μM) LCG+A2D+Pep (15μM) LCG+A2N+Pep (15μM) LCG+A2B “Quench” LCG+A2D “Quench” LCG+A2N “Quench” LCG+A2B “Quench” LCG+A2D “Quench” LCG+A2N “Quench” LCG+A2B “Quench” LCG+A2D “Quench” LCG+A2N “Quench”
LCG only LCG only LCG only
RESULTS and DISCUSSION
To determine whether the proposed assay would
differentiate between unmodified natural peptides and singly citrullinated peptides, the assay described in Table 2 was
performed with both histone H3 tail 1-12 and H3 tail 1-12 with R8 citrullinated (H3 1-12 R8 cit); the results are graphed in Figure 4. Normalization of fluorescence was determined by using LCG only wells as the upper limit of data and the quench wells as the lower limit. Receptor A2B indeed showed decreased affinity for the
singly citrullinated homolog of the H3 tail. The data collected shows that the loss of charge caused by the conversion from arginine to citrulline decreases the affinity of A2B for the H3 tail. Because I have shown that A2B can selectively classify a histone tail with a single citrullination tail, it is reasonable that A2B, and similar receptors, could differentiate between varied single and poly-citrullination events. Subsequently, more variations of the H3 tail were tested in the same manner described above. In the second trial, H3 12, H312 R8 cit, H3 12 R2 cit, and H3 1-12 R2,8 cit were all tested; the results are shown in Figure 5.
0.00 0.20 0.40 0.60 0.80 1.00
0 50 100 150
N
o
rm
al
ize
d
Fl
u
o
re
sce
n
ce
Concentration of Peptide (µM)
H3 1-12 H3 1-12 8R Cit
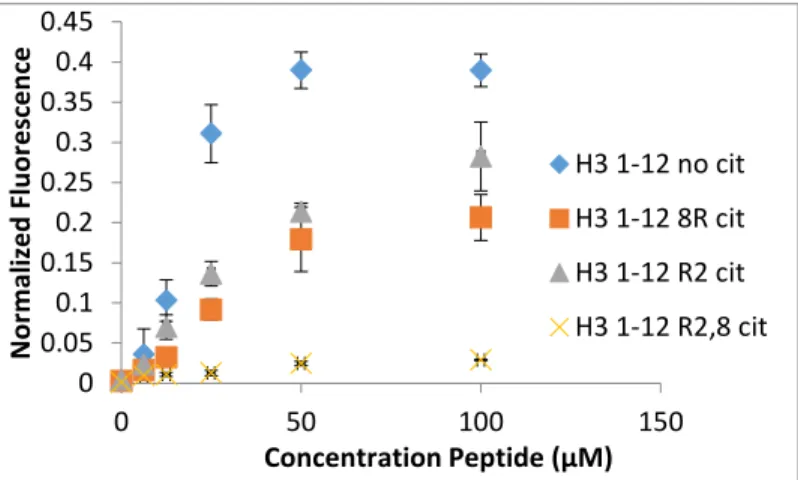
7 As seen in figure 5, H3 1-12 R2 cit and H3 1-12 R8 cit are within error. Subsequent runs of the same assay showed that there was indeed no clear distinction in the signals received from either of the singly-citrullinated
peptides. Chemically, this makes sense, as R2,8cit peptide has a charge of +2, while unmodified H3 tail has a charge of +4, making them easy to
differentiate; R2cit and R8cit each have a charge of +3, making classification much more difficult. It is clear that the system must be more refined in order to differentiate similar modifications on these H3 tail derivatives. To add depth to the system, two more
receptors (A2D and A2N) were added and LDA was used to analyze the data. Using the assay schema proposed previously, all of the citrullinated H3 derivatives from Table 1 were tested and plotted in Figure 6. As can be seen with the LDA plot, data points were identified with 100% precision. LDA allows for the separation of data into distinct classes and visually depicts the boundaries of each class using parameters measured and data labels inputted into the system. Classification in Figure 6 represents the percent identification by the LDA program with the data labels included. Jackknifed Classification represents the percent correct classification when each data point is taken out individually and stripped of its data labels before being re-entered into the classification matrix. It is clear from Figure 6 that using the assay schema from Table 3 and LDA for statistical data analysis, the pattern of fluorescence received from the citrullinated peptides can be differentiated.
0 0.05 0.1 0.15 0.2 0.25 0.3 0.35 0.4 0.45
0 50 100 150
N
o
rm
al
ize
d
Fl
u
o
re
sce
n
ce
Concentration Peptide (µM)
H3 1-12 no cit H3 1-12 8R cit H3 1-12 R2 cit H3 1-12 R2,8 cit
8 Figure 6. LDA plot of the Indicator Displacement Assay data from arginine-citrullinated H3 tail derivatives. Data points of the same color reflect each of the three different H3 tail derivatives. Classification signifies that the SYSTAT13 program could identify each peptide when labeled with an identifier. Jackknifed Classification signifies identification when data points are taken out and data labels are removed. Fluorescent dye (LCG)=1 µM, A2B= 10 µM, A2D= 5 µM, A2N= 15 µM, Peptides= 15 µM.
Acetylation of lysine residues is similar to citrullination in that it results in the loss of a positive charge. Because of this, acetylated H3 derivatives were a logical expansion of this assay. Similar to the citrullinated residues, two singly-acetylated peptides (K4 and K9 Ac respectively) and one doubly acetylated peptide (K4,9) were synthesized and run on the assay described in above. The results (Figure 7) show that classification of singly-acetylated histone tail derivatives with different acetylation loci is possible, and that it the assay can distinguish doubly-acetylated H3 derivatives from singly-acetylated peptides. However, the question still remained whether the assay combined with LDA analysis would be able to classify both acetylation and citrullination events. Sites of particular interest were R8 vs K9 and R2 vs K4 since they are located relatively close to each other and may interact very similarly with the receptors should either site lose the positive charge associated with its side chain by undergoing one of the PTMs being studied. Upon analysis (Figure 8), the total combine of all peptide species synthesized in Table 1 showed
H3 Arginine Citrullination
H3 1-12 R8Cit
H3 1-12 R2;R8 Cit
H3 1-12 R2Cit
-12.0 -4.5 3.0 10.5
F1 (95.1%)
-8.0 -5.7 -3.4 -1.1 1.1 3.4 5.7 8.0
F
2
(
4
.9
%
)
9 once again 100% correct classification ofeach peptide species. The significance of Figure 8 is that it shows that the given assay schema in Table 3 is able to distinguish similar PTMs in very similar locations, as the difference in affinity of the receptors used for lysine vs arginine can be detected and visualized through statistical analysis.
Figure 7. LDA plot of the Indicator Displacement Assay data from lysine-acetylated H3 tail derivatives. Data points of the same color reflect each of the three different H3 tail derivatives. Classification signifies that the SYSTAT13 program could identify each peptide when labeled with an identifier. Jackknifed Classification signifies identification when data points are taken out and data labels are removed. Fluorescent dye (LCG)=1 µM, A2B= 10 µM, A2D= 5 µM, A2N= 15 µM, Peptides= 15 µM.
H3 1-12 Lysine Acetylation
H3 1-12 K9Ac
H3 1-12 K4;K9 Ac
H3 1-12 K4Ac
-9.0 -1.7 5.7 13.0
F1 (95.2%)
-9.00 -6.25 -3.50 -0.75 2.00 4.75 7.50 10.25 13.00
F
2
(
4
.8
%
)
10 Figure 8. A: Total combine LDA plot of the Indicator Displacement Assay data. Data points of the same color reflect each of the three different H3 tail derivatives. Classification signifies that the SYSTAT13 program could identify each peptide when labeled with an identifier. Jackknifed Classification signifies identification when data points are taken out and data labels are removed. Fluorescent dye (LCG)=1 µM, A2B= 10 µM, A2D= 5 µM, A2N= 15 µM, Peptides= 15 µM. B: seemingly poor differentiation alleviated by creating the true 3-dimensional form of the same LDA plot, using the 3rd classification factor from SYSTAT13.
Citrullination and Acetylation
H3 1-12 R8 Cit H3 1-12 R2,8 Cit H3 1-12 R2 Cit H3 1-12 K9 Ac H3 1-12 K4,9 Ac H3 1-12 K4 Ac
-20 -10 0 10 20
Factor 1 (76.9%) -10
-5 0 5 10
F
a
c
to
r
2
(
2
0
%
)
Citrullination and Acetylation
H3 1-12 R8 Cit H3 1-12 R2,8 Cit H3 1-12 R2 Cit H3 1-12 K9 Ac H3 1-12 K4,9 Ac H3 1-12 K4 Ac
-20 -10
0 10
20
Facto r 1
(7 6.9%
)
-10 -5 0 5 10
Facto
r 2 (20%)
-2 -1 0 1 2 3 4 5
Facto r 3 (3 .1%
)
Classification: 100%
Jackknifed Classification:
100%
(A)
11 After determining the specificity of this indicator displacement assay with the addition of a sensor array and LDA, the next logical step would be to determine the sensitivity of the system. Given that the affinity of the receptors for LCG is higher than that of peptides (~3-11 µM vs ~30 µM14,15), the hypothesis would be that a peptide concentration much lower than 10 µM would not significantly displace LCG at 1 µM. An example of this can be seen in Figure 4, where smaller concentrations are harder to differentiate.
Figure 9. Citrullination detection limit LDA plot of the Indicator Displacement Assay data. Data points of the same color reflect each of the three different H3 tail derivatives. Classification signifies that the SYSTAT13 program could identify each peptide when labeled with an identifier. Jackknifed Classification signifies identification when data points are taken out and data labels are removed. Fluorescent dye (LCG)=1 µM, A2B= 10 µM, A2D= 5 µM, A2N= 15 µM, Peptides (A)= 10 µM, (B)= 5 µM.
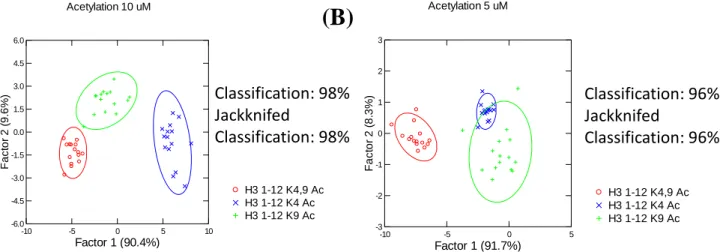
Figure 10. Acetylation detection limit LDA plot of the Indicator Displacement Assay data. Data points of the same color reflect each of the three different H3 tail derivatives. Classification signifies that the SYSTAT13 program could identify each peptide when labeled with an identifier. Jackknifed Classification signifies identification when data points are taken out and data labels are removed. Fluorescent dye (LCG)=1 µM, A2B= 10 µM, A2D= 5 µM, A2N= 15 µM, Peptides (A)= 10 µM, (B)= 5 µM.
Citrullination 10 uM
H3 1-12 R8 Cit H3 1-12 R2,8 Cit H3 1-12 R2 Cit
-20 -10 0 10 20
Factor 1 (99.2%) -10 -7 -4 -1 1 4 7 10 F a c to r 2 ( 0 .8 %
) Classification: 100%
Jackknifed Classification: 100% Classification: 96% Jackknifed Classification: 96% Classification: 84% Jackknifed Classification: 78% Classification: 98% Jackknifed Classification: 98%
Citrullination 5 uM
H3 1-12 R8 Cit H3 1-12 R2,8 Cit H3 1-12 R2 Cit
-8 -2 4 10
Factor 1 (99.8%) -10 -6 -2 2 6 10 F a c to r 2 ( 0 .2 % )
Acetylation 5 uM
H3 1-12 K9 Ac H3 1-12 K4 Ac H3 1-12 K4,9 Ac
-10 -5 0 5
Factor 1 (91.7%) -3 -2 -1 0 1 2 3 F a c to r 2 ( 8 .3 % )
Acetylation 10 uM
H3 1-12 K9 Ac H3 1-12 K4 Ac H3 1-12 K4,9 Ac
-10 -5 0 5 10
12 Figure 9 demonstrates that indeed the proposed assay schema loses selectivity for
citrullinated H3 derivatives at peptide concentration lower that 10 µM. However, Figure 10 shows that acetylation on H3 tails can be correctly classified even to 5 µM, a much lower concentration that predicted. A possible explanation would be that unmodified arginine residues have important binding effects with respect to the receptors used in the assay14. Arginine’s shared positive charge by the nitrogen atoms on its side chain can interact favorably with the carboxylic acids on monomer A. Additionally, arginine’s guanidinium group is planar and can stack with the aromatic rings on monomer A16.
CONCLUSION
An indicator displacement assay using a sensory array of 3 organic receptor macrocycles (A2B, A2D and A2N) and a lucigenin dye is successfully able to differentiate and classify histone H3 tail derivatives with a variety of loss-of-charge PTMs with the help of linear discrimination analysis. The tested assay is selective enough to distinguish between otherwise identical peptides with a single citrullination or acetylation in different locations, between peptides with one or two acetylation or citrullination events, and between two peptides with similar PTMs (acetylation vs citrullination) in locations as close as the adjacent amino acid. The proposed assay is sensitive enough to be able to correctly classify modified H3 derivatives at concentrations as low as 10 µM for citrullinated H3 tails and 5 µM for acetylated H3 tails. The proposed schema will not work in high-throughput screening as-is, but shows promise if developed and eventually should be able to distinguish between many PTM marks with high selectivity at a larger throughput, which would make it a valuable addition to researchers attempting to study the histone code. In the future, the assay will be tested by mimicking PTM addition enzyme activity to move the system forward to being able to function in real-time enzymatic assays.
REFERENCES:
1. Bannister, Andrew J. Nature. 2005,436, 1103-1106.
2. Martínez, P. and Iborra, A. 2006. Antibody Synthesis in Vitro. eLS. 3. Rothbart, S., Strahl, B.; Nature Scientific Reports, 2012, 2: 489
4. Guimarães-Costa, A. B. et. al., Journal of Parasitology Research, 2011, 2012. 5. Mastronardi, F. G. The Journal of Neuroscience. 2006.26, 11387-11396. 6. Thompson, P. R. J. Am. Chem. Soc.2006. 126, 1092-1093.
7. Grunstein, M. Nature. 1997.6649, 349-352.
8. Britton L. P., et. al. Expert Rev. Proteomics. 2011. 8, 631-643.
13 12. Corbett, P. T.; Sanders, J. K. M.; Otto, S. Chem. Eur. J. 2008, 14, 2153-2166.
13. Staab, H. A.; Kirrstetter, R. G. H. Liebigs Ann. Chem. 1979, 886.
14. Pinkin, N. K. and Waters M. L. Org. Biomol. Chem., 2014,12, 7059-7067