Sharif University of Technology
Scientia IranicaTransactions A: Civil Engineering http://scientiairanica.sharif.edu
Adapted design of experiments for dimension
decomposition-based meta-model in structural
reliability analysis
M. Rakhshani Mehr
a;, H. Mirkamali
b, M. Rashki
c, and A. Bahrpeyma
c a. Department of Civil Engineering, Alzahra University, Tehran, P.O. Box 1993893973, Iran.b. Department of Civil Engineering, Shiraz University of Technology, Shiraz, Iran. c. Department of Civil Engineering, University of Sistan and Baluchestan, Zahedan, Iran. Received 10 May 2016; received in revised form 7 October 2017; accepted 5 March 2018
KEYWORDS Structural reliability; Simulation methods; Univariate dimension reduction;
Design of experiment; Monte Carlo
simulation.
Abstract. Reliability analysis of structures is often problematic for the structures with nonlinear and complex Limit State Functions (LSFs). For these cases, simulation methods often provide accurate failure probability, but with a high number of LSFs in the analysis of the structure. This paper presents an ecient combined meta-model of Monte Carlo Simulation (MCS) and Univariate Dimension Reduction (UDR) to approximate the failure probability of structures with evaluation of few LSFs. For this purpose, the design of the experiment applied in the meta-model was adapted such that the expected failure samples in MCS were approximated with higher accuracy. Several numerical and engineering reliability problems were solved by the proposed approach and the results were veried by MCS. Results showed that the proposed approach highly reduced the required number of structural analyses to provide proper results.
© 2019 Sharif University of Technology. All rights reserved.
1. Introduction
In structural reliability analysis, the failure probability Pf is dened as [1]:
Pf =
Z
G(X)fx(X) dX; (1)
where fX(X) is the joint probability density
func-tion of the vector of basic random variables X = [x1; x2; :::; xn]T, which represents uncertain quantities
such as material properties, loads, boundary condi-tions, and geometry. In Eq. (1), G(X) is the Limit
*. Corresponding author.
E-mail addresses: [email protected] (M. Rakhshani Mehr); [email protected] (H. Mirkamali); [email protected] (M. Rashki) doi: 10.24200/sci.2018.20221
State Function (LSF) in which G(X) > 0 represents the safety domain and G(X) < 0 represents the failure domain. However, the failure probability of a given problem by means of Eq. (1) is not a straight approach, because the joint probability density function FX(X)
is not always available. In some cases, Eq. (1) cannot be integrated analytically, even if FX(X) is available,
especially for the complex structures with low failure probabilities and implicit LSFs. Therefore, in order to avoid such calculation, various techniques have been proposed, e.g., a) approximation methods (i.e., First Order Reliability Method (FORM) and Second Order Reliability Method (SORM)) and b) simulation methods [2-5]. FORM and SORM are accurate for reliability problems with linear and moderate LSFs, but inaccurate for highly nonlinear LSFs and dicult to solve when the actual implicit LSF cannot be expressed explicitly. Besides, in some cases, FORM and SORM may suer convergence problems [6]. Hence,
when an accurate reliability evaluation is required, simulation methods are often employed.
1.1. Monte Carlo simulation
Monte Carlo Simulation (MCS) is considered as the most ecient and accurate simulation method and is commonly used for the evaluation of the probability of failure for structures, either for comparison with other methods or as a standalone reliability analysis tool [7,8]. This method involves sampling the design space based on the mean, variance, and PDF values of random variables. From a mathematical point of view, MCS allows to estimate the expected value of a quantity of interest more specically. Suppose the goal is to evaluate Ef[h(X)]; an expectation of the function
h : x ! R with respect to the Probability Density Function (PDF) [9] is:
Z
Xh(X)fx(X)dx = Ef[h(X)] : (2)
The idea behind MCS is straight forward application of the law of large numbers, which states if X = [x1;x2;:::; xn] is independent from and distributed
iden-tically to the PDF fx(X), then the empirical average 1
N N
P
i=1h(xi) converges to the true value of Ef[h(X)]
when N approaches +1. Therefore, if the number of samples N is large enough, then Ef[h(X)] and it can
be accurately estimated by the corresponding empirical average:
Ef[h(X)] N1 N
X
i=1
h(xi): (3)
The relevance of DMC to the reliability problem (1) follows a simple observation that the failure probability Pf can be written as:
Pf=
Z
G(X)fx(X) dX =
Z
XIf(X)fx(X)dX
= Ef[If(X)] = N1 N
X
i=1
h(xi); (4)
where X = [x1;x2;:::; xn] is independent from and
distributed identically to the PDF fx(X), and If is
a counting vector with values of zero and unity for samples in the failure and safe regions, respectively. As it is seen, a vast number of simulations have to be performed in order to achieve great accuracy, especially for low values of failure probability. In the eorts to reduce the excessive computation cost of MCS using purely random sampling methodologies, which are considered as the drawback of the method, various variance reduction techniques have been proposed, e.g., importance sampling [10-12], direct sampling [13], line sampling [14,15], Weighted Average Simulation
Method (WASM) [16], subset simulation [17], polyno-mial chaos [18], and stochastic perturbation technique [19]. Unfortunately, most of these techniques are not as generally applicable as MCS. For example, impor-tance sampling requires detailed information about the failure regions for being useful, and it faces diculties when applied to high-dimension problems [16,20]. 1.2. First order reliability method
First Order Reliability Method (FORM) is widely used to approximate the failure probability of structures and has become a basic reliability analysis approach for reliability-based design codes [21,22]. In FORM, structural failure probability is estimated based on the reliability index () by linearizing limit state function on the failure surface, i.e., Pf ( ), which
corresponds to minimum distance of the origin from the limit state function in the standard normal area [21,23]. Generally, the main goal of FORM is the search for the most probable point (MPP), i.e., U(b = jjUjj) [24,25].
Hasofer Lind proposed a general iterative method for computing reliability index [23], which was extended by Rackwitz and Flessler to include distribution in-formation of random variables [26], called the HL-RF method. This method involves the following steps to estimate the probability of failure [26] based on the HL-RF method:
Step 1. Transform random variables in X-space into U-space by the following relation:
u = x ex
e
x ; (5)
where u is the standard normal variable with the mean and standard deviations equal to zero and one, respectively, and e
x and xe are equivalent mean
and standard deviations of the random variable x, respectively; for normal random variable, e
x = x
and e
x = x. The equivalent mean and standard
deviations of non-normal random variables can be determined by the following equations [26-28]:
e x= f 1
x(x)
1fF
x(x)g; (6)
e
x= x ex 1[Fx(x)] ; (7)
where Fx(x) is cumulative distribution, fx(x) is
prob-ability distribution, 1 is inverse standard normal
cumulative distribution, and is standard normal probability distribution function.
Step 2. Find the reliability index.
The reliability index search is done based on an iterative process that can be reformulated based on design point (U) as:
Uk+1= k+1k+1; (8)
k+1= r Tg(U
k)
krTg(Uk)k; (9)
k+1= g(Uk) r Tg(U
k)Uk
krTg(Uk)k ; (10)
where rg(U) = [@g/@u1;@g/@u2;:::; @g/@un]T is
gra-dient vector of the limit state function at the design point Uk.
Step 3. Calculate the failure probability.
The probability of failure based on FORM can be estimated as Pf ( ) [21,29].
2. Meta-models in structural reliability
When performance evaluation of a structure is compu-tationally expensive, the number of simulation-based function evaluations required for reliability analysis must be carefully controlled. To that end, researchers have explored the use of meta-models, which are simpler approximate models calibrated to sample runs of the original simulation. The approximate model or meta-model can replace the original one, thus reduc-ing the computational burden of evaluatreduc-ing numerous problem [30-35]. Bucher and Bourgund [36] proposed a quadratic polynomial response surface without cross terms. In their model, the response surface represented the LSF along the coordinate axes of the space of standard normal random variables. Nguyen et al. [37] proposed an adaptive RSM based on a double weighted regression technique. For the rst iteration, a linear response surface was chosen; for the following itera-tions, a quadratic response surface with cross terms was considered based on the complementary points. Kang et al. [38] proposed an ecient RSM applying a moving least squares approximation instead of the traditional least squares approximation. Allaix and Carbone [39] discussed the locations of the experimental points used for evaluating parameters of the response surface. Recently, Dimension Reduction Method (DRM) as an ecient approach has been used to reduce the computational costs of the analysis [40-43].
In order to use the capabilities of MCS and simul-taneously reduce the computational eorts, this paper presents a framework that eciently employs the DRM to evaluate the reliability of structures. The proposed framework is presented after a brief review of DRM.
3. Dimension reduction method
DRM is a newly developed technique to calculate statistical moments of the output performance func-tion [40-43]. There are several DRMs depending on the level of dimension reduction: (1) Univariate Dimension Reduction Method (UDRM), which is an additive decomposition of N-dimensional performance
function into one-dimensional functions; (2) Bivariate Dimension Reduction (BDR), which is an additive decomposition of N-dimensional performance function into at most two-dimensional functions; (3) Multivari-ate Dimension Reduction (MDR), which is an additive decomposition of N-dimensional performance function into at most S-dimensional functions, where S N.
According to UDRM, any N-dimensional perfor-mance function h(X) can be additively decomposed into one-dimensional functions as [44]:
h (X)=^h (X)
N
X
i=1
h (1; : : : ; i 1; xi; i+1; : : : ; N)
(N 1) h (1; : : : ; N) ; (11)
where i is the mean value of a random variable Xi
and N is the number of design variables.
4. Proposed framework
This study employs the eciency of the UDR-based meta-modeling in conjunction with the accuracy of MCS to provide a suitable framework for structural reliability analysis. The idea is to concentrate the ex-periments of the UDR-based meta-model on the region with high failure probability to correctly approximate the performance function value for the samples that are expected to be in the failure set. The following steps could be conducted to provide the desirable results. 4.1. Axial Design Of Experiments (DOE)
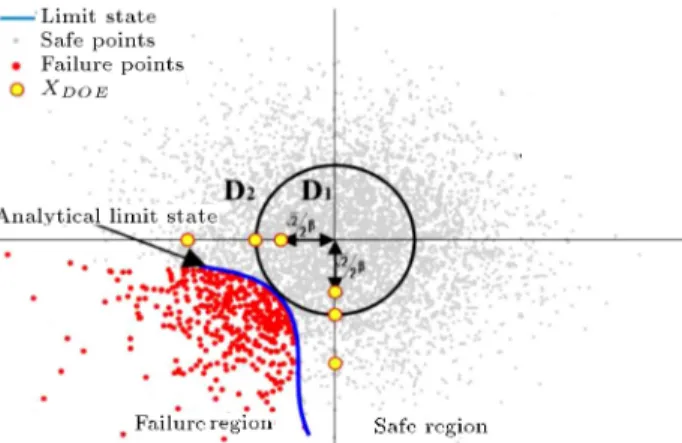
based on the desired reliability index UDR-based meta-model requires axial DOE to ap-proximate the LSF. Determination of the location of experience samples in the proposed approach is based on the perception created by conducting the MCS sampling and excluding the safe area part. In this approach, as shown in Figure 1, which is presented in standard normal space (U), the space is divided into two separate regions D1and D2and it is assumed that
D1is selected such that no failure occurs in this region.
Here, D1 is chosen as the region inside a sphere with
radius [45].
To reduce the computational cost, the location of DOEs could be considered such that the corpus of experience samples in each axis is condensed within the boundaries of D1 and D2 regions and regions with the
highest possibilities of failure. These samples should be used with the aim of interpolating DRM for the separated term in each dimension. By employing an anticipated reliability index and mapping the proposed experience samples in the physical space (original design space), the location of experiences for each variable is as follows:
XDOE =
p 2
2 :target::; (12) where and are the mean value and standard deviation of random variable, respectively, and is the location coecient.
4.2. Generation of random sample based on crude MCS
After conducting the proposed step in the design of the experiment, in the next step, crude MCS should be per-formed to generate random samples for approximating the failure probability. Figure 2 schematically shows the proposed DOEs and the generated samples for a two-dimensional problem. According to the proposed approach, the approximated performance function cor-responding to each sample is achievable by employing the UDR-based meta-model.
4.3. LSF approximation by the UDRM-based meta-model and reliability evaluation Eq. (11) is employed at this step to approximate the LSF. The following is the resulting function for a limit state function with two random variables X1and X2:
h (X)=^h (X)h (x1; 2)+h (1; x2) h (1; 2) ; (13)
in which for the samples produced by MCS, through employing the experiments and a proper interpolation
Figure 2. DOE and the generated samples based on MCS.
Table 1. The employed interpolation techniques. Sign Interpolation method
#1 Spline #2 PCHIP #3 Kriging #4 Linear #5 Cubic #6 V5cubic
technique, the values of h(x1; 2) and h(1; x2) for
each dimension are achievable thorough interpolation. Then, the value of performance function for each sample could be approximated using Eq. (13). Then, the failure probability could be approximate by Eq. (4). In this study, the eectiveness of various inter-polation techniques is also investigated to suggest a proper technique for use in the proposed framework. It consists in several one-dimensional interpolations implemented by MATLAB toolbox, which are pre-sented in Table 1. The kriging method (method #3) as a newly developed approximation method is also used in the approach and compared with common interpolation techniques.
5. Kriging method
Kriging meta-model is an interpolation technique based on statistical theory, which consists in a parametric linear regression model and a non-parametric stochas-tic process. It needs a design of experiments to dene the stochastic parameters and then, predictions of the response can be completed on any unknown point. An initial DOE X = [x1; x2; :::; xN0] is given with
xi 2 Rn(i = 1; 2; :::; N0) as the ith experiment and
G = [G(x1); G(x2); :::; G(xN0);] with G(xi) 2 R as the
corresponding response to X [46]. The approximate relationships between any experiment X and the re-sponse G(x) can be denoted as:
b
G(x) = F (; x) + z(x) = fT(x) + z(x); (14)
where T = [
1; :::; p] is a regression coecient
vector. Built by response surface method similar to the polynomial, fT(x) = [f
1(x); f2(x); :::; fp(x)]T makes a
global simulation in the design space. In the ordinary kriging, F (; x) is a scalar always taken as F (; x) = . Hence, the estimated bG(x) can be simplied as:
b
G(x) = F (; x) + z(x) = + z(x): (15) Here, z(x) is a stationary Gaussian process [46]. The statistic characteristics can be denoted as:
E(z(x)) = 0; (16) V ar(z(x)) = 2
Cov [Z(xi); Z(xj)] = z2R(xi; xj); (18)
where 2
z is the process variance; xi; and xj are
discretional points from the whole samples X; and R(xi; xj) is the correlation function about xi and xj
with a correlation parameter vector [46].
6. Numerical and engineering examples
Five numerical and engineering problems are investi-gated in this section. For each example, the results obtained by using the proposed approach are compared with those by FORM and the accurate solution pro-vided by using the MCS.
6.1. Example 1
This example is presented to investigate the eect of the dierent interpolation and prediction methods on the function approximation in the proposed approach. The performance function is presented as f (x1; x2) =
x3
1+ x32 18 and the distribution of random variables
are x1= N(10; 5); and x2= N(9:9; 5) [47].
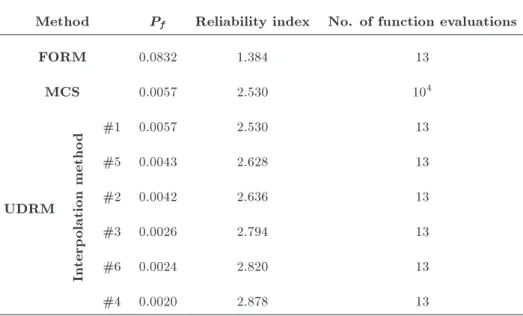
The example is solved by three approaches and the results are presented in Table 2. The six employed interpolation methods are also shown in this table based on their ranks to provide an accurate solution. According to Table 2 and as shown in Figure 3, among various interpolation methods used in the proposed ap-proach, method #1 presents a suitable approximation in such a manner that by 13 times function evaluation, the provided results are in good agreement with MCS with 104 function evaluations. Result shows that
the FORM requires few LSF evaluations to provide solution, but the obtained solution is highly dierent from the accurate result provided by the MCS and the proposed approach.
6.2. Example 2
A nonlinear limit state with two independent standard normal variables is considered [48].
g (X)= 0:16(X1 1)3 X2+4 0:04cos(X1:X2) : (19)
In this example, the accuracy of the method for a non-linear limit state function is investigated. The results are presented in Table 3. According to Table 3 and as shown in Figure 4, the proposed method provides acceptable results when four techniques are used to interpolate the results in Step 2. Results presented in the table show that the proposed method has provided accurate solution to the problem, although the number of its function evaluations is even less than that required by FORM. It should be noted that due to the nonlinearity of the LSF, the reliability index determined by FORM is higher than the correct reliability index.
6.3. Example 3
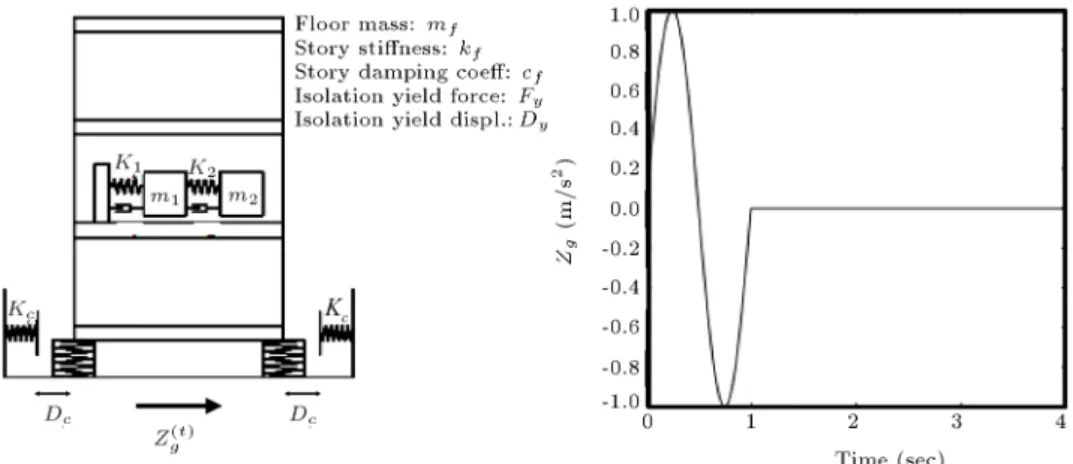
An implicit reliability problem with highly nonlinear performance function is investigated in this example. Figure 5 shows the problem of a four-story building excited by a single-period sinusoidal impulse of ground acceleration. The building contains isolated equipment on the second oor. The motion of the lowest oor is resisted by a nonlinear hysteresis force in base isolation bearings of the building and an additional stiness force, if its displacement exceeds dc. Each oor has
a mass of mf and between oors, the stiness and
damping coecients are kf and cf, respectively. The
statistical parameters of the basic random variables are listed in Table 4. All variables are assumed to be lognormal and independent. The limit state function is dened by [48]:
Table 2. Reliability results for Example 1.
Method Pf Reliability index No. of function evaluations
FORM 0.0832 1.384 13
MCS 0.0057 2.530 104
UDRM
In
terp
olation
metho
d #1 0.0057 2.530 13
#5 0.0043 2.628 13
#2 0.0042 2.636 13
#3 0.0026 2.794 13
#6 0.0024 2.820 13
Figure 3. Failure region in the MCS and the proposed approach by using: (a) Spline, (b) PCHIP, and (c) kriging interpolation for Example 1.
g (X) = 12:5(0:04 max jrfi(t) rfi 1(t)j)i=2;3;4
+ (0:5 max jzg(t) rm2(t)j)
+ 2 (0:25 max jrf2(t) rm1(t)j) ; (20)
where rfirefers to the displacement of the ith oor and
rfi(t) rfi 1(t) is the inter-story displacement of two
consecutive oors. The accelerations zg and rm2 are
of the ground and the smaller mass block, respectively. The displacement rm1 is of the larger mass block and
represents the displacement of the equipment isolation
Figure 4. Failure region in the MCS and the proposed approach by using: (a) Spline, (b) PCHIP, and (c) kriging interpolation for Example 2.
system. The limit state function in Eq. (20) is the sum of three expressions of failure modes. The rst term describes damage to the structural system due to excessive deformation. The second term represents damage to equipment, which is caused by excessive acceleration.
The last term represents the damage to the isola-tion system. They are multiplied by weighing factors, which emphasize the three failure modes equally. As Eq. (20) states, it is desirable that:
1. None of the inter-story displacements exceed 0.04 m;
Figure 5. Base-isolated structure with an equipment isolation system on the 2nd oor, including the eects of isolation displacement limits [47].
Table 3. Reliability results for Example 2.
Method P f Reliability index No. of function evaluations
FORM 7:4883:105 3.791 17
MCS 1:1900:104 3.675 106
UDRM
In
terp
olation
Metho
d #1 1:1900:104 3.675 13
#3 1:1400:104 3.686 13
#2 1:0800:104 3.700 13
#5 1:3400:104 3.644 13
#4 6:2000:105 3.838 13
#6 4:3000:105 3.927 13
Table 4. Statistical properties of random variables for Example 3.
Variable Description Units Mean value COV
mf Floor mass Kg 6000 0.1
kf Floor stiness N/m 30000000 0.1
cf Floor damping coecient N/m/s 60000 0.2
dy Isolation yield displacement m 0.05 0.2
fy Isolation yield force N 20000 0.2
dc Isolation contact displacement m 0.5 0
kc Isolation contact stiness N/m 30000000 0.3
m1 Mass of block 1 Kg 500 0
m2 Mass of block 2 Kg 100 0
k1 Stiness of spring 1 N/m 2500 0
k2 Stiness of spring 2 N/m 100000 0
c1 Damping coecient of damper 1 N/m/s 350 0 c2 Damping coecient of damper 2 N/m/s 200 0
T Pulse excitation period s 1.0 0.2
2. The peak acceleration of the smaller mass block (the equipment) be less than 0.5 m/s2;
3. The displacement across the equipment isolation system be less than 0.25 m.
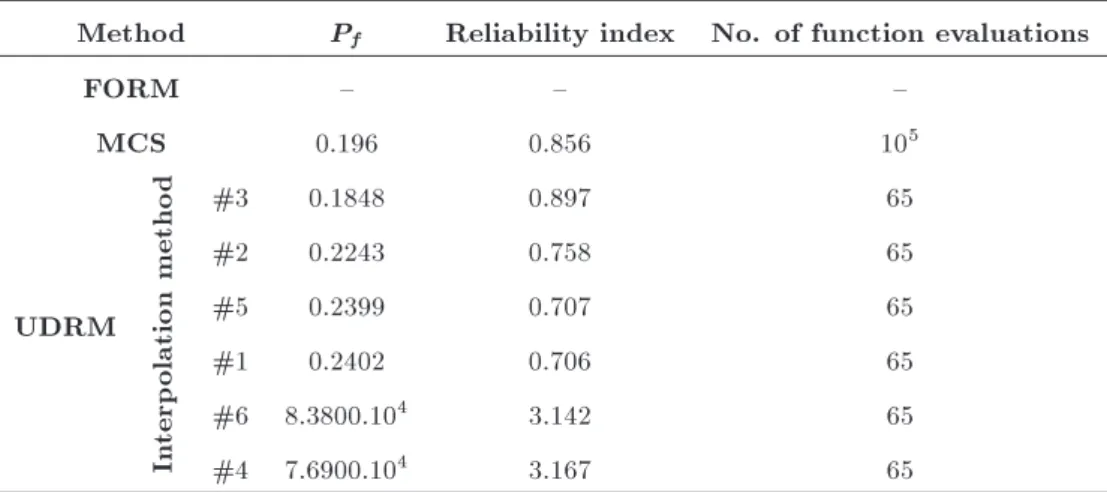
Failing to meet one or two of the conditions does not necessarily lead to a failure in the limit state function, e.g., g(X < 0), but will decrease the value of the limit state function. In these simulations, the system fails mainly because of the large acceleration of the smaller mass. The estimation of Pf with direct
full-scale MCS of 105sample size is 0.196 [48].
The problem has been solved by the three meth-ods and the results are presented in Table 5. Results show the fail of FORM to converge to a proper solution. The reason is the high nonlinearity of performance function and the dimension size of the problem. How-ever, it is noteworthy that by employing the proposed method, an approximation of failure probability is achievable by 65 times function evaluation with the
results in agreement with MCS with 105 function
evaluations. Result shows that the proposed approach provides accurate solution when the kriging (interpola-tion #3) method is employed.
6.4. Example 4
Consider a roof structure subjected to a uniformly distributed vertical load q, as shown in Figure 6. The example is adapted from [49]. The top cords and the compression bars are concrete, and the bottom cords and the tension bars are steel. In structural analysis, the uniformly distributed load q is transformed into three nodal loads with each being P = ql/4. The serviceability limit state of the structure with respect to its maximum vertical displacement is considered. The limit state function is given by:
g = ua ql 2
2
3:81 AcEc +
1:13 AsEs
; (21)
where ua is the allowable displacement and set to
Figure 6. A roof structure (redrawn from [48]). Table 5. Reliability results for Example 3.
Method Pf Reliability index No. of function evaluations
FORM { { {
MCS 0.196 0.856 105
UDRM
In
terp
olation
metho
d #3 0.1848 0.897 65
#2 0.2243 0.758 65
#5 0.2399 0.707 65
#1 0.2402 0.706 65
#6 8:3800:104 3.142 65
Table 6. Random variables for Example 4.
Variable Mean COV
q (N/m) 20,000 0.07
l (m) 12 0.01
As(m2) 9:82 10 4 0.06 Ac(m2) 400 10 4 0.12 Es (N/m2) 1 1011 0.06 Ec (N/m2) 2 1010 0.06
0.03 m, E and A denote the modulus of elasticity and cross-sectional area, respectively, and the subscripts s and c indicate the steel and concrete material, respec-tively. Table 6 summarizes the statistical information of the random variables. All random variables are assumed to be independent normal. The probability of failure is found to be 9:37 10 3after direct 5 107
Monte Carlo simulations.
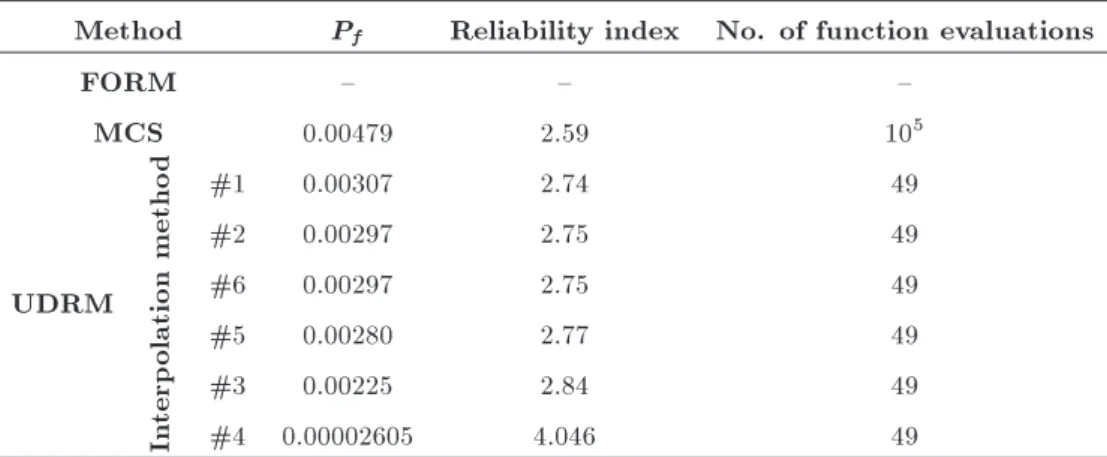
Table 7 presents the results of the MCS, FORM, and proposed method. The results of the proposed method agree reasonably well with the Monte Carlo results. The relative error is 5% after 49 times function evaluation.
6.5. Example 5
In automobile engineering, the front axle beam is used to carry the weight of the front part of the vehicle (Figure 7) [50]. As the entire front part of the automobile rests on the front axle beam, it must be robust enough in construction to ensure its reliability. An I-beam is often used in the design of front axle due to its high bend strength and light weight. In this example, as shown in Figure 7, a dangerous cross section happens in the I-beam part. The maximum normal stress and shear stress are = M/Wx and
= T/Wp, respectively, in which M and T are bending
moment and torque, respectively, and Wxand WP are
section factor and polar section factor, respectively, given as:
Figure 7. Schematic diagram of automobile front axle [48].
Table 8. Random variables for Example 5.
Variable Mean COV
a (mm) 12 0.06
b (mm) 65 0.325
t (mm) 14 0.07
h (mm) 85 0.425
M (N.mm) 3:5 106 1:75 105 T (N.mm) 3:1 106 1:55 105
Wx= a(h 2t) 3
6h + b 6h
h
h3 (h 2t)3i; (22)
Wp= 0:8bt2+ 0:4a3(h 2t)t: (23)
To test the static strength of the front axle, the limit-state function can be expressed as:
g = s
p
2+ 32; (24)
where s is limit-state stress of yielding. Considering
the characteristic of material in the front axle, the limit stress of yielding s is 460 MPa. The geometry
variables of I-beam, namely a, b, t, h, the local M; and T , are independent normal; they are listed with their distribution parameters in Table 8.
Table 7. Reliability results for Example 4.
Method Pf Reliability index No. of function evaluations
FORM { { {
MCS 0.00479 2.59 105
UDRM
In
terp
olation
metho
d #1 0.00307 2.74 49
#2 0.00297 2.75 49
#6 0.00297 2.75 49
#5 0.00280 2.77 49
#3 0.00225 2.84 49
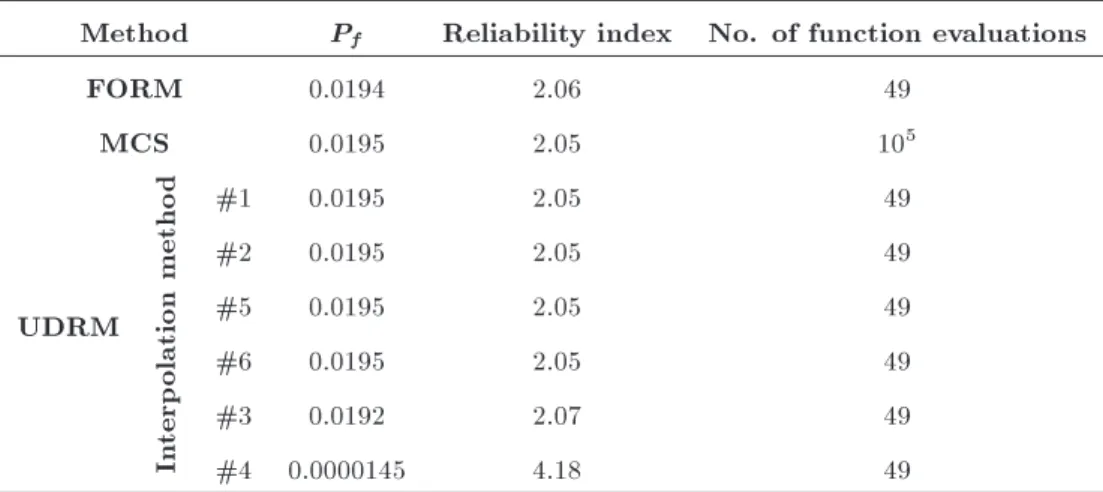
Table 9. Reliability results for Example 5.
Method Pf Reliability index No. of function evaluations
FORM 0.0194 2.06 49
MCS 0.0195 2.05 105
UDRM
In
terp
olation
metho
d #1 0.0195 2.05 49
#2 0.0195 2.05 49
#5 0.0195 2.05 49
#6 0.0195 2.05 49
#3 0.0192 2.07 49
#4 0.0000145 4.18 49
Table 9 presents the estimated values of failure probability with dierent methods. The number of samples used for each method is also listed in Ta-ble 9. The taTa-ble shows that the proposed method can achieved good results with the lowest number of samples. According to Table 9, among various interpolation methods used in the proposed approach, the methods #1, #2, #5, and #6 present suitable approximations in such a manner that by 49 times function evaluation, they provide acceptable results in comparison with MCS with 105 function evaluations.
Eciently solving these examples involving highly nonlinear and implicit LSFs conrms the high potential of the method to be applied to the real-world engineer-ing problems.
7. Conclusions
In this study, an adapted DOE was presented for decomposition-based meta-models in structural relia-bility. The idea of the proposed approach was based on simulation approaches that separated the design space into two safe and unsafe regions. The employed DRM-based meta-model required a one-dimensional interpolation method to approximate the LSF; hence, this study also investigated the eciency and accuracy of various interpolation techniques in applicability of the proposed method. Solving numerical and engineer-ing problems with 6 dierent interpolation techniques proved that among the investigated interpolation ap-proaches, using the spline and kriging method in the proposed approach provided results with acceptable accuracy. By using the proposed framework, we found out that eciency of the method was similar to that of FORM, while its accuracy was close to that of MCS.
References
1. Ditlevsen, O. and Madsen, H.O., Structural Reliability Methods, New York, Wiley, 178, pp. 18-25 (1996).
2. Hasofer, A.M. and Lind, N.C. \Exact and invariant second-moment code format", Journal of the Engineer-ing Mechanics Division, 100(1), pp. 111-121 (1974).
3. Rackwitz, R. and Flessler, B. \Structural reliability under combined random load sequences", Computers & Structures, 9(5), pp. 489-494 (1978).
4. Der Kiureghian, A., Lin, H.Z., and Hwang, S.J. \Second-order reliability approximations", Journal of Engineering Mechanics, 113(8), pp. 1208-1225 (1987).
5. Liu, P.L. and Der Kiureghian, A. \Optimization al-gorithms for structural reliability", Structural Safety, 9(3), pp. 161-177 (1991).
6. Wang, L. and Grandhi, R.V. \Safety index calculation using intervening variables for structural reliability analysis", Computers & Structures, 59(6), pp. 1139-1148 (1996).
7. Metropolis, N. and Ulam, S. \The Monte Carlo
method", Journal of the American Statistical Associa-tion, 44(247), pp. 335-341 (1949).
8. Yazdani, A., Nicknam, A., Khanzadi, M., and Mo-taghed, S. \An articial statistical method to estimate seismicity parameter from incomplete earthquake cat-alogs: A case study in metropolitan Tehran, Iran", Scientia Iranica, Transactions A, Civil Engineering, 22(2), p. 400 (2015).
9. Zuev, K. \Subset simulation method for rare event estimation: An Introduction", ArXiv preprint arXiv: 1505.03506 (2015).
10. Wang, Z. and Song, J. \Cross-entropy-based adaptive importance sampling using von Mises- Fisher mixture for high dimensional reliability analysis", Struct Saf, 59, pp. 42-52 (2016).
11. Fan, H. and Liang, R. \Importance sampling based algorithm for ecient reliability analysis of axially loaded piles", Computers and Geotechnics, 65, pp. 278-284 (2015).
12. Ibrahim, Y. \Observations on applications of im-portance sampling in structural reliability analysis", Struct Safety, 9(4), pp. 269-281 (1991).
13. Nie, J. and Ellingwood, B.R. \Directional methods for structural reliability analysis", Struct Safety, 22(3), pp. 233-249 (2000).
14. Depina, I., Le, T.M.H., Fenton, G., and Erikson, G. \Reliability analysis with metamodel line sampling", Struct Saf, 60, pp. 1-15 (2016).
15. Pradlwarter, H.J., Schueller, G.I., Koutsourelakis, P.S., and Charmpis, D.C. \Application of line sampling simulation method to reliability benchmark problems", Struct Safety, 29(3), pp. 208-221 (2007).
16. Rashki, M., Miri, M., and Moghaddam, M.A. \A new ecient simulation method to approximate the prob-ability of failure and most probable point", Structural Safety, 39, pp. 22-29 (2012).
17. Au, S.K. and Beck, J.L. \Estimation of small failure probabilities in high dimensions by subset simulation", Probabilistic Engineering Mechanics, 16(4), pp. 263-277 (2001).
18. Ghanem, R. and Spanos, P.D. \Polynomial chaos in stochastic nite elements", Journal of Applied Mechan-ics, 57(1), pp. 197-202 (1990).
19. Kaminski, M. and Swita, P. \Structural stability and reliability of the underground steel tanks with the stochastic nite element method", Archives of Civil and Mechanical Engineering, 15(2), pp. 593-602 (2015).
20. Ghavidel, A., Mousavi, S.R., and Rashki, M. \The eect of FEM mesh density on the failure probability analysis of structures", KSCE Journal of Civil Engi-neering, 22(7), pp. 2370-2383 (2018).
21. Gong, J.X. and Yi, P. \A robust iterative algorithm for structural reliability analysis", Structural and Mul-tidisciplinary Optimization, 43(4), pp. 519-527 (2011).
22. Johari, A., Momeni, M., and Javadi, A.A. \An an-alytical solution for reliability assessment of pseudo-static stability of rock slopes using jointly distributed random variables method", Iranian Journal of Science and Technology Transactions of Civil Engineering, 39, pp. 351-363 (2015).
23. Hasofer, A.M. and Lind, N.C. \Exact and invariant second-moment code format", Journal of the Engineer-ing Mechanics Division, 100(1), pp. 111-121 (1974).
24. Keshtegar, B. and Miri, M. \Reliability analysis of cor-roded pipes using conjugate HL-RF algorithm based on average shear stress yield criterion", Engineering Failure Analysis, 46, pp. 104-117 (2014).
25. Johari, A., Mousavi, S., and Nejad, A.H. \A seismic slope stability probabilistic model based on Bishop's method using analytical approach", Scientia Iranica. Transactions A, Civil Engineering, 22(3), p. 728 (2015).
26. Rackwitz, R. and Flessler, B. \Structural reliability under combined random load sequences", Computers & Structures, 9(5), pp. 489-494 (1978).
27. Santosh, T.V., Saraf, R.K., Ghosh, A.K., and Kush-waha, H.S. \Optimum step length selection rule in
modied HL-RF method for structural reliability", International Journal of Pressure Vessels and Piping, 83(10), pp. 742-748 (2006).
28. Yang, D. \Chaos control for numerical instability of rst order reliability method", Communications in Nonlinear Science and Numerical Simulation, 15(10), pp. 3131-3141 (2010).
29. Zhou, W., Gong, C., and Hong, H.P. \New perspective on application of rst-order reliability method for estimating system reliability", Journal of Engineering Mechanics, 143(9), p. 04017074 (2017).
30. Yun, W., Lu, Z., Jiang, X., and Zhao, L.F. \Maximum probable life time analysis under the required time-dependent failure probability constraint and its meta-model estimation", Structural and Multidisciplinary Optimization, 55(4), pp. 1439-1451 (2017).
31. Bhadra, A. and Ionides, E.L. \Adaptive particle allo-cation in iterated sequential Monte Carlo via approxi-mating meta-models", Statistics and Computing, 26(1-2), pp. 393-407 (2016).
32. Dengiz, B., _Ic, Y.T., and Belgin, O. \A meta-model based simulation optimization using hybrid simulation-analytical modeling to increase the productivity in automotive industry", Mathematics and Computers in Simulation, 120, pp. 120-128 (2016).
33. Sudret, B. \Meta-models for structural reliability and uncertainty quantication", arXiv preprint arXiv: 1203.2062 (2012).
34. Cadini, F., Santos, F., and Zio, E. \An improved adap-tive kriging-based importance technique for sampling multiple failure regions of low probability", Reliability Engineering & System Safety, 131, pp. 109-117 (2014).
35. Echard, B., Gayton, N., and Lemaire, M. \AK-MCS: an active learning reliability method combining kriging and Monte Carlo simulation", Structural Safety, 33(2), pp. 145-154 (2011).
36. Bucher, C.G. and Bourgund, U. \A fast and ecient response surface approach for structural reliability problems", Structural Safety, 7(1), pp. 57-66 (1990).
37. Nguyen, X.S., Sellier, A., Duprat, F., and Pons, G. \Adaptive response surface method based on a double weighted regression technique", Probabilistic Engineering Mechanics, 24(2), pp. 135-143 (2009).
38. Kang, S.C., Koh, H.M., and Choo, J.F. \An ef-cient response surface method using moving least squares approximation for structural reliability anal-ysis", Probabilistic Engineering Mechanics, 25(4), pp. 365-371 (2010).
39. Allaix, D.L. and Carbone, V.I. \An improvement of the response surface method", Structural Safety, 33(2), pp. 165-172 (2011).
40. Cai, W. \A dimension reduction algorithm pre-serving both global and local clustering structure", Knowledge-Based Systems, 118, pp. 191-203 (2017).
41. Xu, H. and Rahman, S. \A moment-based stochastic method for response moment and reliability analysis",
In Proceedings of 2nd MIT Conference on Computa-tional Fluid and Solid Mechanics, pp. 17-20 (2003).
42. Xu, H. and Rahman, S. \A generalized dimension-reduction method for multidimensional integration in stochastic mechanics", International Journal for Nu-merical Methods in Engineering, 61(12), pp. 1992-2019 (2004).
43. Huang, B. and Du, X. \Uncertainty analysis by dimen-sion reduction integration and saddle point approxi-mations", Journal of Mechanical Design, 128(1), pp. 26-33 (2006).
44. Lee, I., Choi, K.K., and Du, L. \Alternative methods for reliability-based robust design optimization includ-ing dimension reduction method", In ASME 2006 International Design Engineering Technical Confer-ences and Computers and Information in Engineering Conference, pp. 1235-1246 (2006).
45. GhohaniArab, H. and Ghasemi, M.R. \A fast and robust method for estimating the failure probability of structures", P I Civil Eng Str B, 168(4), pp. 298-309 (2015).
46. Lv, Z., Lu, Z., and Wang, P. \A new learning function for Kriging and its applications to solve reliability problems in engineering", Computers & Mathematics with Applications, 70(5), pp. 1182-1197 (2015).
47. Zou, T., Mahadevan, S., Mourelatos, Z., and Meernik, P. \Reliability analysis of automotive body-door sub-system", Reliability Engineering & System Safety, 78(3), pp. 315-324 (2002).
48. Gavin, H.P. and Yau, S.C. \High-order limit state functions in the response surface method for structural reliability analysis", Structural Safety, 30(2), pp. 162-179 (2008).
49. Dubourg, V. and Sudret, B. \Meta-model-based im-portance sampling for reliability sensitivity", Struc-tural Safety, 49, pp. 27-36 (2014).
50. Wang, P., Lu, Z., and Tang, Z. \An application of the Kriging method in global sensitivity analysis with parameter uncertainty", Applied Mathematical Modelling, 37, pp. 6543-6555 (2013).
Biographies
Mehralah Rakhshani Mehr received his BSc in Civil Engineering from University of Sistan and Baluchestan (USB), Iran, in 2007, and MSc and PhD in Structural Engineering from USB in 2009 and 2014, respectively. He is currently Assistant Professor at AL-Zahra University, Tehran, Iran. His main research areas are concrete structures analysis and rehabilita-tion, dynamics of structures, and structural reliability analysis.
Hamed Mirkamali received his BSc in Civil Engi-neering from Islamic Azad University, Zabol, Iran, in 2012, and MSc in Earthquake Engineering from Shiraz University of Technology, Shiraz, Iran, in 2015. He carried out his research thesis entitled \Vulnerability Assessment of Gas Network Using the First Order and Simulation Reliability Methods" under supervision of Dr. Hossain Rahnema and acquired excellent grade of 19.4 out of 20. His research achievements have been quite signicant and he has already published two conference papers.
Mohsen Rashki received his BSc in Civil Engineering from University of Sistan and Baluchestan (USB), Iran, in 2007, and MSc and PhD in Structural Engineer-ing from USB in 2009 and 2014, respectively. He is currently Assistant Professor in the Architecture Department of USB. He has published several research papers. His main research areas and interests are structural reliability analysis, reliability-based design optimization, and Bayesian probabilistic approaches. Abdolhamid Bahrpeyma received his MSc in Ar-chitectural Engineering from University of Science and Industry, Tehran, Iran, in 1994, and PhD in Urban Planning Engineering from Paris Nanterre University, France, in 2007. He is currently Assistant Professor in Civil Engineering Department at Sistan and Baluches-tan University.