http://www.sciencepublishinggroup.com/j/eas doi: 10.11648/j.eas.20200501.14
ISSN: 2575-2022 (Print); ISSN: 2575-1468 (Online)
Analysis of the Power Plant Breakwater Failure Subjected to
Typhoon Mangkhut Based on Model Experiment
Qie Lu-wen
1, Wang Chao
1, 2, Luan Ying-ni
2, Chen Song-gui
2, Chen Han-bao
21College of Civil Engineering & Architecture, Hebei University, Baoding, China 2
Tianjin Research Institute for Water Transport Engineering, Tianjin, China
Email address:
To cite this article:
Qie Lu-wen, Wang Chao, Luan Ying-ni, Chen Song-gui, Chen Han-bao. Analysis of the Power Plant Breakwater Failure Subjected to Typhoon Mangkhut Based on Model Experiment. Engineering and Applied Sciences. Vol. 5, No. 1, 2020, pp. 22-27.
doi: 10.11648/j.eas.20200501.14
Received: January 6, 2020; Accepted: February 12, 2020; Published: February 25, 2020
Abstract:
Growing social concern regarding the environmental and visual impacts associated with coastal structures due to climatic change is leading to a reduction in breakwater failures. After Typhoon Mangkhut passed through the southeastern coast of China on September 16 in 2018, the breakwater of a Power Plant was serious failure. As a case study based on model test, the failure process and causes of breakwater were explored in this paper. The wave height and water level were used as the wave parameters, which were accurately extracted by the GOHS system when the typhoon transits, and the breakwater failure process was reproduced based on the typhoon wave forces action at that time. By the experimental result investigating, it was found that the joint of the caisson breakwater and the mound breakwater was firstly failure, then the armor blocks and stones near the seawalls became to be unstable, the seawall was collapsed finally. Based on the analysis of the experiment, the distribution in time and space of the damage of the protective blocks are obtained and divided into different damage areas according to the degree of failure. The wave energy concentration as a important factor were proposed in this paper and the conclusion would be provide as a reference for the study of breakwater engineering.Keywords:
Breakwater Failure, Reconstruct Test, Wave Energy Concentration, Destruction Form1. Introduction
The breakwater played a special position among the different types of hydraulic structures in the harbour [1]. And due to the extreme weather effects such as typhoons, breakwaters are always affected by typhoon waves and failure problems occur in the past decades [2]. This type coastal structures are frequently overtopped by waves [3], so wave energy is allowed to pass through or over the structure; consequently, the overtopping events have a direct impact on the hydraulic stability of the crest and rear slope armors producing several armor damage in these parts of the structure because of the wave energy dissipation [4]. Therefore, the armor design in wave breaking conditions involves estimating the incident characteristic wave height at the breakwater toe, but the standard stability formulas found in the literature have rarely taken into account the wave height distribution changes due to wave breaking. Some empirical modifications have been proposed by Herrera et al.
criteria given by Losada et al. [10] and Vidal et al. [11] was followed for double-layer armors: Initiation of Damage (IDa) occurs when the upper armor layer loses some units and gaps in the size of an armor unit are visible. In the case of single-layer armors, the criterion defined by Gómez-Martín [12] was followed: IDa occurs when the upper armor layer has lost one or more units and gaps the size of an armor unit are visible in the armor.
In china, a shipyard wharf breakwater was suffered serious damage under the influence of Typhoon Bulawan No. 6 in 2012, resulting in the collapse of a number of wave walls, instability of the armor blocks, fragmentation and suspension of the wharf surface by scour [13]. In October 2013, a mound breakwater between Dashandun and Chijiao in Kanmen Bay was attacked by a strong typhoon Fitow. Most of the dolosses outside the shoulder platform of the breakwater were broken. The core rock was severely scored hollowed through, and the breast wall of the breakwater was collapsed, so as to the first step of the energy dissipation sill [14]. No. 22 Typhoon Mujigae in 2015 caused great damage to the West breakwater of Maoming Port in Guangdong Province, which was a combination breakwater of mound type and caisson type. Its west breakwater 0 +270 ~0 +650 section was seriously damaged, and a large number of blocks were appeared on the outer slope side [15].
In recent decades, there have been great developments in wave theory research and breakwater model test techniques. According to the case of breakwater damage at a power plant in Indonesia, the reason of breakwater damage is analyzed and the repair scheme is present by Deng [16]. The reasons of breakwater damage in a power plant abroad are
summarized from the aspects of hydrodynamic condition, breakwater structure and breakwater construction, and the repair scheme is proposed by Wang [17]. Thereby, typhoon waves have caused serious damage to all parts of the breakwater, especially the instability of the surface protection blocks. Many scholars have investigated the reasons for instability based on the actual situation of breakwater destruction. In this paper, according to the case of the power plant breakwater subjected to severe typhoon, the breakwater failure process was reconstructed by a local overall physical model test and the process and instability characteristics of the breakwater retaining block of the slope breakwater under the typhoon wave action were carried out.
The breakwater of a power plant adopts a combination of mound part and caisson part in this case study. The head part of structure is a caisson breakwater, and the mound breakwater was the main component structural form of the breakwater. On the outer side of the slope breakwater, there is a layer of 24t accropodes. Since the breakwater was built up, it has experienced many strong typhoons, especially under the influence of typhoon waves caused by the strong typhoon Mangkhut on September 16, 2018. The serious unstable parts located at the junction of the caisson and the slope mound at the head of the breakwater, and at the accropodes near the breast wall. The blocks and core stones under the armors were also severely scored, resulting in the breast wall collapse. In order to determine the breakage process, the wave parameters on the original breakwater were used to research the failure causes in this experiment.
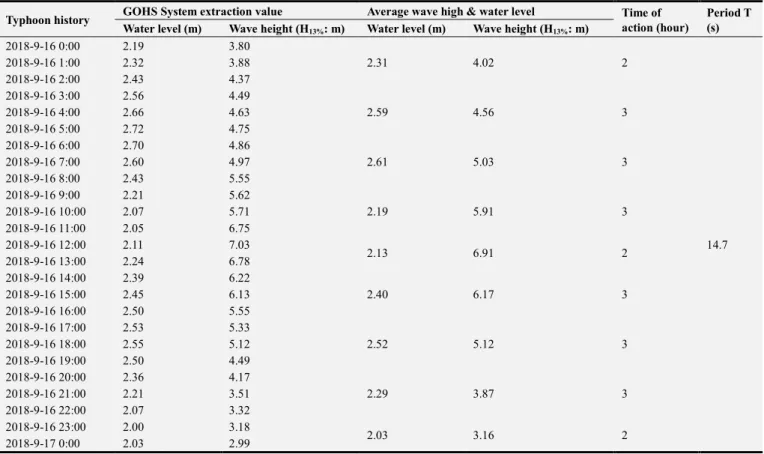
Table 1. The wave condition and water level in duplication test.
Typhoon history GOHS System extraction value Average wave high & water level Time of action (hour)
Period T (s) Water level (m) Wave height (H13%: m) Water level (m) Wave height (H13%: m)
2018-9-16 0:00 2.19 3.80
2.31 4.02 2
14.7
2018-9-16 1:00 2.32 3.88
2018-9-16 2:00 2.43 4.37
2018-9-16 3:00 2.56 4.49
2.59 4.56 3
2018-9-16 4:00 2.66 4.63
2018-9-16 5:00 2.72 4.75
2018-9-16 6:00 2.70 4.86
2.61 5.03 3
2018-9-16 7:00 2.60 4.97
2018-9-16 8:00 2.43 5.55
2018-9-16 9:00 2.21 5.62
2.19 5.91 3
2018-9-16 10:00 2.07 5.71
2018-9-16 11:00 2.05 6.75
2018-9-16 12:00 2.11 7.03
2.13 6.91 2
2018-9-16 13:00 2.24 6.78
2018-9-16 14:00 2.39 6.22
2.40 6.17 3
2018-9-16 15:00 2.45 6.13
2018-9-16 16:00 2.50 5.55
2018-9-16 17:00 2.53 5.33
2.52 5.12 3
2018-9-16 18:00 2.55 5.12
2018-9-16 19:00 2.50 4.49
2018-9-16 20:00 2.36 4.17
2.29 3.87 3
2018-9-16 21:00 2.21 3.51
2018-9-16 22:00 2.07 3.32
2018-9-16 23:00 2.00 3.18
2.03 3.16 2
2. Wave Parameters and Water Levels
The irregular waves were simulated by the law of gravity similarity and the Wave Model Test Specification [17]. The JONSWAP spectrum was adopted, in which the spectral peak factor is γ= 3.3, the wave height was the 13% characteristic wave height, and the disadvantageous SSE wave was taken in this model test.
In order to reconstruct the breakwater failure process completely, the Global Ocean Hydraulics System (GOHS) system self-developed by the Tianjin Research Institute for Water Transport Engineering of the Ministry of Transport of China (TIWTE) was used to simulate the wave heights and water levels. After verification with measured wave data, the wave heights and water levels at the engineering location of typhoon Mangkhut can be accurately extracted by GOHS. The 24-hour wave data (From 2018-9-16 0:00 to 2018-9-17 0:00) were selected as the severe influence of Typhoon
Mangkhut, and the breakwater failure process can be thoroughly recorded. The wave parameters in one-hour interval are shown in Table 1. After analyzing the data, 9 groups of average combined wave highs and water levels were utilized in the physical model test.
3. Reproduced Model Experiment of
Breakwater
The breakwater consists of a caisson breakwater and a mound breakwater, of which the caisson breakwater with a length of 56M was arranged at the head part of whole structure. The cross section drawing is shown in Figure 1. The model is designed according to the gravitational similarity criterion. The structural section size is designed according to the geometric similarity criterion. The model similarity scale is 1:43.
Figure 1. Cross section drawing of the breakwater.
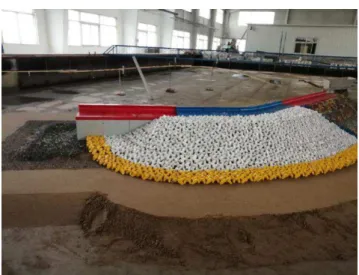
The model is arranged as shown in Figure 2.
Figure 2. The layout of breakwater model (seaside).
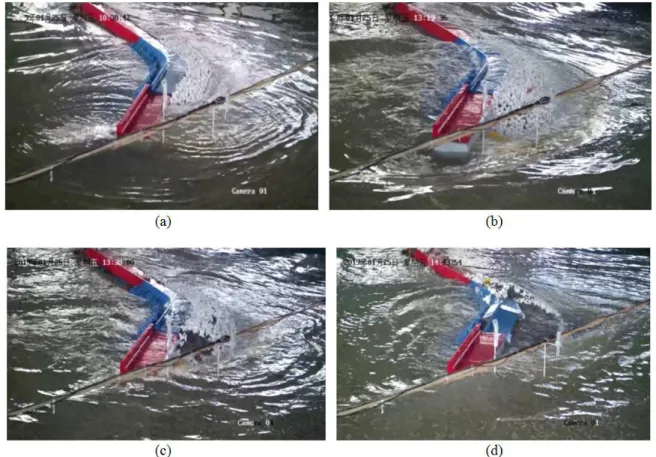
The duplication test was begun at 0:00 on September 16, and the experimental phenomenon under the action of each wave element were observed and recorded. Figure 3(a) ~Figure 3(d) were indicated the major phenomena of the entire
test process.
From 0:00 to 08:00, the breakwater remained stable at water levels from +2.31m to 2.61m, wave heights H13% from 4.02 m
to 5.03m. (Figure 3(a)).
From 9:00 to 11:00, the 24t accropodes cover at the junction of the breakwater was began to be loose under the continuous action of the typhoon waves, which water level was +2.19m, wave height H13% was 5.91m (Figure 3(b)).
From 12:00 to 13:00, the gap width between the accropodes at the junction of the embankment was continued to increase under the influence of water level +2.13m wave height H13% =
6.91m, and the blocks were begun to unstable. During this period of continue wave action, the armor blocks were beginning to lose stability along the axis of the breast wall, and the core rocks under the armor were started to be scored and the failure area was increased (Figure 3(c)).
Figure 3. The test phenomenon of duplication test.
Under the continuous action of subsequent water level and wave height, the damage of the armor blocks and the breast
wall were tended to steady state. After the experiment, the breakwater model was failure as shown in Figure 4:
Figure 4. Failure layout of the breakwater.
4. Analysis of Breakwater Failure
Process
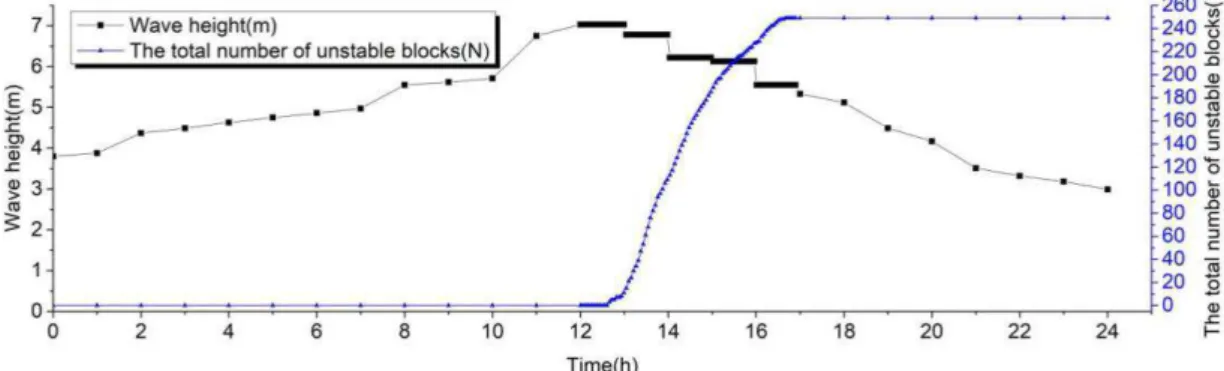
Based on the phenomena of the replay test, the accropodes were started to be unstable under the wave action from 12:00 to 13:00. In the process of breakwater damage, the number of failure blocks of 24t accorpodes at the every 10-minute interval was calculated, and it was used as a criteria for analyzing the breakage of breakwater.
Figure 5 shows the variation curve of wave heights and the instability armor block number respect to action time. From
the figure, it can be clearly seen that the breakwater armor blocks remained stable until the maximum wave height coming, and the breakage time was concentrated between 12:00 to 17:00.
According to the curve of Figure 5, and it can be analyzed by the experimental phenomena that:
blocks are damaged by impact waves in a very short period of time, and the damage is very obvious.
(2) From 13:45 to 16:00, the slope of the curve had a little change which indicated that the instability rate of the armor block was generally stable during this period. During the same time interval, the number of instability of the block was few different, and the damage form was ductile failure.
(3) After 16:00, the slope of the curve gradually becomes smaller and eventually becomes zero. At this time, the rate of increase in the number of instability of the shield block gradually decreases until the unstable block is no longer significantly increased, and the shield block is basically stable.
(4) Spatial distribution of slope breakage of breakwater was obtained. According to the experimental phenomenon, the surface protection block instability initially occurred at the junction of the head breakwater, and the next destruction position was developed along the axis of the breast wall toward the breakwater. Here, the damage rate of the surface is defined by the number of unstable blocks per 10 minutes and used as an evaluation index to determine the vulnerability of different positions of the slope breakwater. The damage rate of the surface is calculated from 12:00 to 17:00 (Figure 6). The surface damage location is divided into three areas: junction area at head breakwater, area A and area B as shown in Figure 7.
Figure 5. The variation of the wave height and the cumulative instability number of block during the test.
Figure 6. Number of block instability per 10 min during the destruction of the face.
Figure 7. Distribution of destruction area division.
(5) From 0 to 105 minute, the surface damage position was at the junction of the embankment head. During this period, the instability rate of the surface protection block sharply increased from 0 to a maximum of 22 blocks per 10 minutes, and the minimum was 3 blocks per 10 minutes, The damage speed of the armor surface changes significantly, so the junction of the head breakwater was a vulnerable area.
(7) In time from 240min to 300min, the surface damage position is in the area B. During this period, the rate of instability change of the surface block once again decreases to 0, so the B area near the wall is a non-vulnerable area.
5. Conclusion
Under the influence of typhoon waves, the slope breakwater protection surface has a certain form of failure. It is a reasonable method to study the instability law of the slope breakwater surface during the typhoon transit through the reproductive test of breakwater failure.
According to the change in the cumulative number of unstable blocks over time, the armor failure of breakwater from 12:30 to 13:45 was in the form of brittle damage, and in the form of ductile damage from 13:45 to 16:00. After 16:00 o’clock, the damage speed of the surface gradually decreased to zero, and the number of instability of the surface body no longer increased significantly.
Based on the spatial distribution of the destruction of the breakwater surface, it can be judged that the protection surface at the junction of the head breakwater is not only the first destruction area but also at the maximum speed of destruction, which belongs to the vulnerable area. The destruction order of area A near the breast wall is only at the junction of the embankment head, and the damage speed of the shield gradually decreases, belonging to the sub-vulnerable area. In the area B near the wall, the destruction speed continued to decrease to 0, belonging to non-vulnerable areas.
References
[1] WU Yong-qiang, LI Yan-bao, LIU Ying-hui. Discussion on the Research and Reasons of Breakwater Failures [J]. Port Engineering technology, 2008 (02): 8-11. (In Chinese)
[2] Gloria Argente, M. Esther Gómez-Martín and Josep R. Medina. Hydraulic Stability of the Armor Layer of Overtopped Breakwaters. Journal of Marine Science and Engineering. 2018, (6), 143.
[3] Burcharth, H. F.; Kramer, M.; Lamberti, A.; Zanuttigh, B. Structural stability of detached low crested breakwaters. Coast. Eng. 2006, 53, 381–394.
[4] CIRIA/CUR/CETMEF. The Rock Manual. The Use of Rock in Hydraulic Engineering, 2nd ed.; CIRIA: London, UK, 2007; 1267p.
[5] Herrera, M. P.; Gómez-Martín, M. E.; Medina, J. R. Hydraulic stability of rock armors in breaking conditions. Coast. Eng. 2017, 127, 55–67. J. Mar. Sci. Eng. 2018, 6, 143.
[6] Van der Meer, J. W.; Daemen, I. F. R. Stability and wave transmission at low-crested rubble mound structures. J. Waterw. Port Coast. Ocean Eng. 1994, 120, 1–19.
[7] Vidal, C.; Losada, M. A.; Medina, R.; Mansard, E. P. D.; Gómez-Pina, G. A universal analysis for the stability of both low-crested and submerged breakwaters. In Proceedings of the 23rd Conference on Coastal Engineering, ASCE, Venice, Italy, 4–9 October 1992; pp. 1679–1692.
[8] Vidal, C.; López, F.; Losada, I. Stability of low crested and submerged rubble mound breakwaters. Proc. Coast. Struct. 2007, 2, 939–950.
[9] Gómez-Martín, M. E.; Medina, J. R. Heterogeneous packing and hydraulic stability of cube and Cubipod armor units. J. Waterw. Port Coast. Ocean Eng. 2014, 140, 100–108.
[10] Losada, M. A.; Desiré, J. M.; Alejo, L. M. Stability of blocks as breakwater armor units. J. Struct. Eng. 1986, 112, 2392–2401.
[11] Vidal, C.; Losada, M. A.; Medina, R. Stability of mound breakwaters’ head and trunk. J. Waterw. Port Coast. Ocean Eng. 1991, 117, 570–587.
[12] Gómez-Martín, M. E. Análisis de la Evolución de Averías en el Manto Principal de Diques en Talud Formado por Escolleras Cubos y Cubípodos. Ph.D. Thesis, Universitat Politècnica de València, Valencia, Spain, 2015.
[13] HU Xi-guang, YU Ding-yong. Failure Cause Analysis and Renovating Plan Study on Deepwater Mound Breakwaters [J]. Coastal Engineering, 2014, 33 (03): 47-54. (In Chinese)
[14] HUA Mao-ming. Kanmen Fishing Port Breakwater Renovating Plan [J]. China Water Tansport, 2016, 16 (06): 286-288+292. (In Chinese)
[15] WANG Ya-dong, HUANG Xuan-jun, LI Jing-hui. Stability test study on repair section of west breakwater in Bohe port area of Maoming Port [J]. China Harbour Engineering, 2018, 38 (06): 51-54. (In Chinese)
[16] DENG Zhen-zhou, FENG Jian-guo. Renovation Plan and Damage Causes Analysis of Breakwater of a Power Plant Terminal in Indonesia [J]. Port Engineering technology, 2018, 55 (06): 71-74. (In Chinese)