Analysis of Change Parameter After
Implementation of Enterprise Resource
Planning A Case Study
S. Sindhu1 and S.K. Moulick2
1Lecturer, Bhilai Institute of Technology, Durg, CG,
E-mail: [email protected].
2Professor, Bhilai Institute of Technology, Durg, CG,
E-mail: [email protected].
ABSTRACT:Bhilai Steel Plant the first PSU Integrated Steel Plant to have successfully implemented Enterprise Resources Planning SAP. The implementation of ERP, an Industrial IT tool for improvisation in Production Scheduling and Optimization of manufacturing operations. ERP is aimed at achieving quicker responsiveness to customer’s ever increasing demands, sustaining the business growth and also connecting the Shop floor Production information to the Boardroom/Management Business information are the needs of today’s competitive business era. Defining the objective of the paper and measuring the parameters by taking the subject for this study as the employees working at Bhilai Steel Plant who were consistently selected based on convenient sampling. Critical analysis is carried out on the data giving graphical interpretation with reference to the existing theories. Based on the analysis of the measured data, study on the change parameter is done with great care taking into account various mathematical interpretations. Conclusions are drawn based on the analysed data.
Keywords:Material requirement planning (MRP), return on investment (ROI), computer integrated manufacturing (CIM), system analysis and program development (SAP).
1. INTRODUCTION
1.1.Enterprise Resource Planning (ERP)
It is an enterprise-wide information system designed to coordinate all the resources, information, and activities needed to complete
business processes such as order fulfillment or billing. An ERP system supports most of the business system that maintains in a single database the data needed for a variety of business functions such as Manufacturing, Supply Chain Management, Financials, Projects, Human Resources and Customer Relationship Management [1]. Worldwide organizations are going for Enterprise Resource Planning systems [2] for information integration, aligning & streamli-ning their processes for delivering high value to the customers. It is an information system that integrates all manufacturing and related applications, including decision support, material requirements planning (MRP), accounting and distribution. ERP systems seek to integrate information across all functional areas (i.e., marketing, finance, HR, logistics etc.) and hopes to provide increased flexibility to organization in serving its customers.
An ERP system is based on a common database and a modular software design. The common database allows every department of a business to store and retrieve information in real-time. The infor-mation should be reliable, accessible, and easily shared. The modular software design should mean a business can select the modules they need, mix and match modules from different vendors, and add new modules of their own to improve business performance. Ideally the data for the various business functions are integrated. In practice the ERP system may comprise a set of discrete applications, each maintaining a discrete data store within one physical database. [3] 1.1.1. The Important Modules of Enterprise Resource Planning are
as Follows
1. Manufacturing: Engineering, Bills of Material, Scheduling, Capacity, Workflow Management, Quality Control, Cost Management, Manufacturing Process, Manufacturing Projects, Manufacturing Flow.
2. Supply Chain Management: Order to cash, Inventory, Order Entry, Purchasing, Product Configuration, Supply Chain Planning, Supplier Scheduling, Inspection of goods, Claim Processing, Commission Calculation.
3. Financials:General Ledger, Cash Management, Accounts Payable, Accounts Receivable, Fixed Assets.
4. Projects:Costing, Billing, Time and Expense, Activity Management. 5. Human Resources:Human Resources, Payroll, Training, Time
& Attendance, Rostering, Benefits.
6. Customer Relationship Management: Sales and Marketing, Commissions, Service, Customer Contact and Call Center support. 7. Data Warehouse: Various Self-Service interfaces for Customers,
Suppliers, and Employees.
8. Access Control:User privilege as per authority levels for process execution.
9. Customization: To meet the extension, addition, changes in process flow.
The five computerized system were implemented to monitor the process, this type of layouts were used to analyse the existing data.
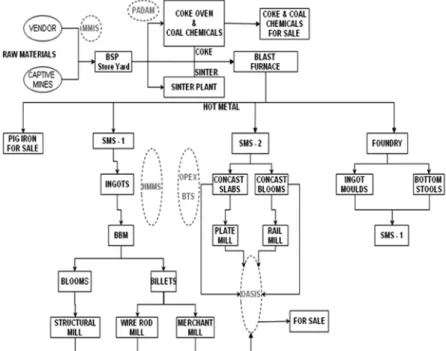
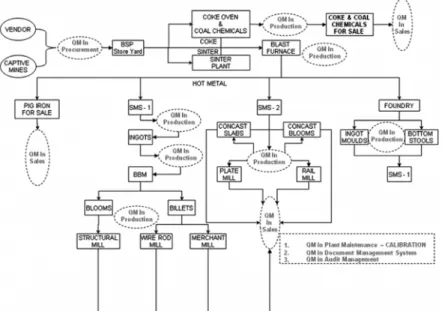
For analysing the change parameter and the percentage usage of modules, layout of various units of Bhilai Steel Plant were prepared after implementation of ERP as shown in the Figure 1. For the same unit of plant instead of five monitoring systems eleven ERP system was introduced for efficient working. [4]
2. CRITICAL ANALYSIS OF ERP
The analysis of change parameter and calculation of percentage usage of modules after implantation of ERP is carried out in three stages of work study technique. The various stages are given below.
Stage 1: Defining the Objective to be Carried Out in the Project:
The implementation of various modules of ERP in Bhilai Steel Plant was carried out to utilize all their resources effectively to make business more efficient and effective. The existing processes were thoroughly evaluated taking the various units of the plant. For example, a small unit is shown in the figure 2 where only five computerized system were implemented to monitor the process, this type of layouts were used to analyse the existing data.
Stage 2: Measuring the Parameters:Approaches in the measurement of change was explored in order to progress substantially beyond the current state of the art in which some measurement of change is best avoided where possible according to theory of Cronbach & Furby [4]. A quantity that defines certain characteristics of a system that serves to relate functions and variables using a common variable is a change parameter.
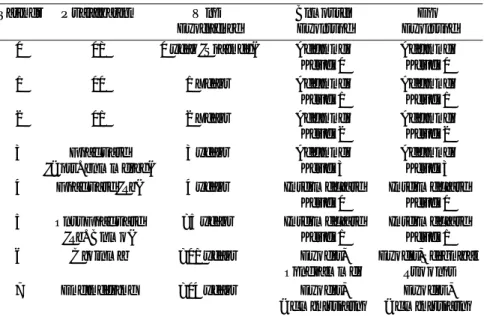
The percentage familiarity of employees in ERP with the duration of time is the change parameter in this case. Let this change parameter be denoted by “”. An eight point scale was prepared taking the subdivisions of Qualification [5], Work experience, Computer Exposure, ERP exposure, Willingness to change. The Qualification and work experience was divided into eight different parameters with the help of the experienced people working in the HR Department of Bhilai Steel Plant shown in Table 1.
Table 1 8-Point Rating Scale.
Ratings Qualification Work Computer Erp Experience Exposure Exposure
1 10 1 year (Trainee) Beginner Beginner
Level 1 Level 1
2 11 2 Years Beginner Beginner
Level 2 Level 2
3 12 3 Years Beginner Beginner
Level 3 Level 3
4 Graduate 4 years Beginner Beginner
(Arts/commerce) Level 4 Level 4
5 Graduate (Sc) 5 years Intermediate Intermediate
Level 1 Level 1
6 Post Graduate >6 years Intermediate Intermediate
(Sc/Comp) Level 2 Level 2
7 Diploma >10 years Expert- Expert-Technical
Programmer Support
8 Engineering >15 years Expert- Expert
-Administrator Administrator
On the basis of percentage familiarity calculation, we divided the employees under three groups: Control group, Experimental group, Non-experimental Group. Each group comprises of ten employees.
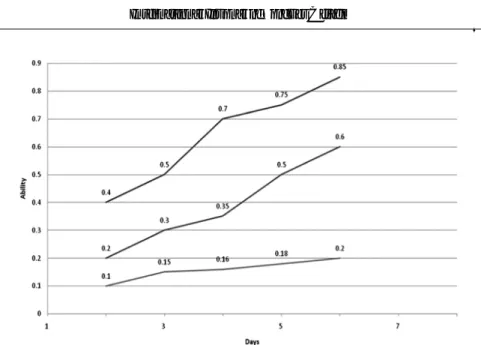
Figure 3: Comparative Study of Three Groups.
The employees who are already trained and involved in the ERP implementation come under control group. Since they are from the technical background, there percentage familiarity is 40 and more shown in Table 2.
Table 2
Data for Control Group
Employees Quali. Work Computer Erp Willingness Total Exp Exposure Exposure to Change
A1 6 4 3 1 1 15 A2 5 1 3 2 1 12 A3 7 3 2 2 2 16 A4 6 2 3 3 3 17 A5 5 5 3 3 4 20 A6 5 2 2 1 3 13 A7 5 3 2 2 4 16 A8 7 2 3 1 1 14 A9 6 2 4 1 2 15 A10 8 2 6 1 6 23 Total 16 0
The employees who were undergoing training under ERP implementation team, the software backend trainers form this group. Those were mostly semi-technical (diploma, ITI), graduate and post graduate employees of the company who were familiar with the computer systems as well. The percentage familiarity of these employees was 20 and more as shown in Table 3.
Table 3
Data For Experimental Group
Employees Quali. Work Computer Erp Willingness Total Exp Exposure Exposure to Change
B1 3 2 1 1 1 8 B2 3 2 2 1 1 9 B3 1 2 1 1 2 7 B4 1 3 1 1 2 8 B5 2 1 1 1 2 7 B6 4 1 1 1 2 9 B7 3 1 1 1 1 7 B8 6 2 3 1 1 13 B9 1 1 1 1 1 5 B10 1 2 1 1 1 6 Total 80
Percentage familiarityxx is given byXB= 80/400 * 100 = 20 The employees who were not undergoing training comes under this group. Those were mostly non technical undergraduate employees of the company who were not familiar with the computer systems as well. The percentage familiarity of these employees was 10 and above as shown in Table 4.
Table 4
Data for Non Experimental Group
Employees Quali. Work Computer Erp Total Exp Exposure Exposure
C1 1 3 1 1 4
C2 2 2 0 0 4
C3 3 1 1 0 5
C4 1 1 0 0 2
C5 4 2 0 0 6 C6 2 1 0 0 3 C7 1 3 0 0 4 C8 1 2 1 0 4 C9 2 2 1 0 5 C10 1 1 0 1 3 Total 40
Percentage familiarityxx is given byXC = 40/400 * 100 = 10.
Stage 3: Study of the Analysed Data:The ability of the employees in the control group is calculated as 40% on the third day. In the 15 days span, under training it increased to 85%. So the average percentage improvement per day from the given time span can be calculated as
Percentage Improvement,X= {(0.85 – 0.40)/15}* 100 = 3% per day The ability of the employees in the experimental group is calcu-lated as 20% on the third day. In the 15 days span, under training it increased to 60%. The percentage improvement per day from the given time span can be calculated as
Percentage Improvement, X = {(0.60 – 0.20)/15}* 100 = 2.66% per day
The ability of the employees in the non experimental group is calculated as 10%. In the 15 days span, under training it increased to 20%. [7] The percentage improvement per day from the given time span can be calculated as
Percentage Improvement,X = {(0.20 – 0.10)/15}* 100 = 0.006% per day
3. ESTIMATION OF TIME FOR AVERAGE PERCENTAGE IMPROVEMENT
Experimental group: To increase the percentage improvement to an average of 50%, the estimated time will be: No. of days = 50/ (2.6) = 19 days.
After ERP training, in these 19 days the improvement percentage will increase to 50.
Non experimental group: To increase the percentage improve-ment to an average of 50%, the estimated time will be: No. of years = 50/(0.006*365)=23 years.
After ERP training, in these 23 years the improvement percentage will increase to 50%. [8]
4. RESULT AND DISCUSSION
ERP rebuilds and revitalizes by removing the cobwebs and dead-woods. It drives organization towards growth and prosperity by continuously synchronizing itself with the changing environment. [9] It collaborates and builds relationships with external agencies like the vendors, customers etc. By virtue of its improved decision making capabilities helps an organization to compete with its competitors in a more effective manner. Its design is delay-proof. It does not allow any delay to happen inside the system. The integrated design makes orchestrated functioning reality. It harmonizes functioning of parts into a whole. Review of integration issues and training are important phenomena in it. It also guides an organization to create its own destiny. Manifesting explicitly it enhances prestige and acceptance of an organization in the business world. It sets up and maintains the core value system of an enterprise. It provides the pathway to growth and prosperity. It satisfies the quest for knowledge by virtue of its vastly improved information availability. [10] The powerful analytical tools help an organization to remain afloat even in periods of acute adversity. The disciplined functioning and improved decision making abilities protects an organization against risks and uncertainties.
5. CONCLUSION
The analysis and study done on various aspects of known parameters enable us to draw certain conclusions. The non experimental group take around 23 years to increase their percentage familiarity to 50%, which is practically very difficult for the company to achieve or wait for these many years. So for increasing the percentage familiarity, the alternative solution is to increase the rating of the employees by increasing the points in exposure to computer and ERP. Now, for
increasing these points certain training programmes can be conducted for computer exposure of employees. Also assessments can be taken at regular intervals for the employee development programmes.
REFERENCES
[1] Fredrickson, J.W., “The Strategic Decision Process and Organization Structure”,Academy of Management Journal,11(2), 1986, pp. 280-297.
[2] Beretta, S. (2002), “Unleashing the Integration Potential of ERP Systems: the
Role of Process-Based Performance Measurement Systems”,Business Process
Management Journal,8, No.3, pp. 254-77.
[3] “Why Erp? A Primer On Sap Implementation (Paperback-Jan 2000)” by F. Robert Jacobs, David Clay Whybark.
[4] Cronbach, L.J., Furby, L. (1970)., “How Should We Measure “Change”-or Should We? Psychological Bulletin”,74, pp. 68-80.
[5] Alderson et al., (1995 and McNamara, 1996) McNamara, T. (1996)., “Measuring Second Language Performance”. London: Longman.
[6] Rasch, G. (1961)., “On General Laws and the Meaning of Measurement in Psychology”, pp. 321-334In Proceedings of the Fourth Berkeley Symposium on Mathematical Statistics and Probability, IV. Berkeley: University of Chicago Press, 1980.
[7] Waldner, Jean-Baptiste (1992)., “CIM: Principles of Computer Integrated Manufacturing”, Chichester: John Wiley & Sons Ltd, pp. 47.
[8] Monk, Ellen; Wagner, “Concepts in Enterprise Resource Planning ”, Boston: Thomson Course Technology.
[9] Monk, Ellen and Wagner, Brett., ”Concepts in Enterprise Resource Planning”, 3rd.ed.Course Technology Cengage Learning.Boston.
[10] Ramaswamy V K (2007-09-27)., “Data Migration Strategy in ERP”, Retrieved on 2008-04-08.