Performance Management
Release Date: March 18, 2012
Prepared by:
Section Table of Contents
4. PERFORMANCE MANAGEMENT ... 4
4.1.INTRODUCTION TO PERFORMANCE MANAGEMENT ... 4
4.1.1. COREQUISITE PUBLICATIONS ... 4 4.1.2. DEFINITION ... 5 4.1.3. MISSION ... 5 4.1.4. OBJECTIVES ... 5 4.1.5. SCOPE... 5 4.1.6. SMC DISCIPLINE INTERFACES ... 6
4.1.7. SYSTEMS SUPPORT GROUP ORGANIZATION CHART ... 9
4.2.PROCESS OVERVIEW ... 10
4.3.PROCESS FLOW ... 12
4.4.MVSPROCESS ELEMENTS ... 13
4.4.1. SYSTEM THRESHOLDS ... 21
4.4.2. APPLICATION THRESHOLDS ... 21
4.4.3. MVS PERFORMANCE MANAGEMENT TOOLS ... 22
4.4.4. SERVICE LEVEL REPORTER ... 25
4.4.5. PERFORMANCE MANAGEMENT PROCEDURES ... 28
4.4.6. STANDARDS AND GUIDELINES ... 30
4.5.ROLES AND RESPONSIBILITIES ... 35
4.5.1. DISCIPLINE OWNER ... 35
4.5.2. SMC ACCOUNT COORDINATOR ... 36
4.5.3. MVS PERFORMANCE ANALYST ... 37
4.5.4. LAN PERFORMANCE ANALYST ... 37
4.5.5. MVS SYSTEMS SUPPORT PROGRAMMERS ... 38
4.5.6. APPLICATION DEVELOPMENT PROGRAMMERS ... 38
4.5.7. DATA STORAGE MANAGEMENT ANALYST... 38
4.5.8.PERFORMANCE MANAGEMENT ANALYST ... 39
4.5.9. SYSTEM SUPPORT PROGRAMMERS ... 39
4.5.10. USER AND CUSTOMER REPRESENTATIVES ... 40
4.6.PROCESS EVALUATION ... 41
4.6.1. ANNUAL SELF ASSESSMENT ... 41
Section Table of Figures
FIGURE 1: SMC DISCIPLINE INTERFACES ... 6
FIGURE 2: FUNCTIONAL RESPONSIBILITIES OF THE SYSTEMS SERVICES GROUP ... 9
FIGURE 3: PERSONNEL ASSIGNED TO THE SYSTEM SERVICES FUNCTIONAL RESPONSIBILITIES ... 9
FIGURE 4: PERFORMANCE MANAGEMENT STANDARDS AND PROCEDURES PROCESS ... 10
FIGURE 5: PERFORMANCE MANAGEMENT ON-GOING FUNCTIONAL RESPONSIBILITIES ... 11
FIGURE 6: PERFORMANCE MANAGEMENT FLOW DIAGRAM ... 12
FIGURE 7: MVS PERFORMANCE INDICATORS ... 16
FIGURE 8: CICS PERFORMANCE INDICATORS ... 17
FIGURE 9: IDMS PERFORMANCE INDICATORS ... 18
FIGURE 10: DB2 PERFORMANCE INDICATORS ... 19
4.
Performance Management
4.1. Introduction to Performance Management
This section describes the Performance Management process for the Technical Operations environment.
4.1.1. Corequisite Publications
The following manuals are referenced in this document:
• MVS/Extended Architecture Resource Measurement Facility (RMF) Monitor I and II Reference and User's Guide, LC28-1556
• MVS/Extended Architecture Resource Measurement Facility (RMF) Monitor III Reference and User's Guide, LC28-1557
• MVS/XA System Programming Library: Service Aids, GC28-1159
• MVS/XA Systems Programming Library: Systems Management Facilities (SMF), GC28-1153
• Generalized Trace Facility Performance Analysis Reporting System (GTFPARS), SB21-2143
• System for Generalized Performance Analysis Report (GPAR), SB21-2500 • IBM Report Management and Distribution System: User's Guide, SC30-3192
• IBM Report Management and Distribution System: General Information Manual, GC30-3191
• File Transfer Program General Information, GH12-5143
4.1.2. Definition
Performance Management is the process of planning, defining, measuring, analyzing, reporting and tuning the performance of resources including data networks, hardware and operating systems, applications and services.
4.1.3. Mission
The Performance Management process is designed to assure that each of the systems is performing in such a manner that service level objectives are met.
4.1.4. Objectives
The objective of Performance Management is to ensure that the performance service levels are achieved through the efficient use of resources.
4.1.5. Scope
The process includes performance management of both the hardware and software components of the following systems:
Host This includes the primary data processing system for the project and the program products, system applications and batch applications that run on the system.
Network This is any controller or modem device used for communication between the host mainframe and the data network. It also includes routers, bridges, concentrators and encryptors for LAN connectivity.
Client/Server This includes the hardware and software that make up both the end user workstation environment and the servers that support end users.
4.1.6. SMC Discipline Interfaces
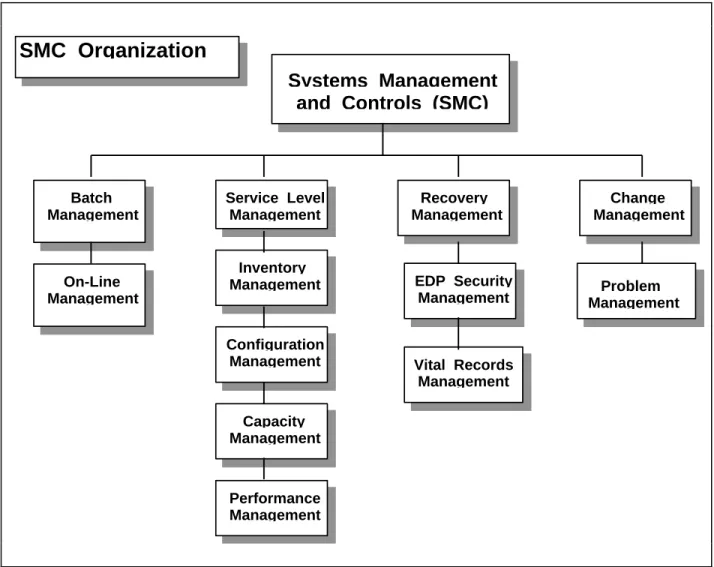
The diagram below describes how Capacity Management interfaces with the other Systems Management and Control disciplines within the organization.
SMC Organization
Inventory Management Configuration Management Capacity Management Performance Management Recovery Management Service Level Management EDP Security Management Vital Records Management Batch Management On-Line Management Change Management Problem Management Systems Management and Controls (SMC)Figure 1: SMC Discipline Interfaces
The owners of the SMC disciplines are listed within the organization chart shown above. More detailed organization charts will list personnel associated with the discipline and their functional responsibilities.
The SMC Disciplines interface with each other for effectiveness and efficiency. For a more detailed explanation of each discipline, refer to the indvidual sections within the Standards and Procedures manual.
How the SMC disciplines interface with Performance Management is described below.
Batch Management
Batch processing uses the Problem Management process to communicate performance-related problems to the Performance Management group. Performance Management monitors, analyzes, resolves or recommends solutions to batch performance problems.
Capacity Management
When Performance Management determines that the resolution of a performance problem requires hardware changes, this information is communicated to Capacity Management for use in the development of the Master Equipment Plan. Should equipment need to be ordered immediately to resolve the performance problem, then Capacity Management will make the appropriate arrangements to procure the equipment.
Change Management
Performance Management interacts with Change Management in two ways.
1. As an initiator of performance-related changes. The Change Management process is used when Performance Management needs to make a change to the environment. these changes include hardware and software type changes.
2. As an approver of changes. All changes to a system have the potential to affect the performance of the system, be it positive or negative. To maintain awareness of the potential performance impact of impending changes and to minimize any negative impact, Performance Management reviews and approves or rejects all changes that may affect the performance of the systems.
On-Line Management
Performance Management monitors the system and subsystems that affect online performance objectives. Performance Management attempts to proactively monitor systems to identify and correct perfromance problems before users are impacted. In addition, On-Line Management uses the Problem Management process to communicate performance-related problems to the Performance Management group. Performance Management monitors, analyzes, resolves or recommends solutions to online
performance problems.
Problem Management
The Problem management process is the communication interface between the
Performance Management process and both the Batch and On-Line Management process. System and performance problems are reported through the Problem Management
process for monitoring, problem determination, and problem resolution by Performance Management personnel.
Service Level Management
Service Level Management’s service definitions are used by Performance Management as a high-water mark for performance issues. When service level objectives are in danger of being missed or have been exceeded, Performance Management investigates the causes and recommends improvements. Monthly performance reports indicate if service level objectives have been met.
4.1.7. Systems Support Group Organization Chart
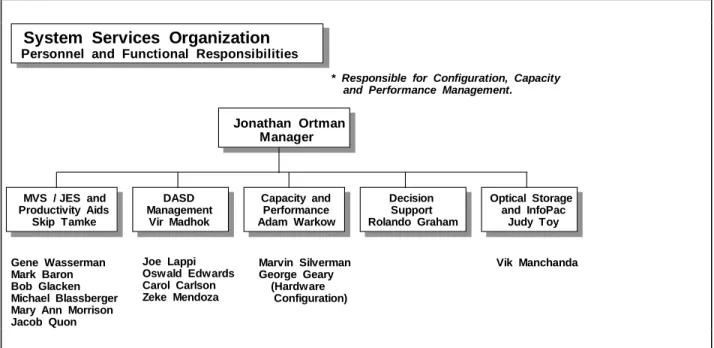
The Functional Responsibilities of the System Services Organization are listed below.
System Services Organization Organizational Structure Jonathan Ortman Manager MVS / JES and Productivity Aids Capacity and Performance Decision Support Optical Storage and InfoPac DASD Management
* Responsible for Configuration, Capacity and Performance Management.
Figure 2: Functional Responsibilities of the Systems Services Group
The personnel assigned to the Functional Responsibilities are:
System Services Organization Personnel and Functional Responsibilities
Jonathan Ortman Manager MVS / JES and Productivity Aids Skip Tamke Capacity and Performance Adam Warkow Decision Support Rolando Graham Optical Storage and InfoPac Judy Toy Gene Wasserman Mark Baron Bob Glacken Michael Blassberger Mary Ann Morrison Jacob Quon Marvin Silverman George Geary (Hardware Configuration) DASD Management Vir Madhok Joe Lappi Oswald Edwards Carol Carlson Zeke Mendoza Vik Manchanda
* Responsible for Configuration, Capacity and Performance Management.
4.2. Process Overview
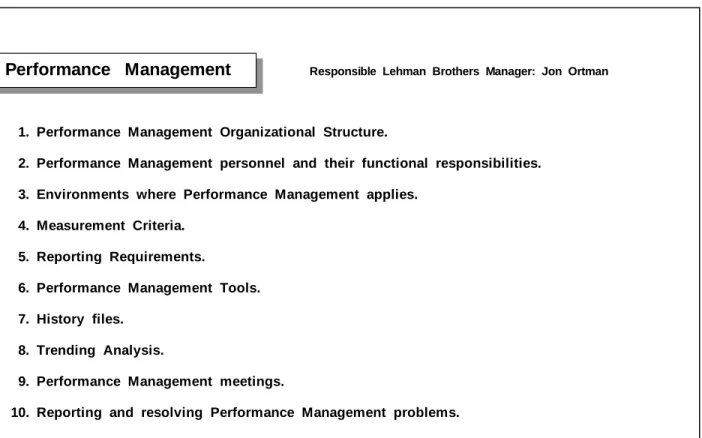
The methodology for formulating the Performance Management Standards and Procedures Manual is described below.
Performance Management Responsible Lehman Brothers Manager: Jon Ortman
1. Performance Management Organizational Structure.
2. Performance Management personnel and their functional responsibilities.
3. Environments where Performance Management applies.
4. Measurement Criteria.
5. Reporting Requirements.
6. Performance Management Tools.
7. History files.
8. Trending Analysis.
9. Performance Management meetings.
10. Reporting and resolving Performance Management problems.
Figure 4: Performance Management Standards and Procedures Process
By following this action plan, it was possible to gather the information contained within this manual.
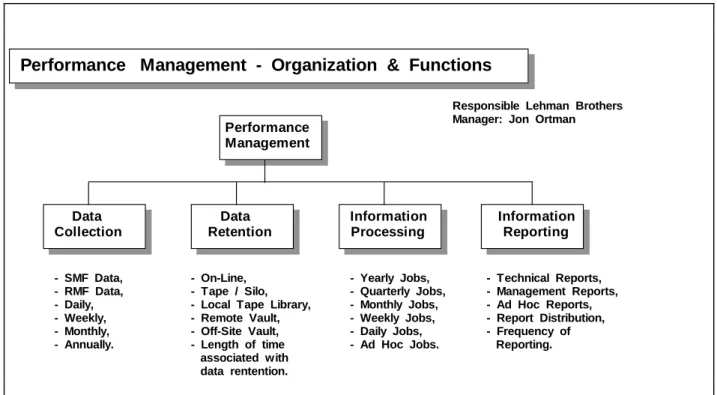
The on-going functional responsibilities of the Performance Management area are illustrated below. Performance Management Data Collection Data Retention Information Processing Information Reporting Performance Management - Organization & Functions
- SMF Data, - RMF Data, - Daily, - Weekly, - Monthly, - Annually. - On-Line, - Tape / Silo, - Local Tape Library, - Remote Vault, - Off-Site Vault, - Length of time associated with data rentention. - Yearly Jobs, - Quarterly Jobs, - Monthly Jobs, - Weekly Jobs, - Daily Jobs, - Ad Hoc Jobs. - Technical Reports, - Management Reports, - Ad Hoc Reports, - Report Distribution, - Frequency of Reporting.
Responsible Lehman Brothers Manager: Jon Ortman
Figure 5: Performance Management On-Going Functional Responsibilities
On a periodic basis, the Performance Management group performs all of the functions listed above.
Data collection is performed daily (SMF and RMF data, as well as Omegamon data). This data is then accumulated on a weekly, monthly and yearly basis for trending analysis and performance reviews.
Data retention is accomplished via local tape library, remote vaults and off-site vaults, since Performance Data is considered as a Vital Record. The length of time associated with Performance Data retention varies in accordance with the collected information. Performance information processing is performed daily, weekly, monthly, yearly, and on an ad-hoc basis when analysis of performance flaws must be accomplished, or in response to management requests.
Performance information reporting is performed in accordance with management requirements. The main purpose for performance reporting is to isolate performance bottlenecks and to demonstrate when equipment upgrades are needed.
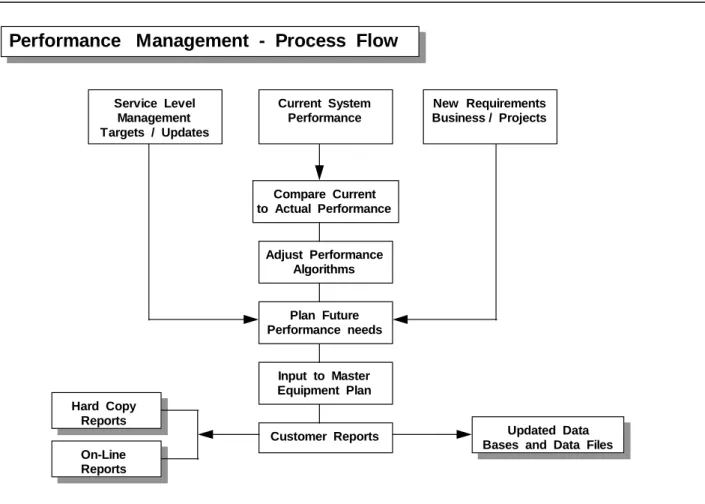
4.3. Process Flow
The flow of events associated with the Performance Management process is described below.
Performance Management - Process Flow
Service Level Management Targets / Updates Current System Performance New Requirements Business / Projects Compare Current to Actual Performance Adjust Performance Algorithms Plan Future Performance needs Input to Master Equipment Plan Customer Reports Hard Copy Reports On-Line Reports Updated Data Bases and Data Files
Figure 6: Performance Management Flow Diagram
Service Level Targets are established to judge the performance of systems and applications. The current system performance is monitored by the Performance Management group and reported to management. Management uses this information to determine if future business requirements can be met with the current performance. If not, then additional equipment is ordered to support the increased system demands, or performance flaws are repaired.
4.4. MVS Process Elements
Process elements include the individual elements necessary to successfully manage performance issues.
Analytical Activity
When a user suspects a performance problem, Performance Management personnel are notified to examine the situation and investigate the cause of the problem. An Information / Management problem record is created to record the problem and is used to track progress through resolution of the problem. OMEGAMON / MVS and RMF Monitors I, II and III may be used for diagnosis.
OMEGAMON Monitoring
OMEGAMON / MVS is the primary tool for evaluating and diagnosing overall daily system performance. OMEGAMON provides online status of the system environment through threshold exceptions and user selected queries.
RMF Reports
RMF is used to monitor and diagnose performance on the host systems. Particular attention is given to items that have exceeded the established thresholds for the systems. These items and others that are nearing their thresholds are tracked. Efforts are made to stabilize or eliminate performance problems, balance the workload, and reduce resource contention.
MVS Performance Management generates RMF reports for specific time intervals when performance problems are observed during specific time periods. These reports provide insight into system activity at the time of the problem.
SLR Performance Management
The SLR Performance Management application is used to analyze MVS performance when investigating a problem or trying to characterize workloads. Trends in utilization an performance are helpful when determining tuning recommendations. SLR is also used to assess the impact of tuning changes.
SLR SMF
The SLR SMF database is used to generate exception reports. These reports identify thresholds that have been exceeded in key areas and identify trends in key areas. The same series of exception reports run on every MVS system. However, the thresholds are modified to characterize each individual system.
RMF Monitor III
RMF Monitor III is used to quickly determine the cause of MVS performance problems. Monitor III is invoked if a problem is currently being observed or during periods of the day when daily analysis shows a problem trend. Usually the resources causing the delays can be readily identified. Some common delays identified by Monitor III are:
• Processor delays - Over-utilized or monopolized CPU • DFHSM delays - Slow recall or restore of user data • Storage delays - Excessive paging or swapping • Device delays - Contention for I/O devices
Performance Problem Reporting
When a performance problem is recognized, the performance analyst contacts the technical support staff responsible for supporting the affected subsystem. The technical support analyst and performance analyst present the problem and an accompanying action plan to the account manager and other management. Problem reporting for performance problems follows the problem management process specified for the system. Corrective actions follow the Change Management process specified for the system.
Performance Indicators
Performance indicators define the resources monitored and the acceptable thresholds necessary to meet service level objectives. Possible courses of action to correct performance problems are listed for each indicator.
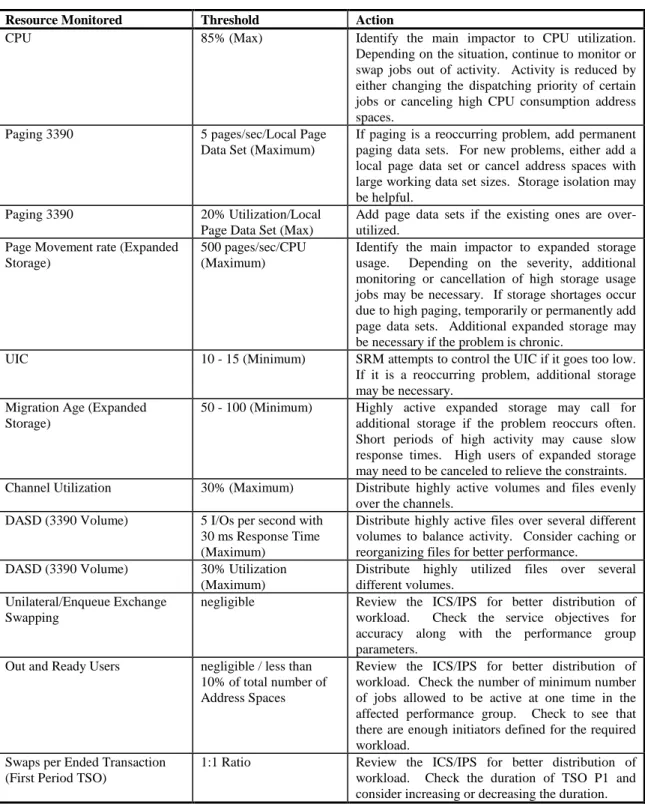
MVS Performance Indicators
The following table charts how resources are monitored by OMEGAMON. When any of the resources exceeds its threshold, the cause of the problem is investigated. The results of the investigation will determine the actions necessary to correct the problem.
Resource Monitored Threshold Action
CPU 85% (Max) Identify the main impactor to CPU utilization. Depending on the situation, continue to monitor or swap jobs out of activity. Activity is reduced by either changing the dispatching priority of certain jobs or canceling high CPU consumption address spaces.
Paging 3390 5 pages/sec/Local Page Data Set (Maximum)
If paging is a reoccurring problem, add permanent paging data sets. For new problems, either add a local page data set or cancel address spaces with large working data set sizes. Storage isolation may be helpful.
Paging 3390 20% Utilization/Local Page Data Set (Max)
Add page data sets if the existing ones are over-utilized.
Page Movement rate (Expanded Storage)
500 pages/sec/CPU (Maximum)
Identify the main impactor to expanded storage usage. Depending on the severity, additional monitoring or cancellation of high storage usage jobs may be necessary. If storage shortages occur due to high paging, temporarily or permanently add page data sets. Additional expanded storage may be necessary if the problem is chronic.
UIC 10 - 15 (Minimum) SRM attempts to control the UIC if it goes too low. If it is a reoccurring problem, additional storage may be necessary.
Migration Age (Expanded Storage)
50 - 100 (Minimum) Highly active expanded storage may call for additional storage if the problem reoccurs often. Short periods of high activity may cause slow response times. High users of expanded storage may need to be canceled to relieve the constraints. Channel Utilization 30% (Maximum) Distribute highly active volumes and files evenly
over the channels. DASD (3390 Volume) 5 I/Os per second with
30 ms Response Time (Maximum)
Distribute highly active files over several different volumes to balance activity. Consider caching or reorganizing files for better performance.
DASD (3390 Volume) 30% Utilization (Maximum)
Distribute highly utilized files over several different volumes.
Unilateral/Enqueue Exchange Swapping
negligible Review the ICS/IPS for better distribution of workload. Check the service objectives for accuracy along with the performance group parameters.
Out and Ready Users negligible / less than 10% of total number of Address Spaces
Review the ICS/IPS for better distribution of workload. Check the number of minimum number of jobs allowed to be active at one time in the affected performance group. Check to see that there are enough initiators defined for the required workload.
Swaps per Ended Transaction (First Period TSO)
1:1 Ratio Review the ICS/IPS for better distribution of workload. Check the duration of TSO P1 and consider increasing or decreasing the duration.
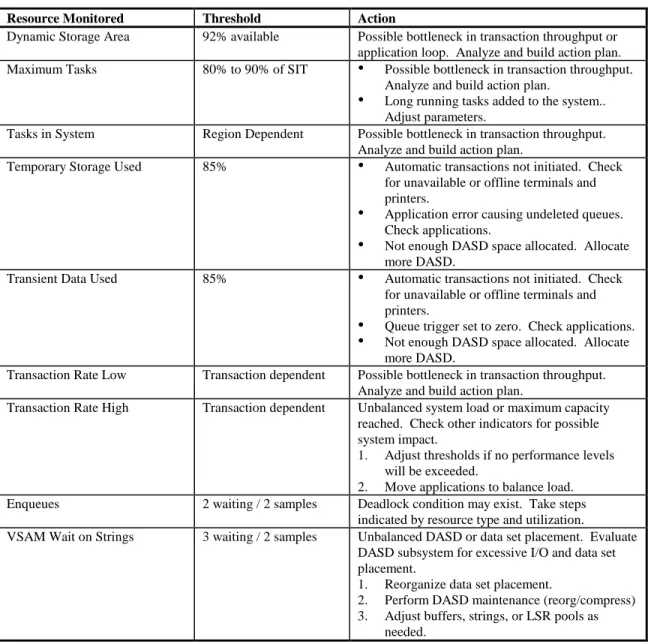
CICS Performance Indicators
The following resources are monitored by OMEGAMON. When any of the resources exceed its threshold, the cause of the problem is investigated. The results of the investigation will determine the actions necessary to correct the problem.
Resource Monitored Threshold Action
Dynamic Storage Area 92% available Possible bottleneck in transaction throughput or application loop. Analyze and build action plan. Maximum Tasks 80% to 90% of SIT • Possible bottleneck in transaction throughput.
Analyze and build action plan.
• Long running tasks added to the system.. Adjust parameters.
Tasks in System Region Dependent Possible bottleneck in transaction throughput. Analyze and build action plan.
Temporary Storage Used 85% • Automatic transactions not initiated. Check for unavailable or offline terminals and printers.
• Application error causing undeleted queues. Check applications.
• Not enough DASD space allocated. Allocate more DASD.
Transient Data Used 85% • Automatic transactions not initiated. Check for unavailable or offline terminals and printers.
• Queue trigger set to zero. Check applications. • Not enough DASD space allocated. Allocate
more DASD.
Transaction Rate Low Transaction dependent Possible bottleneck in transaction throughput. Analyze and build action plan.
Transaction Rate High Transaction dependent Unbalanced system load or maximum capacity reached. Check other indicators for possible system impact.
1. Adjust thresholds if no performance levels will be exceeded.
2. Move applications to balance load. Enqueues 2 waiting / 2 samples Deadlock condition may exist. Take steps
indicated by resource type and utilization.
VSAM Wait on Strings 3 waiting / 2 samples Unbalanced DASD or data set placement. Evaluate DASD subsystem for excessive I/O and data set placement.
1. Reorganize data set placement.
2. Perform DASD maintenance (reorg/compress) 3. Adjust buffers, strings, or LSR pools as
needed.
IDMS Performance Indicators
Resource Monitored Threshold Action
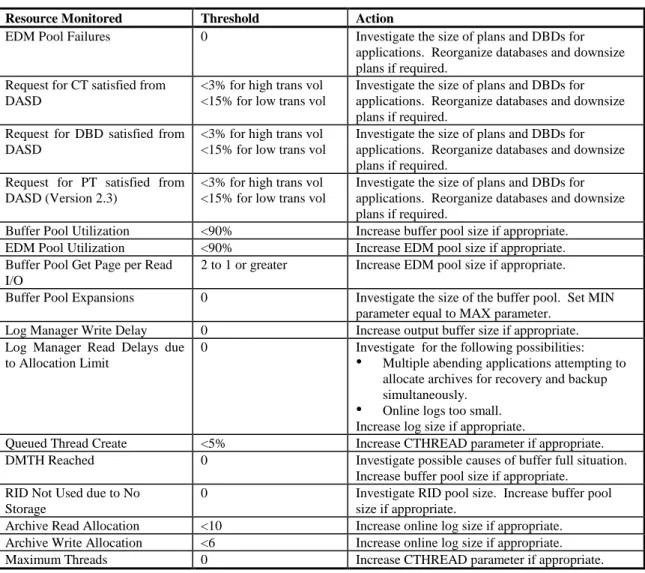
DB2 Performance Indicators
The following resources are monitored by OMEGAMON. When any of the resources exceeds its threshold, the cause of the problem is investigated. The results of the investigation will determine the actions necessary to correct the problem.
Resource Monitored Threshold Action
EDM Pool Failures 0 Investigate the size of plans and DBDs for applications. Reorganize databases and downsize plans if required.
Request for CT satisfied from DASD
<3% for high trans vol <15% for low trans vol
Investigate the size of plans and DBDs for applications. Reorganize databases and downsize plans if required.
Request for DBD satisfied from DASD
<3% for high trans vol <15% for low trans vol
Investigate the size of plans and DBDs for applications. Reorganize databases and downsize plans if required.
Request for PT satisfied from DASD (Version 2.3)
<3% for high trans vol <15% for low trans vol
Investigate the size of plans and DBDs for applications. Reorganize databases and downsize plans if required.
Buffer Pool Utilization <90% Increase buffer pool size if appropriate. EDM Pool Utilization <90% Increase EDM pool size if appropriate. Buffer Pool Get Page per Read
I/O
2 to 1 or greater Increase EDM pool size if appropriate. Buffer Pool Expansions 0 Investigate the size of the buffer pool. Set MIN
parameter equal to MAX parameter. Log Manager Write Delay 0 Increase output buffer size if appropriate. Log Manager Read Delays due
to Allocation Limit
0 Investigate for the following possibilities: • Multiple abending applications attempting to
allocate archives for recovery and backup simultaneously.
• Online logs too small. Increase log size if appropriate.
Queued Thread Create <5% Increase CTHREAD parameter if appropriate. DMTH Reached 0 Investigate possible causes of buffer full situation.
Increase buffer pool size if appropriate. RID Not Used due to No
Storage
0 Investigate RID pool size. Increase buffer pool size if appropriate.
Archive Read Allocation <10 Increase online log size if appropriate. Archive Write Allocation <6 Increase online log size if appropriate. Maximum Threads 0 Increase CTHREAD parameter if appropriate.
IMS Performance Indicators
Resource Monitored Threshold Action
IMS Pool Utilization 80% OMEGAMON MVS CSA Utilization MVS thresholds OMEGAMON
Message Queues 80% OMEGAMON
OLDS Data Sets Last one message System log
4.4.1. System Thresholds
CPU CPU utilization is tracked by Capacity Planning. Traces can increase CPU and DASD activity for the duration of the test.
Paging Paging activity on both LPARs is negligible at this time.
Storage PR/SM (Processor Resource/System Manager) manages the LPARs. Real and expanded storage are monitored periodically to ensure proper distribution. Page movements in expanded storage should not be going to auxiliary storage. Expanded storage utilization is anticipated to increase as new-to-ESA features are implemented. However, any changes toward a stressed environment should be quickly understood.
DASD All DASD is sharable but, due to system constraints, not all DASD is shared. Notable exceptions are system residence packs, JES2 SPOOL packs, paging packs and master catalog packs.
4.4.2. Application Thresholds
See ‘SYS1.PARMLIB(IEAIPS00)’ for the established application priorities. Performance groups have been established to regulate the usage of host mainframe resources under the control of MVS. These performance groups are related to initiator classes and transaction processing slots. The IPS (initialization Performance
Specification) is used to regulate resources so that Jobs and Transactions complete processing based on their established deadline, or through sufficient system Service Units.
Effectiveness Measurements
No monthly management reports are created specifically for Performance Management. Effectiveness is reported indirectly through service level attainment reporting.
4.4.3. MVS Performance Management Tools
The following tools are used by MVS Performance Management to monitor and diagnose performance problems.
Systems Management Facility
Many SMF record types, as specified by System Support, are collected to describe
various aspects of the MVS systems. The contents of each record type are fully described
in MVS/XA Systems Programming Library: Systems Management Facilities (SMF),
GC28-1153. The process of collecting and archiving the SMF data is as follows:
Collection The SMF datasets on the production MVS systems are dumped each day to generation data groups (GDGs). The collected data is used by the Performance Management measurements area for generating RMF reports and as input to the SLR (Service Level Reporter, 5740-DC3) database. The database is a VSAM dataset and the data in it is accessible in tabular form. The tables contain information on job statistics, system utilization and IPL statistics.
Archival Raw SMF data is retained for one year. SLR data tables housing yearly, monthly, daily and hourly data are retained for 45 days. SLR data tables housing yearly, monthly and daily data are retained for 70 days. SLR data tables housing yearly and monthly data are retained for 2 years. On average, SMF data will require 50 to 60 tapes per month. All tapes are stored in the data center tape library.
Resource Management Facility
RMF (5665-274) is a measurement collection tool designed to measure selected areas of system activity and present the data collected in the form of SMF (System Management Facility) records, formatted records or formatted display reports. It is used to evaluate system performance and identify reasons for performance problems. The following SMF record types are created for RMF:
Record type 70 - CPU Activity Record type 71 - Paging Activity Record type 72 - Workload Activity Record type 73 - Channel Path Activity Record type 74 - Device Activity
Record type 75 - Page/Swap Data Set Activity Record type 76 - Trace Activity
Record type 77 - Enqueue Activity Record type 78 - Monitor I Extension Record type 79 - Monitor II Activity
For a complete discussion of the capabilities of RMF, a description of the types of records collected, and examples of the reports, see MVS/Extended Architecture Resource
Measurement Facility (RMF) Monitor I and II Reference and User's Guide, LC28-1556.
RMF Monitor I
A Monitor I session is an ongoing background session of long duration that collects information about processor, channel path, I/O device, I/O queuing, workload, virtual storage, paging, enqueue contention, page and swap data set and ASM/RSM/SRM trace activities. The activities measured can be collected in the form of SMF records and printed reports.
RMF Monitor II
A Monitor II session is a snapshot session that generates a report from a single data sample. Monitor II can collect information about address space, reserve, channel path, enqueue, real storage/processor/SRM and domain activities. The report of the activities measured can be sent to a display station or generated in the form of SMF records and printed reports.
RMF Monitor III
RMF Monitor III is a facility of RMF that provides contention-oriented performance information. Information is collected about the delays users encounter when accessing system resources. Monitor III requires two sessions:
Data gatherer The data gatherer is started from the system console. It collects data, formats the data into a set of samples, and stores the set of samples in a local storage buffer and, optionally, in user-defined data sets.
Data reporter The data reporter session (invoked in TSO) retrieves the data and generates reports (both graphic and tabular) o the display screen. The RMF Monitor III reports can be sued to identify resources causing delays and system bottlenecks. The reports available from Monitor III are described in MVS/Extended Architecture Resource Measurement Facility (RMF) Monitor III Reference and User's Guide, LC28-1557.
4.4.4. Service Level Reporter
SLR (5668-966) is a program product which contains predefined tables for archiving and
reporting certain types of SMF records. These tables can be accessed either online on TSO or by reports generated by batch jobs. SLR is used to generate data for performance reports and for detailed analysis of performance problems and trending.
SLR Performance Management Application
SLR collects performance-related SMF and RMF data to a separate, performance management database. The data is kept in database tables designed specifically for performance management purposes. The data in these tables is reformatted to quantify portions of response time dependent on different system resources. Performance management dialogs (accessed on TSO) provide detailed analysis of performance problems in either graphic or tabular format. For more information on the performance management application reference Service Level Reporter User's Guide: Performance
Omegamon / MVS
The following description is quoted from the OMEGAMON/MVS Reference Manual. For more information, consult OMEGAMON/MVS Reference Manual (V710), OM53-1646-6.
OMEGAMON for MVS is a realtime software performance monitor for the MVS operating system. OMEGAMON displays information on such topics as:
• CPU utilization by address space or by performance group
• SRM parameters
• page I/O service times
• logical channel queues/control units
• I/O contention by device, control unit or channel
VSAM Listcat
VSAM listcat listings provide insight into the current status of the VASM data sets. Tuning recommendations are given to database management analysts when appropriate.
Cache Analysis Aid
The Cache Analysis Aid (5799-WXA) is a tool used to assess the benefit of placing DASD volumes behind cache control units. GTF CCW trace data is used as input to the aid. It predicts read/write ratios and read hit ratios based on different cache sizes. Performance Management analyzes this data and recommends DASD volumes to be moved behind cache storage directors. For more information on the Cache Analysis Aid, reference Sales and Systems Guide: Cache Analysis Aid, an IBM Aid Program, User's Guide.
Cache RMF Reporter
The Cache RMF Reporter (5798-DQD) reports the real cache usage statistics using SMF records. The actual read/write ratios and read hit ratios for cached DASD volumes are reported. This information is used to examine the actual usage of the cache storage directors. For more information on the Cache RMF Reporter, reference Cache RMF
DCAT
DCAT (DASD Configuration Analysis Tool) is an IBM-internal tool on HONE. The tool is used to simulate DASD configurations and predict the resulting performance. The tool is used to assess new DASD configurations or changes to existing DASD configurations.
4.4.5. Performance Management Procedures
Data Collection
Data is periodically collected from the system resources listed below. After collection, the files are combined into Daily, Weekly, Monthly and Yearly files for storage in the Local Tape Library. Whenever reports are required, the Peformance Management group will utilize the tape that contains the best profile of the information needed to produce the report (i.e., yearly trending analysis would utilize the Yearly tapes, etc.). Sometimes, these data files are reduced to only the information that is pertinent for reporting. The files are then reduced in size and stored on periodic tapes, sometimes called History or Trending tapes. SMF Data RMF Data History Trending Data Retention
Depending upon the relative importance of the information contained in Performance Files, they are stored on media that can either be accessed directly, or via manual interventions (mounts). The more important the information and its frequency of use, dictate where the information will be kept. The various types of devices that can support data retention are listed below.
On-Line DASD or Optical devices Tape / Silo
Local Tape Library Remote Vault Off-Site Vault Retention Time
Information Processing
Periodically, Performance Management jobs are submitted to the Host for processing of performance information and the generation of reports. The output from these Jobs is used to inform management and technical personnel of the systems operation and to isolate any performance flaws that need to be addressed. The submission of these performance jobs is accomplished to match a schedule like the ones listed below.
Yearly Jobs Quarterly Jobs Monthly Jobs Weekly Jobs Daily Jobs Ad-Hoc Jobs Information Reporting
The output of the performance job is used to generate one or more of the reports listed below.
Technical Reports Management reports Ad-Hoc Reports Report Distribution
4.4.6. Standards and Guidelines
Performance measurement standards and guidelines are described in this section. Measurement Criteria
The criteria by which performance is measured depends upon the type of component being measured. Hardware, software, applications and communications are all judged to a different criteria, but all are judged to expected service delivery levels agreed upon by Technology Operations and the Business User. Business User service levels are
documented within a Service Level Agreement (SLA) and measurement criteria is developed through Service Level Reporting (SLR). Until SLA/SLR procedures are implemented, the performance measurement criteria is based upon the indicators listed below.
Expected Service Delivery Levels, including: - System Performance,
- Hardware Performance, - Batch Schedules, - On-Line Transactions,
- Communications Response Times, - Job Turnaround Times,
- Also see Performance indicators listed in figures 7-11 of this document.
Trending Analysis
A comparison of performance samplings is performed when creating performance trending analysis reports. These reports can be based on an hourly through yearly basis and are created from performance information contained on tape, cartridge, or dasd volumes.
Trending indicators include: - Hardware performance, - System performance,
Performance Drivers
Performance Drivers are indicators used as guidelines by which performance is judged. Sometimes called Business Forecasting units (BFU’s), these indicators are used to relate system performance to the products and services supplied by a business.
The resources and services associated with Performance Drivers can be used to develop product prices or for generating charge-back algorithms. Profit margin calculations must utilize Peformance Driver information as the data processing needed to support business services and products.
Some Performance Drivers are:
- Number of User Id’s defined for a business unit, - Amount of resources owned by the business unit, - Computing service units utilized by the business unit, - Average response time associated with the business unit, - Batch Job Turnaround times for the business unit,
- Communications devices and response times for the business unit, etc...
Resource Utilization Charts
Performance Management reporting must include resource profiles that can be used to determine the relative performance of a resource as compared to the overall performance of the installation and to other components of the same type. These Resource Utilization Charts are used to isolate poorly performing components that may be referred to the vendor for maintenance.
An example of how resource Utilization Charts can assist problem and performance management personnel is when all tape drives are compared and one stands out as a poor performer because of data checks. Since data checks occur only after retries (40 Read Retries aand 15 Write Retries), this tape drive will exceed resource utilization guidelines. Problem resolution will correct the data checks and resource utilization charts will
validate that the device is performing correctly. Another use of resource utilization charts is when tape drives from multiple vendors are compared to determine which vendor’s tape drive is the best performing. These tests are normally performed before purchasing vendor products.
For the most part, resource utilization charts are used to compare device operations and for planning the placement of data to impact processing performance.
LPAR Performance Profiles
Each LPAR is configured differently, but comprised of the same basic elements (just some LPAR’s have more or less of the elements). The performance profile of LPAR’s is therefore based on the performance of the elements that are used to construct the LPAR. For example:
CSTOR, ESTOR,
Allocated MIPS, CP’s defined,
Number of Parallel Channels, Number of ESCOn Channels.
In addition to the configuration of an LPAR, the type of work performed in the LPAR must be considered when formulating LPAR Performance Profiles. For example, the number of Batch Initiators, the Data Base used to support on-line systems (i.e., DB2, IDMS, IMS, ADABAS, etc.), the System (i.e., MVS/XA, VM/XA, etc.), Subsystem (JES2, TCAM, VTAM, VSAM), and the Applications running in the LPAR.
Once formulated. performance trending analysis should be conducted to monitor how LPAR performance is affected by changes and workloads. After a period of time, the LPAR Performance Profiles will be tailored to meet specific requirements.
Performance Reviews
The various types of Performance Reviews that are conducted are described below. They are:
Periodic management meetings
Weekly Performance Reviews are conducted between the Performance Manager, members of the Systems Support group, and other technical and managerial areas. These meetings are used a forum to review overall performance and uncovered performance flaws that impact system and/or application operation.
Whenever the capacity and/or performance of a particular piece of equipment exceeds its service levels, the Performance Manager will formulate a recommendation for the purchase of new equipment, or an upgrade of existing equipment. Should the
utilization of equipment be below projected levels, the Performance Manager will raise the issue and request management to determine if the equipment is really needed.
As a result of these periodic reviews, equipment is either acquired, redeployed, or terminated. When equipment changes do occur, the Inventory and Configuration Management disciplines must be envolved.
Emergency performance review meetings
Whenever a performance problem or bottleneck is identified that impacts mutiple users or the ability to achieve expected service deliveries, an emergency performance review meeting is conducted. Prior to the meeting, the Performance Manager will generate Performance Reports detailing the performance exception. These reports are reviewed at the meeting and used to formulate decisions going forward. After the decisions formulated at the meeting are implemented, the original reports are used to compare performance results against. The comparison is used to validate the decision and actions taken as a result of the emergency performance review.
Another reason for an emergency performance review is to validate the ability to support newly aquired workloads, which can be experienced when a company signs a large contract or acquires another firm (or its business).
Performance Problem Reporting
When a performance problem is recognized, it is reported to the Global Systems Help Desk and a problem incident opened under the Apriori Problem Management System. Performance problems can be reported by Businss Users, Technology Operations, or the Applications Development area. Whenever a performance problem is reported, it is assigned to the Performance Manager for resolution.
The Performance Manager is responsible for analyzing, and resolving the
performance flaw. Upon resolution, the problem incident record will be updated and the problem
reporter notified of the solution. The problem reporter must accept the resolution of the problem before the problem record can be closed.
Sometimes performance problem resolutions require the changes to the environment, either through equipment changes, or reconfigurations. When this occurs, the
problem will remain open until the changes have been made and the problem reporter accepts the problem solution. When accepted by the reporter accepts the solution, the problem can be closed.
4.5. Roles and Responsibilities
The Performance Management department monitors data processng operation and ensures that expected service delivery schedules are not interfered with. The department is manned by, or interfaces with, the roles and responsiblies listed below.
4.5.1. Discipline Owner
The Performance Manager is responsible for:
Ensuring the effectiveness of the Performance Management process.
Collecting performance threshold requirements (high and low acceptable performance ranges) from all areas having a need for performance measurement.
Ensuring that the tools needed to monitor and report on performance are installed and operational.
Coordinating the training of Performance Management personnel.
Implementing reporting mechanisms that measure adherence to performance thresholds for systems, subsystems, and applications.
Ensuring that Performance Reports are created and distributed to management and technical personnel.
Identifying and correcting performance problems.
4.5.2. SMC Account Coordinator
The account coordinator has the following responsibilities:
• Accountable for the effectiveness of the Performance Management process.
• Represent the Performance Management discipline at all SMC formal and informal reviews.
• Prepare monthly reports showing trends and analysis for management. • Promote open communication with all involved in the process.
• Maintain and review the Performance Management Process Guide and procedures. • Develop and execute plans for process upgrades as necessary to meet requirements
identified in the formal Systems Management Controls discipline review. • Perform the SMC Self Assessment for Performance Management.
4.5.3. MVS Performance Analyst
• Monitor performance of all MVS-based systems.
• Collect measurement data about MVS systems while they are running. • Establish performance thresholds for the MVS systems.
• Detect performance problems and recommend solutions.
• Evaluate new project requirements and phase review documentation for performance considerations.
• Adhere to the Problem Management process when reporting or resolving problems. • Adhere to the Change Management process when implementing and reviewing
changes that could affect performance.
4.5.4. LAN Performance Analyst
• Monitor performance of all LAN-based systems.
• Collect measurement data about LAN systems while they are running. • Establish performance thresholds for the LAN systems.
• Detect performance problems and recommend solutions.
• Evaluate new project requirements and phase review documentation for performance considerations.
• Adhere to the Problem Management process when reporting or resolving problems. • Adhere to the Change Management process when implementing and reviewing
4.5.5. MVS Systems Support Programmers
MVS Performance Management depends on MVS system support programmers to: • Install and maintain the tools necessary to perform the MVS Performance
Management function.
• Contribute to and implement the recommendations of the MVS performance analysts.
4.5.6. Application Development Programmers
MVS Performance Management depends on the application development programmers to:
• Provide requirements documents and phase exit documentation for all new projects in order for Performance Management to evaluate performance requirements.
4.5.7. Data Storage Management Analyst
MVS Performance Management depends on the storage management analysts to: • Move data sets and database files to improve performance.
• Maintain data sets and database files to maximize space utilization. • Move DASD volumes to improve performance.
4.5.8. Performance Management Analyst
The Performance Management Analyst is responsible for: Monitoring performance on a daily basis.
Identifying and reporting performance flaws. Resolving performance problems.
Recommending acquisition, redeployment, and termination of equipment. Recommending the reconfiguration of equipment and system parameters.
4.5.9. System Support Programmers
The Performance Management department is dependent upon System Support Programmers to:
Install and maintain tools necessary to support the Performance Management function outside of the MVS arena.
Contribute to and implement the recommendations of the Performance Management department.
Provide feed-back on performance reporting.
4.5.10.User and Customer Representatives
User and Customer Representatives interface with the Performance Management department by:
Providing configuration information about the area they represent. Establishing performance thresholds.
Attending periodic performance review meetings.
Notifying the Performance Management department of any planned configuration alterations or workload changes.
Coordinating performance information and activities between the Performance Management department and their areas.
4.6. Process Evaluation
The Performance Management discipline contributes to the attainment of service level objectives by effectively managing system resources that impact the delivery of service. This is accomplished by ensuring standard methods and procedures are in place to minimize the impact of problems and to reduce the number of failures to an acceptable risk at an acceptable cost.
4.6.1. Annual Self Assessment
A review of the Performance Management process is conducted annually. The results are analyzed for effectiveness and a copy of the results and the analysis is forwarded to the Business and Service Analysis manager.
4.6.2. Purpose
The purpose of self assessments is to measure the Performance Management process for effectiveness and attainment of objectives, to review these objectives and how they support the overall SMC and I/S objectives, and to recommend improvements for the process.