4.1
Introduction
This guidance note is intended to provide you with information on the tools which are available to help you review and authorise your data to Level 30 for National Level 1 validation.
When you first start entering data your return will be at Level 0. It then goes through several levels of checking and authorisation.
•
Level 0 – Data input or amendment taking place.•
Level 10 – Data has been rolled up into a quarterly submission.•
Level 20 – Data approved by Data Entry user and ready to be reviewed by Data Administration user (also referred to as the Data Administrator or “Admin user”) at LA.•
Level 30 – Data reviewed and validated by Admin user. Data submitted for National Level 1 validation. At this stage the data leaves the direct control of the LA and moves to the WDF team for checking. It can be reopened for amendments.•
Level 35 – Data validated by National Level 1 users. Data ready to move to the Environment Agency (EA) and Defra for final validation prior to statistical release.•
Level 40 – Data validated and ready for statistical release.Once you have completed all applicable questions in the Data Entry section and are satisfied that the data is accurate, you will need to roll the return up. The roll-up process aggregates your data into a quarterly return, taking it from Level 0 to Level 10. To roll up your data, select “Data Rollup” from the Data menu bar. If all the required questions have been completed you will see “Rollup Data” next to the quarter you are authorising. Click this and “Ok” when prompted. Section 3 of the WDF system manual gives more details of the data entry and roll-up process.
Once your return has been rolled up to Level 10, you will need to check and authorise it for review by your Data Administration user. This is done via the Data Authorisation page. The Data Authorisation page contains a number of links and pieces of information which can help you to check various aspects of your data. You are also able to view your historical data returns and monitor progress against various indicators and targets.
The key functionality and tools which are available on this page to help validate your data are listed below.
1) Audit Log (+);
2) Question Link (Ques); 3) Validation Report (Summ);
4) Performance Indicator Report (PI); 5) Mass Balance Report (MBal); 6) EA Report (EA); and
7) Accept/Reject data ( ).
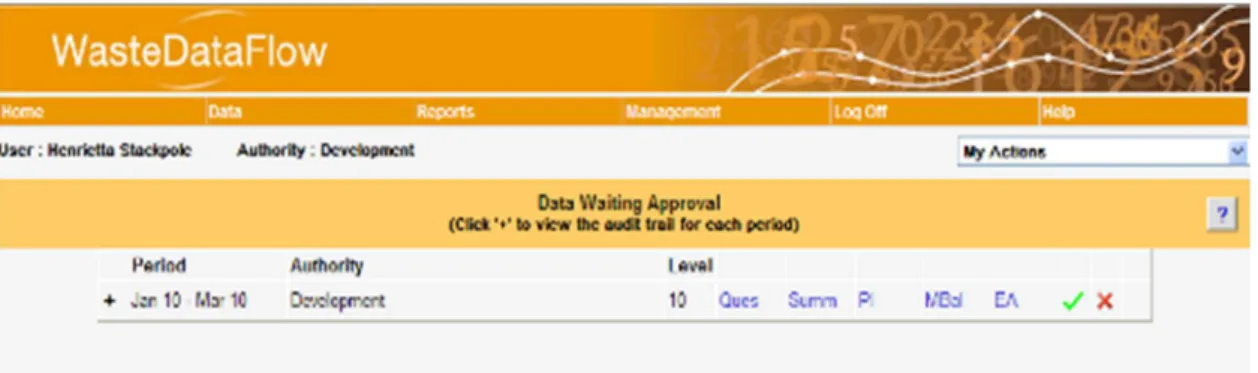
Figure 1 The Data Authorisation page
You will be able to view your return on the Data Authorisation screen once you have rolled the data up to Level 10 for the first time. If you subsequently have to reject the data, this return will disappear from the default view (“My Actions” – see the drop-down list at the top right of the screen) until the return is back at Level 10. You are still able to view the data, by selecting your authority from the drop-down box (as opposed to showing “My Actions”); however, the information contained within the Question, Summary, PI, MBal and EA links will not be updated until the data has been rolled back up to Level 10 – i.e. there is no function on this page for the ‘live’ update of data.
The functions and tools which are available to you will depend on your authority type and country. These are set out in the table below.
Figure 2 Availability of functions and tools for data validation
Feature England Scotland Northern
Ireland
Wales WCA WDA UA
Questions Review (Ques) Validation Summary (Summ) Performance Indicators (PI) Mass balance (MBal) EA Validation (EA)
4.2
Returns Drop-down
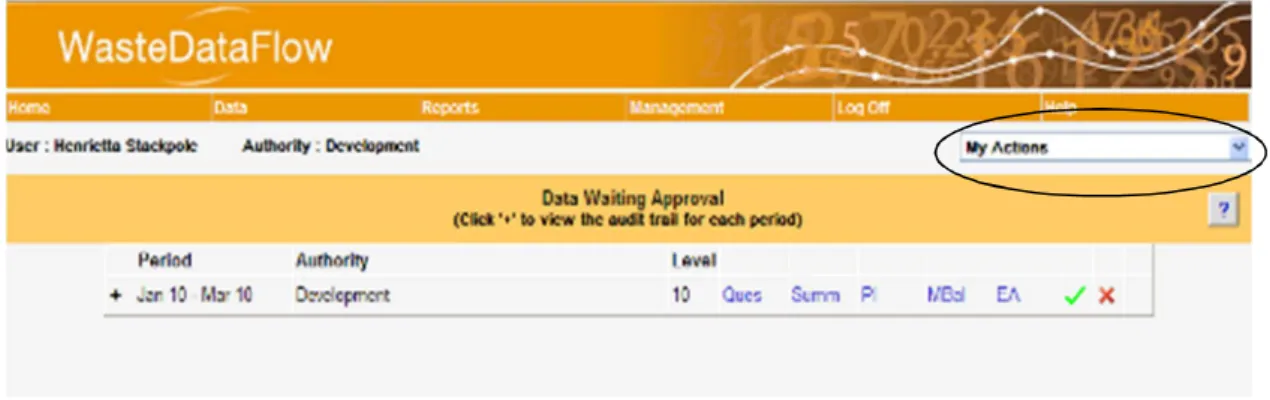
When you navigate to the Data Authorisation page a list of your current authorisation actions will display as a result of the drop-down displaying the “My Actions” option.
Figure 3 Return Drop-down option – My Actions
Returns awaiting your action will differ depending on your user level. A Data Administrator will see any returns at Level 20 when the drop-down is set to “My Actions”. A Data Entry user will only see returns at Level 10 under “My Actions”. (Note that in some authorities a user might be set to be both a Data Entry user and a Data Administrator; in this case the user will see returns at Levels 10 and 20 on this screen.)
To view returns outside your current actions you can select your authority from this drop-down (the drop-down will display all the authorities for which you have authorisation rights). This allows you to:
•
View historic returns. This can be useful if you wish to revisit old returns for anything from trend analysis to reviewing how you entered data into a question last quarter to make sure your current return is consistent.•
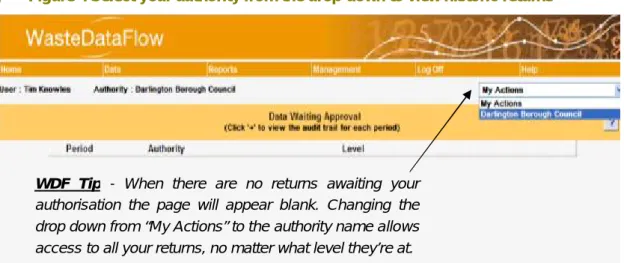
View rolled-down returns. Once a return is rolled down it will disappear from the default, “My Actions”, view of the data authorisation page. You can still gain access to this return by selecting your authority from the drop-down. Please note that the data held in Data Authorisation for each return only updates each time the data is rolled up to level 10. Therefore the data visible here at Level 0 will relate to the last time it was at Level 10, so to view the impact of any changes you will need to roll the data back up to Level 10 again.Figure 4 Select your authority from the drop-down to view historic returns
4.3
The Audit Log
The Audit Log on the Data Authorisation screen displays a log of the movement of the data from Level 10 through to Level 40. The Audit Log can be accessed by clicking on the small + symbol located at the left-hand end of the bar.
Figure 5 Audit Log + Symbol
Clicking on this will expand the bar to show a log of when data has been rolled up or down, by whom and when this took place. It will also record whether any questions have been changed.
WDF Tip - When there are no returns awaiting your
authorisation the page will appear blank. Changing the drop down from “My Actions” to the authority name allows access to all your returns, no matter what level they’re at.
Figure 6 Audit Log
The above example shows that when the data was rolled up and authorised, Qu17 in March had been updated.
WDF Tip – The first time data is rolled up to Level 10 no ‘questions changed’ information will be displayed as all questions will have been completed for the first time.
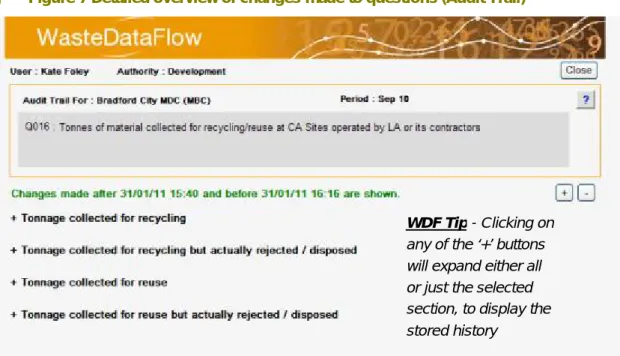
If you click on the question number (17 in this example) a new page opens where you can review in greater detail what changes have been made, including what the data was previously and what it has now been changed to.
Figure 7 Detailed overview of changes made to questions (Audit Trail)
You can access the details of the data amendments by clicking on any of the + buttons. This will open up a table which highlights the category, the old data, the new data, when the data was entered and by whom it was entered. This is useful to provide a quick overview of data amendments, and also to track who has been making updates on the system.
WDF Tip - Clicking on
any of the ‘+’ buttons will expand either all or just the selected section, to display the stored history
Further details on how to use this functionality to validate your data are available in section 3.6 of the WDF Systems Manual. This is available to download from the WasteDataFlow website.
4.4
Period, Authority and Level
The three headings Period, Authority and Level provide details on the return which you are authorising.
•
Period – Indicates the quarterly or annual period for which the return is being authorised.•
Authority – Indicates the authority for which the return is being authorised. In the vast majority of cases this will simply be the authority that you work for. However, some users from WDAs may have authorisation rights for a number of their WCAs and as such could find themselves with multiple authorities displayed.•
Level–
Indicates the current authorisation level of the data e.g. Level 10, 20, 30, 35 or 40. By default the page displays the returns which are currently awaiting an action from you (“My Actions” will be displayed in the drop-down at the top right of the screen). Therefore, for a Data Entry user only returns at Level 10 will be shown by default under “My Actions”, whereas a Data Administrator user will see returns at Level 20 displayed.4.5
Data Review Links
The Data Authorisation page includes a series of tools to help you validate your data returns.
Figure 8 Data review links
These include the following:
•
Questions (Ques) – this allows you to view each question in a quarterly return.•
Summary (Summ) – this validation report provides an overview of your data to highlight data entry errors, identify anomalies based on previously entered data and identify in advance queries likely to arise during the validation process.•
PI – (England, Northern Ireland, Wales) Performance Indicator report provides an overview of current PI performance e.g. NI191, 192, 193 and BVPIs (England), WMT (Wales) and KPIs (Northern Ireland).
•
Mass Balance (MBal) (England, Northern Ireland, Wales – WDA/UA only) –provides an indicative mass balance report to give an indication of the authority's LATS (England)1 or LAS (Northern Ireland and Wales) performance.
•
EA (England – WDA/UA only) – provides a series of checks relating to specific questions which are used by the EA as part of their data validation.Question Link (Ques) 4.5.1.
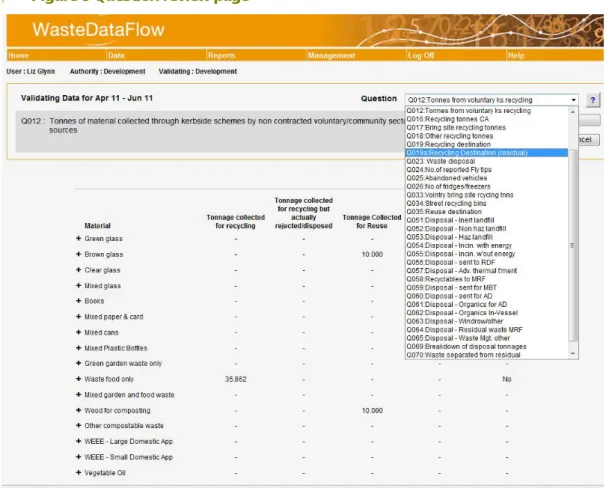
By clicking on the Ques link you will be taken to a page which looks much like the Data Entry section. The period you are reviewing will be determined by the period of the Ques link you have clicked, and this period will be displayed at the top of the page ‘Validating Data for....’. The question drop-down will then allow you to navigate through the questions and your data will be presented as a quarterly figure.
Figure 9 Question review page
1
In England the Landfill Allowances and Trading Scheme (LATS) began on 1 April 2005 and ran until the end of the 2012-13 scheme year with conclusion of trades on 30 September 2013.
Validation Report (Summ) 4.5.2.
This section focuses on the English validation report. For details of the validation report used by other regions please consult local guidance, available to download from the WDF website.
The summary link (Summ) should be your first point of call when validating your data. Only a brief introduction to this tool will be provided here as more detailed guidance is available in the Guidance Note GN62: How to Use the Validation Spreadsheet, which is available for download on the Guidance web page.
Clicking on the ‘Summ’ link will generate an Excel spreadsheet (see example below), containing five worksheets (tabs):
•
Material summary;•
Cross-check summary;•
Points to check;•
Tonnage breakdown; and•
Comments.The first two tabs present data which has been cross-checked internally either with other data in the same return or against your authority’s data in the same quarter of the previous year. Differences and discrepancies are highlighted by orange cells reading CHECK. Where these occur you should check your data and either make adjustments or make sure there is a comment for that question, and/or any related questions, which address the issue flagged.
WDF tip: Hovering over the red triangle found in the top right-hand corners of some of the cells will provide you with further information on the data that is being compared or checked.
The “Points to check” tab contains a list of automatically generated questions based on any checks that have been highlighted in orange on the “Materials Summary” and “Cross-check Summary” tabs as well as other general queries. During the validation process the WasteDataFlow team will attempt to address these queries using information provided in the questions’ comments (as listed in the “Comments” tab) and in your responses to queries relating to previously validated data. Where a suitable response is still required, the WDF team will contact you.
WDF tip: You can copy and paste these questions with your responses or additional information (or send the annotated tab as an attachment) and email them to the WDF team after your data has been authorised to L30.
The “Tonnage breakdown” tab provides a list of the 67 materials that you can report as being collected (in questions 10, 11, 12, 14, 16, 17, 18, 33 and 34) and sent for recycling or reuse in questions 19, 19a and 35. It provides details of tonnages reported against each material in each of these questions including tonnages rejected. It also shows the number of households for each material reported in Qu10 (household kerbside collections).
The “Comments” tab collates your comments for the current return and the same quarter of the previous year.
Performance Indicator Report 4.5.3.
This section focuses on the English PI report. For details of the PI reports used by other regions please consult local guidance.
To access the Performance Indicator report click on the ‘PI’ link on the Data Authorisation page. As with the validation report, the PI report generates an Excel workbook containing a number of different tabs, namely:
•
NI191 Detail;•
NI192 Detail;•
NI 193 Detail;•
BVPI82a Detail;•
BVPI82b Detail;•
BVPI 82c Detail;•
BVPI 82d Detail;•
BVPI 87 Detail; and•
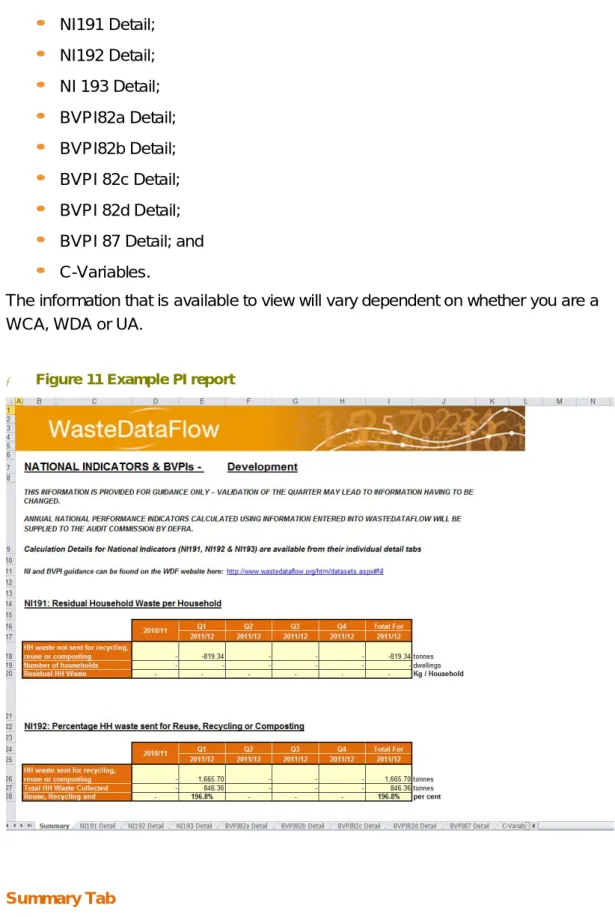
C-Variables.The information that is available to view will vary dependent on whether you are a WCA, WDA or UA.
Figure 11 Example PI report
Summary Tab
The “Summary” tab will be displayed by default when the workbook is opened. It contains a number of tables, each relating to a different National Indicator or BVPI. A detailed overview of how the BVPIs are calculated is provided in the PI reports and
this is made available in the separate BVPI tabs with reference to the “C-Variables”2 tab. Further details on the National Indicator calculations can be found in the Guidance note, which is available to download from the WDF website.
The indicators that are displayed will depend on the type of authority the report is being run for. This is highlighted in the table below.
Figure 12 BVPI and NI Reports
Indicator Authority Type WCA WDA UA NI191 NI192 NI193 BVPI82a BVPI82b BVPI82c BVPI82d BVPI 84a BVPI 84b BVPI86 BVPI87 BVPI91a BVPI91b
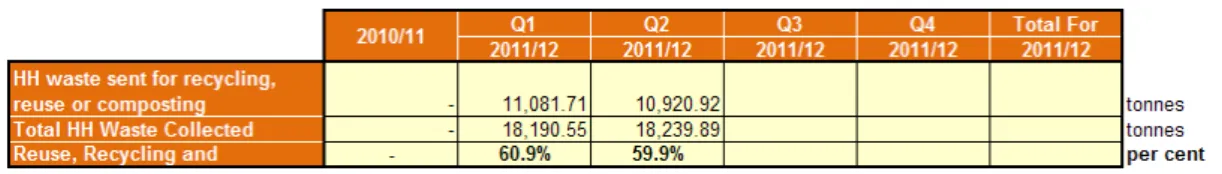
For the majority of indicators the table shows a quarterly as well as an annual figure. In situations where not all quarters have been completed during the year for which the report was generated, a year-to-date figure (totalling the data currently available) is shown in the annual column. Where available, annual data for the previous year is also displayed. The figures shown on this tab are populated from those held on the “C-Variables tab” (see below).
Figure 13 NI 192 table example
2
The term “C-Variables” is short for “calculated variables”, as described later (see page 13). These “building blocks” for reports are also sometimes referred to as “C-Vars”.
WDF Tip – These reports should be reviewed in conjunction with the NI and BVPI guidance which is available to download from the WDF website. As the values for the PIs are ultimately based on the data entered into WDF, it can be worth comparing these figures with any in-house PI calculators you may use, as a further validation check to ensure the data entered into WDF is complete.
NI & BVPI Detail Tabs
These tabs give a detailed breakdown of how the relevant NIs and BVPIs are calculated, showing how the numerator and the denominator for each break down into their component parts, referred to as c-variables. The details of each c-variable are provided in the “C-Variables” tab (see below).
WDF Tip - These reports should be reviewed in conjunction with the NI and BVPI guidance notes, available to download from the WDF website, and cross-referenced back to any in-house NI and BVPI reports as a further validation check.
Figure 14 Details Tab
C-Variables
The performance indicators available in the PI download are based on multi-stage calculations, which transform the raw data you enter into WDF into the single values displayed on the “Summary” tab. Each step in these calculations produces a figure which then feeds into the next. These intermediate steps are referred to as ‘calculated variables’, which you will usually see shortened to Variables’ or ‘C-Vars’.
Each C-Var used by WDF is given its own unique identifier in the format C1, C2, C3 etc. There are also different levels of C-Var, depending on where the numbers used to create it came from. The following bullets and examples have been selected to provide a guide to these levels and to highlight how C-Vars are used to establish the PI numbers.
•
Base – Some C-Vars are calculated directly from the raw data entered intoWDF. For example C17 is the total household residual waste collected in Qu23.
•
Secondary – Secondary C-Vars aren’t created directly from raw data but instead are formed from a calculation containing Base C-Vars. For example C205 = C17 + C21, (C205 is then used as the denominator for BVPI 82a).•
Tertiary – There are also a small number of C-Vars which are based onSecondary C-Vars. For example C301 = C201 / C205, (In this example C301 is actually the figure for BVPI 82a).
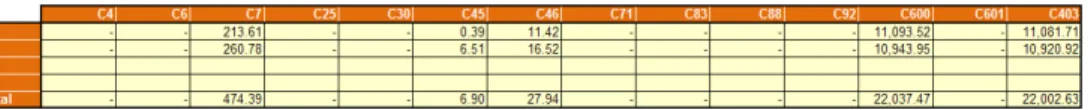
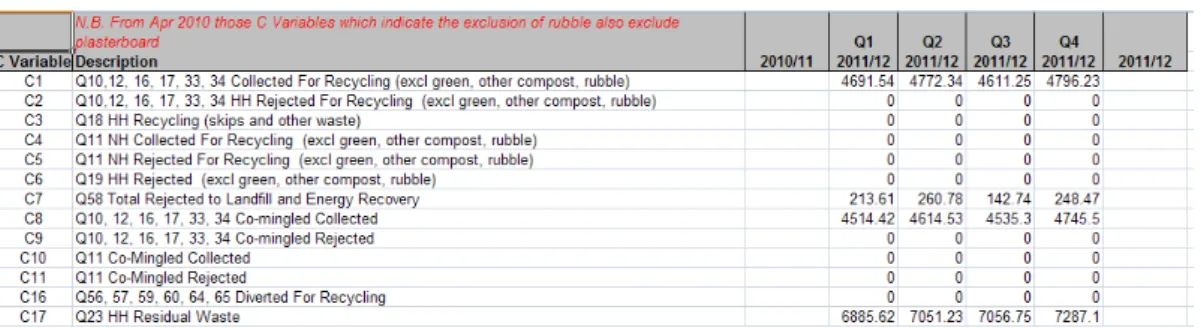
A simple way to think of C-Vars is as ingredients in a recipe. As mentioned the details of how the C-Vars have been calculated is provided in the “C-Variables” tab of the PI report. The layout of this tab is provided below, along with a description of what is contained within each row and column.
Figure 15 C-Variables Tab
•
Column A – lists the C-Var identifier e.g. C1, C2, C3.•
Column B – provides a description of how the C-Var is generated. In most cases this description gives a breakdown of the questions that the tonnages/data have been taken from.•
Column C – where available this provides the annual figure for the previous year’s performance in relation to the associated C-Vars.•
Column D – G – provides the data calculated for each C-Var for that quarter.•
Column H – where applicable this provides the annual figure for the currentreporting year’s performance in relation to the associated C-Vars.
The C-Vars in themselves can provide interesting indicators, allowing you to drill down into the overall PIs to identify which specific areas may be performing better than others. They also allow for any discrepancies identified in the PI figures to be more easily tracked back to identify where they may have arisen.
Mass Balance Report 4.5.4.
The Mass Balance report is only available to WDAs and UAs and can be accessed from the Data Authorisation page by selecting the MBal link against the period for which you want to run the report. The report provides an indication of the LATS (England)3 or LAS (Northern Ireland and Wales) mass balance calculation for the quarter selected i.e. the amount of Biodegradable Municipal Waste Landfilled (BMWL).
The report is downloaded as an Excel spreadsheet and for UAs it only contains one tab, the “Summary” tab. WDA reports include a “Summary” tab (total figures), and separate tabs for the WDA and each of their WCAs showing a breakdown of their recycling tonnages, which contribute to the overall total of BMW diverted from landfill. WDF Tip – Details of how the various aspects of the mass balance calculation are calculated can be found in the WDA and UA Mass Balance Guidance notes, available to download from the WDF website. These notes explain which questions and assumptions are used to generate the different components of the MBal report. When reviewing the mass balance report, it is important to note that the mass balance calculation is designed to give an indication of an authority's LATS performance. The accuracy of the calculation is dependent on the quality of the quarterly data which has been reported. The calculation is available once entered data has been rolled into a quarter (Level 10) and so can be used on unvalidated data. There is a risk associated with using the output figures from mass balance for any purpose other than as an estimate of performance.
Figure 16 The Mass Balance Report4
As can be seen in the example above, the summary page of the mass balance report contains three key aspects:
1. Materials Summary;
2. Indicative Mass Balance Report; and 3. Data Status.
The key features of these aspects are detailed below. Materials Summary
The Materials Summary is provided at the top of the “Summary” tab (section 1 in Figure 15). This presents an overview of the tonnages, by material type, that are diverted from landfill in any given quarter, for both source-separated recycling/ reuse
4
NB. The Materials section in Figure 16 has been shortened to enable a screenshot to be taken; all 67 categories will be present on any sheet you produce.
1
2
and recycling extracted from the residual waste stream (e.g. recycling extracted from an MBT process).
Figure 17 Material Summary Section
•
Column B – lists the various material types.•
Column C, D and E – detail the tonnages of source-separated materials and commingled materials collected for recycling and subsequently rejected at the point of collection.•
Column F and G – provides the tonnages which are sent for recycling from the source-separated materials and commingled materials collected (i.e. net of total collected minus rejected at point of collection) and subsequently rejected at the gate of or by the reprocessor.•
Column H and I – provides the tonnages of materials which are extracted from the residual waste stream and subsequently recycled or rejected at the gate of or by the reprocessor.•
Column J – this is the sum of columns F – G + H – I. I.e. the total waste diverted from landfill through recycling.The reuse section of the material summary section is similar to the above. However, it does not include a section for materials extracted from the residual waste stream. Each material type has an associated biodegradability factor, and the total of each material which has been diverted from landfill is multiplied by the biodegradability factor to give the total biodegradable content of the diverted waste for that period.
Indicative Mass Balance Calculation
The mass balance calculation is used to generate the amount of Biodegradable Municipal Waste Landfilled (BMWL) based on the following calculation:
Figure 18 The Mass Balance formula (Shorthand)
BMWL
= (LD x RB%) + (LTH x 0) + (LMBT x (RB% x MBTAF))
+ (LOT x RB%) + (DivR x RB%)
This can be expanded to:
Figure 19 The Mass Balance formula (Expanded)
BMWL
= (Directly Landfilled MSW x RB%) + (Landfill after Thermal Treatmentx 0)
+ (Landfilled after MBTx (RB% x MBT Reduction factor)) + (Landfilled after Other Treatment x RB%)
+ (Rejected diverted x RB%)
As highlighted in section 2 of Figure 15 above, the Mass Balance report provides a step-by-step breakdown of this calculation for your LA for the period selected.
You should always refer to the UA and WDA Mass Balance Guidance notes (available to download from the WDF website) to understand the questions and assumptions that are used to generate the different components of the MBal report. Data Status
Section 3 of Figure 15 highlights the status of the data, which is used to generate the mass balance report.
Figure 21 Data Status
When producing a report for a UA there will only be that authority shown here and it is likely that you will be familiar with the status of the data that you are viewing. However, if you are producing a report for a WDA it will also source data from the constituent WCAs. It may be that you as the WDA have authorised your return to Level 30, but one or more of your WCAs has yet to reach that point. Incomplete WCA data will obviously impact on the calculation and so it is always worth checking this section of the report to ensure the data is complete and validated.
EA Report 4.5.5.
The EA validation report is used by the Environment Agency to perform a number of data checks on an authority’s return prior to it being rolled up to level 40. The report reviews the tonnages, rejections and final destinations from the following key questions: Qu19, Qu23, Qu56 -65, Qu58 and Qu61 to 63. If you are reviewing a WDA EA report, the data in Qu19 and 23 will be broken down by WDA and its constitute WCAs.
The EA report isn’t primarily designed as a validation tool in the same way as the others mentioned in this guide, but the data held within it can provide you with useful data summaries and so has been made available to you.
WDF Tip – As with the MBal report as covered in section 4.5.4, a WDA’s report will include data from its constituent WCAs and it is therefore important to be aware of the status of the WCA data (e.g. some may only be at Level 10 or not yet present at all). No status indicator is provided within the EA report and so the MBal status indicator should be consulted.
Figure 22 Example EA Report
4.6
Accept / Reject data
Once you have carried out validation checks on your return you will need either to confirm that the data is correct and approve it to the next level (Level 20/30) or, if you have noticed discrepancies and need to update your data, to roll the data down to amend it. This can be achieved by the use of the green tick or the red cross at the end of the period’s row on the Data Authorisation screen.
WDF Tip – These options will only be available to you on returns which currently require your action. For a Data Entry user this will be any returns at Level 10, or for a Data Administrator this will be any returns at Level 20. If you have authorised a return to Level 30 but wish to make amendments to it, you will need to contact the WDF helpdesk to request it be rolled down.
Figure 23 Accept or Reject your data
To approve your data select the green tick . Clicking the green tick as a Data Entry user will start a process which authorises the data to Level 20, but clicking the tick as an Administrator user will take the data to Level 30.
When the green tick is pressed you will be taken to one last confirmation page which contains some high-level comparison checks to the data entered for the same period last year.
Figure 24 Data waiting approval
If you are happy the data is correct click “Approve”. Otherwise click “Cancel” to return to the data authorisation page without moving the data to Level 30.
WDF Tip – If you are rejecting data from Level 20 you will need to click the red cross once to go down to Level 10 and then again to go back to Level 0.
So now you know how to validate and authorise your data to Level 30 for National Level 1 validation. The next section of the WDF system manual looks at producing reports.