Improving the Performance of Online Auctions
Through Server-side Activity-Based Caching
Daniel A. Menasc´e1
and Vasudeva Akula2 1 Department of Computer Science, George Mason University
Fairfax, VA 22030, USA [email protected]
2 The Volgenau School of Information Technology & Engineering
George Mason University Fairfax, VA 22030, USA
Abstract. Online auction sites have very specific workloads and user behavior characteristics. Previous studies on workload characterization conducted by the authors showed that i) bidding activity on auctions increases considerably after 90% of an auction’s life time has elapsed, ii) a very large percentage of auctions have a relatively low number of bids and bidders and a very small percentage of auctions have a high number of bids and bidders, iii) prices rise very fast after an auction has lasted more than 90% of its life time. Thus, if bidders are not able to successfully bid at the very last moments of an auction because of site overload, the final price may not be as high as it could be and sellers, and consequently the auction site, may lose revenue. In this paper, we propose server-side caching strategies in which cache placement and replacement policies are based on auction-related parameters such as number of bids placed or percent remaining time till closing time. A main-memory auction cache at the application server can be used to reduce accesses to the back-end database server. Trace-based simulations were used to evaluate these caching strategies in terms of cache hit ratio and cache efficiency. The performance characteristics of the best policies were then evaluated through experiments conducted on a benchmark online auction system.
1
Introduction
Online auctions are becoming an important segment of the e-commerce space with large players such as eBay and Yahoo!Auctions. It has been observed that web requests follow Zipf-like distributions and that this fact can be used to design caches that improve hit ratios [6]. That work was applied to web sites that mostly served static pages. E-commerce sites generate most of their pages dynamically. Our workload characterization work [1, 2, 16] of online auction sites also found evidences of Zipf distributions, and power laws in general. Our previous work also showed that the workload of online auction sites is substantially different from that of online retailers and uncovered a plethora of interesting findings that can
be used, among other things, to improve the performance of online auction sites. These findings include i) There is some bidding activity at the beginning stages of an auction. This activity slows down in the middle and increases considerably after 90% of an auction’s life time has elapsed. ii) A very large percentage of auctions have a relatively low number of bids and bidders and a very small percentage of auctions have a high number of bids and bidders. iii) Prices rise faster in the first 20% of an auction’s life time than in the next 70% of its life time. However, after the age of an auction reaches 90%, prices increase much faster than in the two previous phases. iv) A relatively few users are responsible for winning the majority of auctions. v) A relatively few sellers are responsible for creating the majority of the auctions. vi) The majority of bids are placed by a relatively small number of unique bidders.
We rely on these facts to suggest that a main memory auction cache at the application server can save a significant number of accesses to a backend database and thus significantly reduce the server-side latency for both read and write requests at online auctions sites. We propose several cache placement and replacement policies. We conducted an experimental validation of our policies for various cache sizes using a trace derived from a data collection process in which an agent collected data for over 340,000 auctions from Yahoo!auctions. We measured the cache hit ratio and the cache efficiency. Our findings show that small caches can be quite efficient and are able to provide reasonably large hit ratios.
We then implemented a three-tiered online auction site based on RUBiS [3] and on TPC-W (www.tpc.org). The workload generator for that site mirrored the workload we identified in a large production auction site. We implemented server-side caching using the best placement and replacement policies identified in the trace-driven simulation. The experimental results allowed us to assess the performance of the online auction site in terms of response time, throughput, and other metrics.
The trace-based simulation and the experimental assessment using the three-tiered testbed are complementary and serve distinct purposes. The evaluation of cache effectiveness in terms of hit ratio and cache utilization does not require a detailed simulation of the auction site components (e.g., processors, disks, networks). Only the cache needs to be simulated. Once we identify the best cache placement and replacement policies among the ones that we introduced and proposed, we need to assess the performance of the site in terms of metrics such as response time, throughput, and utilization of its components. This requires taking into account the components of the site and their interconnections. An adequate evaluation would require a very detailed simulation of the auction site. Instead, we resorted to using an experimental testbed since it would provide us with a much richer set of performance metrics.
Significant work has been done in the area of web caching [10, 11, 19, 22]. Many conferences including IEEE’s International Workshop on Web Content Caching and Distribution (WCW), already in its 10thinstallement, and the
some of the preferred venues for cache-related publications. A good collection of cache related information and resources is Brian Davidson’s web site (www.web-caching.com/). A new cache document replacement policy considering the con-tribution-to-sales of every document was proposed in [8]. A technique to improve performance of web sites that deliver dynamic content was proposed in [5] and is based on the notion of degrading dynamic content based on elapsed time of content generation. In general, web caching work can be classified into browser caching, client-side proxy caching, network caching (as in Content Delivery Net-works), and side caching [19–21]. Our work falls into the realm of server-side caching and is specific to online auctions sites. The authors are not aware of any other auction-site specific caching study that uses real traces from a large production auction site.
An important distinguishing feature of our work is that it deals with caching in a non-traditional way. Previous caching studies have relied on temporal fea-tures (e.g., Least Recently Used), frequency aspects (e.g., Least Frequently Used), or even space characteristics (e.g., size of a Web document). We deal with indicators that are relevant to a specific online business, i.e., bidding ac-tivity, and use these indicators to drive the cache placement and replacement policies. Thus, it is not enough to know that someone viewed an item in order to decide to cache it; it is rather more important to consider the fact that someone bid on that item. Our policies are therefore business-oriented because bidding activity is directly related to the revenue generated by an auction site. Another noteworthy aspect of our study is that it is driven by a thorough workload characterization study we performed on a very large production auction site. Therefore, all trace-driven simulations and experimental evaluation is based on realistic workloads. Finally, our study incorporates both simulation and actual implementation in order to provide a complete assessment of the caching policies we devised. Trace-driven simulation is used to evaluate cache hit ratios of several policies. Experiments on a three-tiered auction benchmark site is used to assess performance metrics, including response time and throughput, for the caching policies that have the best hit ratios.
The rest of this paper is organized as follows. Section two provides some background and definitions used throughout the paper and introduces in more detail the notion of an auction cache. Section three describes typical user be-havior using a Customer Bebe-havior Model Graph. The next section describes the cache placement and replacement policies studied here. The policies are evalu-ated in section five with the help of trace-driven simulation using data gathered from a large production auction site. Section six describes our implementation of a three-tiered auction site that uses the best cache placement and replacement policies identified in section five and provides the results of the evaluation of its performance in terms of response time and thorughput. Finally, section seven presents some concluding remarks.
2
Background
An open auction (i.e., one that is still in progress) is defined by several param-eters including: opening time,to, closing time,tc, and the total number of bids,
b(t), submitted up to timet. From these parameters, one can define tp(t), the
percent remaining closing time at timet, as [(tc−t)/(tc−to)]×100.
The typical software architecture of an auction site is multitiered and is composed of three layers as indicated in Fig. 1. The first layer comprises web servers that handle the incoming HTTP requests and serve static HTML pages. Most pages served by an auction site are dynamically generated by an application server, which implements the site’s business logic. The application server may need to access persistent data stored in a backend database server. An example is the processing of a request to view all bids for a given auction. The bid information comes from the database. The application server then generates an HTML page with the bid information. This page is passed back to the web server, which sends the page back to the browser.
Cache Manager
Web Server
Auction Cache Database Server Application Server DB cache hit cache missFig. 1. Architecture of an online auction site.
The performance of online auction sites can potentially be improved if a fraction of the millions of auctions present at any time is cached in the main memory of the application server, thus avoiding most of the trips to the database. As indicated in Fig. 1, when the information about an auction can be found in the main memory cache of the application server, acache hit occurs. Otherwise
a cache miss occurs and the information about the auction has to be retrieved
from the database. The auction cache can store the following information about an auction:
– Auction information: includes headline, textual description, names of the files that store thumbnail images and possibly larger images, number of bids, highest bid, highest bidder ID, bid increment, starting price, and seller ID.
– Bid history: all the bids placed for the auction. Each bid includes bidder ID, overall bid sequential number, bid price, and proxy flag (indicates if the bid was manually placed or if it was placed by an agent on behalf of the bidder). – Seller information: specifies the seller of the auction and his/her rating in-formation, number of auctions sold, and date since the seller has been a member of the auction site.
In this paper we are only concerned with transactions that can potentially be served by an auction cache. Therefore, we do not consider transactions such as auction creation, registration, and login. The transactions that may be served by the cache can be divided into read-only and write transactions. Read-only transactions include View Bid, View Auction Information, View Auction Details (e.g., description of items, warranty), View Seller Information and Ratings, and View Comments on the Seller. The main write transaction is Place Bid.
There could be a problem executing write transactions at the cache without refreshing the database immediately. If a power failure occurs, the content of the main memory cache could be lost and with it all updates (i.e., all bids on the cached auctions). However, large production e-commerce sites maintain multiple levels of backup power supplies such as separate power sources, UPS, and power generators. So, power failures at popular e-commerce sites are extremely rare. Therefore, we assume that the auction cache survives power failures. This as-sumption assures that write transactions can be executed at the cache. Failures due to software crashes are also possible. To cope with them, one may write a log of all write transactions at the application server in parallel with writing into the cache. A background process can be used to refresh the backend database at regular intervals from the log.
Most production auction sites have several web servers and several applica-tion servers. Therefore, each applicaapplica-tion server will have its own aucapplica-tion cache. To deal with problems of cache coherence we assume that any given auction can be cached at one and only one application server cache. This can be ac-complished by identifying each auction by a unique id. Then, one can devise a functionf that takes as input an auction’s unique id and returns the id of one of the application servers. The id of the application server that handles requests for a given auction can be first sent in a cookie and returned in a cookie to the web server so that the request can be dispatched to the proper application server.
Auction sites have grown rapidly in the last couple of years, and recent statis-tics indicate that eBay carries about 50 million items for sale at any time on its site [12]. Yahoo!Japan carries 7.5 million items for sale [23]. We estimate that each auction, including its details, bids history and seller information, requires about 8KB of cache space. Thus, to cache 5% of all auctions, an auction site carrying 10 million items for sale would require 10,000,000×0.05×8KB = 4GB of main memory cache. This estimate does not include other items to cache, such as category names, state names, payment types and other static information to serve web requests quickly. Thus, for a caching scheme to be effective, it must provide a relatively high cache hit ratio for a reasonably small cache.
Home (h) Search Auction (s) View Details (d) View Info (i) Place Bid (b) View Bids (v) p hs p ss p sd p di p ds p is p iv p vs p vb
Fig. 2. Customer Behavior Model Graph (CBMG) for an online auction site.
3
User Behavior
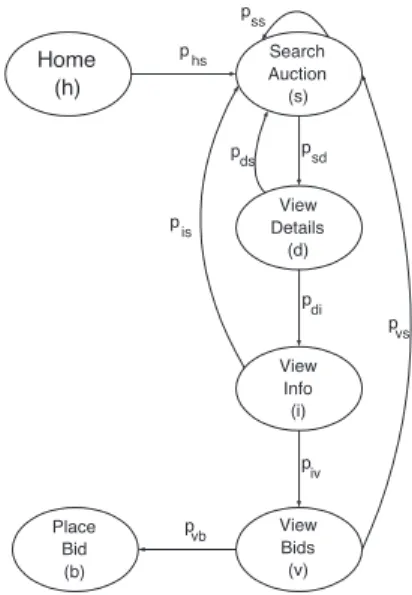
The data gathering process from an actual online auction site only provided infor-mation about write transactions—auction creation and bid placement. Typically, users generate read transactions in the form of browse and search actions—e.g., view bid, search items, view seller information—that are not stored by the site. Nevertheless, these actions are important when evaluating the performance of such sites. Therefore, we needed to build a user model that captures major user activities and the transitions between them. Such model, in the form of a Cus-tomer Behavior Model Graph (CBMG), defined by Menasc´e et al. [18], was used to create a trace of user activities that includes all typical transactions (both read and write) generated from users. This model allowed us to derive the rela-tive number of transactions of each type within a user session (i.e., a sequence of consecutive requests from a user during the same visit). That information was combined with the actual trace of write-only transactions to produce a complete trace of read and write actions.
We describe in what follows a typical user session using the CBMG. Each node of the graph represents a state in which a user may be during a session. Nodes of a graph are connected by directed arcs that indicate the possible tran-sitions between states. Arcs are labeled with the probability that a transition between states occurs. Figure 2 depicts an example CBMG for an online auction site. Transactions that are not relevant to the cache are not shown. Transitions from each state to an Exit state are not shown for better readability. A CBMG can be used to determine the average number of visits per session to statei,Vi,
The average number of visits,Vi, to state idepends on the average number
of visits to the neighboring states of state iand on the transition probabilities between these states and statei. For example, statesin Fig. 2 has five neighbors (h,s, d,i, andv). The contribution of stated toVs is equal to the number of
visits to stated,Vd, multiplied by the probability of a transition from statedto
states,pds. Applying this method to the CBMG of Fig. 2, yields the following
equations. Vs=phs+pssVs+pdsVd+pisVi+pvsVv (1) Vd=psdVs (2) Vi=pdiVd=pdipsdVs (3) Vv=pivVi=piv pdipsdVs (4) Vb=pvbVv=pvb piv pdipsdVs (5)
The value ofVscan be obtained by solving the system of linear equations in
(1)-(5):
Vs=
1
1−(pss+pdspsd+pispdipsd+pvspivpdipsd)
(6) The ratio between read and write transactions, RW, is given by RW = (Vd+Vi+Vv)/Vb. Using the following typical values for the transition probabilities
phs = 1.0, pss = 0.8, psd = 0.1, pdi = 0.55, piv = 0.5,pvs = 0.75, pvb = 0.2
pds = 0.4, pis = 0.45, yields a value of RW equal to 33. Caching enhances the
performance of auction sites because there is typically a large number of read requests before a write request is submitted to an auction site as illustrated by large values of RW.
4
Cache Placement and Replacement Policies
Our work deals with caching in a non-traditional way. Previous caching studies have relied on temporal features (e.g., Least Recently Used), frequency aspects (e.g., Least Frequently Used), or even space characteristics (e.g., size of a Web document) [20]. We deal with indicators specific to online auction sites, such as bidding activity, and use these indicators to drive the cache placement and replacement policies. In other words, it is more important for caching purposes to know that someone bid on an item than knowing that the item was viewed by a user. Our policies are therefore business-oriented because bidding activity is directly related to the revenue generated by an auction site.
In this section, we propose novel bidding and auction age based caching poli-cies, which are evaluated for effectiveness in Sec. 5. Two types of caching policies are considered: cache placement and cache replacement. Acache placement pol-icy determines if an auction should be placed in the cache when it is referenced.
A cache replacement policy determines which auction should be removed from
the cache if the cache is full and the cache placement policy decides to add a new auction to the cache.
In steady-state, it is very likely that the cache will always be full. Consider now two cases. The first uses an “always place” approach (i.e., no placement policy). In this case, an auction item has to be removed from the cache every time that a new incoming item is referenced. It is possible that the evicted item, selected by the replacement policy, is more valuable than the incoming item. In the second case, a placement policy decides first if the incoming item is valuable enough to be cached, avoiding the potential problem of removing valuable items from the cache. Therefore, a placement policy will be evicting items from the cache less often. Another reason for having a placement policy is that there is a cost associated with evicting an auction from the cache since its state has to be refreshed in the backend database server. Thus, having a proper placement combined with a replacement policy is critical for implementing an efficient caching system.
Assuming an unlimited cache size, the hit ratio for a given workload is a function of the nature of the workload and of the cache placement policy. This hit ratio is the optimal hit ratio that can ever be achieved when the cache size is limited. The infinite-cache behavior can then be used as a benchmark for comparing hit ratios for the limited cache size case. Our results show that relatively small cache sizes yield the infinite cache size hit ratios as illustrated in Section 5.
4.1 Cache Placement Policies
We created two different types of policies based on bidding activity and on remaining time till auction closing. Our activity based (AB) policies consider the number of bids placed on an auction and the time based policies (PRT) consider the percent remaining time till closing. We also combined these two types to form hybrid policies.
The following four policies were evaluated using our trace-driven simulation: – ABn: this is an activity based policy. An auction referenced at time t is cached if the number of bids placed until timetis at least equal tonfor that auction, i.e.,b(t)≥n. For example the AB2 policy caches auctions with at least two bids already submitted at timet.
– PRTp: this is apercentremainingtime policy. An auction is cached at time
t if the percent remaining closing time is less than p, i.e., tp(t) < p. For
instance, the PRT30 policy caches auctions referenced within the last 30% of their duration.
– H-AND-n-p: this a hybrid policy that caches an auction if both ABn and PRTp would cache it. For example, a H-AND-2-30 policy caches auctions that have at least two bids and are within the last 30% of their duration. – H-OR-n-p: this is ahybrid policy that caches an auction if ABnor PRTp
would cache it. A H-OR-2-30 policy caches an auction if it has at least two bids or it is within the last 30% of its duration.
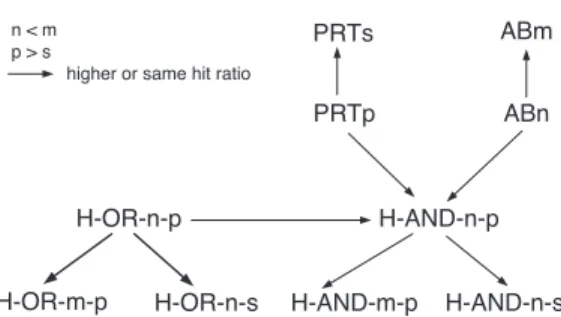
Figure 3 shows a relationship between the various policies in the unlimited cache size case. An arrow from policy ato policyb indicates that the hit ratio forais higher or the same as that of policybin the unlimited cache size case.
H-OR-m-p H-OR-n-s H-AND-m-p H-AND-n-s H-OR-n-p H-AND-n-p PRTp ABn PRTs ABm n < m p > s
higher or same hit ratio
Fig. 3.Relation between placement policies for unlimited cache size.
4.2 Cache Replacement Policies
For cache replacement policies we considered activity based (AB) and time based (PRT) policies as well as traditional replacement policies, such as Least Recently Used and Least Frequently Used, found in operating systems [9] and web server systems [14].
The cache replacement policies considered in our study are:
– AB: this replacement policy is only used in conjunction with the ABn place-ment policy. It removes the auction with the smallest number of submitted bids.
– PRT: this replacement policy is only used with the PRTnplacement policy. It replaces from the cache the auction with the largest percent remaining time to close.
– AB-PRT: this replacement policy is used with both H-AND-n-p and H-OR-n-p. It removes the auction with the largest percent remaining time to close among the ones with the smallest number of bids.
– Least Recently Used (LRU): replaces the auction that has received a request further in the past.
– Least Frequently Used (LFU): replaces the auction that has received the smallest percentage of requests among all auctions in the cache.
A caching policy is then specified by its cache placement and replacement policy. We use the naming convention<cache placement>:<cache replacement>
to name the caching policies investigated here. For example, AB2:LRU means that AB2 is the cache placement policy and LRU the replacement policy.
5
Cache E
ffi
ciency Analysis
The experimental evaluation of the policies described above was carried out with a trace-based simulation. The trace is derived from actual data collection per-formed for our previous workload characterization and closing time rescheduling work [1, 16, 17]. The data collection process was described in detail in these pa-pers. We provide here a brief summary of the process. A data collection agent
gathered a total of 344,314 auction items created during the month of January 2003, belonging to over two thousand categories, from the Yahoo!Auctions site. A total of 1.12 million bids were placed on these auctions.
For this paper we used three weeks worth of that data, which contains 210,543 auctions, and 156,074 bids on these auctions. Note that the data we collected only contains the auction creation and bid records for each auction. Thus, we do not have data on read-only requests (e.g., view bids, view seller info, view auction details). However, for the purpose of the simulation, we inserted thirty read requests in the trace before each bid to maintain a RW ratio compatible with the CBMG analysis of section 3.
We varied the cache size to assess the impact of the placement and replace-ment policies as the cache size changed. We report the cache size as a percent,
Pc, of the total number of auctions Na that are cached. Thus, a 5% cache size
implies that 5% of the 210,543 auctions can be stored in the cache. The amount of main memory required per auction is around 8,000 bytes.
Each experiment used a combination of cache placement and cache replace-ment policy and computed the following metrics for different cache sizes:
– Cache hit ratio (H): percent of cacheable transactions that were served from the auction cache.
– Cache efficiency (ε): defined as the ratio (H×100)/Nc, whereNcis the
aver-age number of auctions in the cache. This number is computed, using Little’s Law [13], as the product of the average cache throughput (i.e., number of auctions that leave the cache divided by the duration of the experiment) and the average time spent in the cache per auction. The cache efficiencyε measures how much hit ratio one gets per cached auction on average. Due to space limitations we only present a small subset of all graphs we generated in our simulations. A general observation seen from all graphs is that a relatively small cache, e.g., 4 to 5% of all auctions is enough to generate cache hit ratios of around 50 to 70%. Even very small caches of about 1% can generate cache hit ratios as big as 40%.
5.1 Results for ABn Placement Policies
Figure 4 displays the cache hit ratio for the AB1:AB, AB2:AB, and AB3:AB policies as a function of the percent cache size. The figure indicates that the three policies have almost the same cache hit ratio for very small cache sizes. However, as the cache size increases, AB1:AB outperforms AB2:AB, which outperforms AB3:AB, as discussed above. It can also be observed that the cache hit ratio increases much faster at the beginning for smaller cache sizes. It can also be observed that a cache size of 0.5% is sufficient to provide a cache hit ratio of about 35% for all three policies. It can also be seen that all three policies approach very fast their unlimited cache size performance. For example, the AB1:AB policy has a limiting hit ratio of 68.2%. Ninety nine percent of this value is achieved for a 4% cache size. Around 86% of the limiting performance of AB1:AB is obtained
0 10 20 30 40 50 60 70 0 1 2 3 4 5 6
Percentage Cache Hit Rate
Percentage Cache Size AB1:AB
AB2:AB AB3:AB
Fig. 4. Hit ratio for AB1:AB, AB2:AB, and AB3:AB.
0 10 20 30 40 50 60 70 0 1 2 3 4 5 6
Percentage Cache Hit Rate
Percentage Cache Size AB1:AB AB1:LRU AB1:LFU
Fig. 5. Comparison among replacement policies AB, LRU, and LFU for place-ment policy AB1.
for a 2% cache size. In terms of efficiency, AB3:AB outperforms AB2:AB, which outperforms AB1:AB. For example, for aPc= 0.25%, the efficiency of AB1:AB
is 0.078 while that of AB3:AB is 0.086.
Figure 5 shows a comparison among the replacement policies AB, LRU, and LFU when used in conjunction with placement policy AB1, the best in Figure 4. As expected, for sufficiently large cache sizes, i.e., forPc>4.5% all three policies
yield the same result. Smaller cache sizes distinguish the three policies with LRU being the best, followed by AB, and then by LFU. For example, forPc=
0.25%, LRU outperforms AB as a replacement policy by a 53% margin. In fact, AB1:LRU has a 43% hit ratio while AB1:AB has a 28.1% hit ratio for Pc =
5.2 Results for PRTp Placement Policies
Figure 6 compares policies PRT10:PRT, PRT30:PRT, and PRT50:PRT. As was the case with the ABnplacement policy, the increase in hit ratio is much faster for smaller caches. The unlimited cache size hit ratios for these policies are 18.6%, 32.2%, and 44.2%, respectively, and occurs for a value of Pc equal to 6%. The
difference in hit ratio is significantly reduced for smaller cache sizes. For example, for Pc = 0.25% the hit ratios for PRT10:PRT, PRT30:PRT, and PRT50:PRT,
are 15.3%, 19.5%, and 23.5%, respectively.
0 5 10 15 20 25 30 35 40 45 0 1 2 3 4 5 6
Percentage Cache Hit Rate
Percentage Cache Size PRT10:PRT
PRT30:PRT PRT50:PRT
Fig. 6.Hit ratio for PRT10:PRT, PRT30:PRT, and PRT:50.
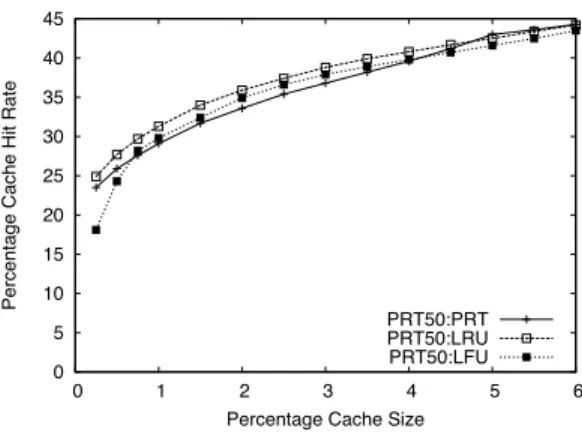
Figure 7 compares the effects of the PRT, LRU, and LFU replacement policies combined with the PRT50 placement policy. For a percent cache size of 6% all three replacement policies display similar results because the unlimited cache size behavior is already achieved at this point. For smaller cache sizes, LRU is slightly better than PRT, which is slightly better than LFU. The difference between these replacement policies when combined with PRT is not as marked as in the ABncase.
5.3 Results for the Hybrid Policies
We consider now policies of the type H-AND-n-p:AB-PRT in Fig. 8. The un-limited cache size behavior is achieved for much smaller cache sizes than in the ABnand PRTpcases (Pc = 2.5% instead ofPc= 6.0%). As indicated in Fig. 3,
one would expect that for large cache sizes, the following orders, from best to worst, to hold: i) H-AND-1-30→H-AND-2-30→H-AND-3-30; ii) H-AND-1-50
→H-AND-2-50. iii) H-AND-1-50→H-AND-1-30. iv) H-AND-2-50→ H-AND-2-30. These relationships are confirmed in the graph of Fig. 8. However, Fig. 3 does not allow us to infer a relationship between H-AND-1-30 and H-AND-2-50. Our experiments indicate, as shown in Fig. 8, that AND-2-50 outperforms H-AND-1-30. ForPc= 2.5% the hit ratio of H-AND-2-50 is 15% higher than that
0 5 10 15 20 25 30 35 40 45 0 1 2 3 4 5 6
Percentage Cache Hit Rate
Percentage Cache Size PRT50:PRT PRT50:LRU PRT50:LFU
Fig. 7.Comparison among replacement policies PRT, LRU, and LFU for place-ment policy PRT50.
of H-AND-1-30 and for a small cache ofPc= 0.3%, the hit ratio of H-AND-2-50
is 20.0% higher than that of H-AND-1-30. This means that it is better to start caching earlier as long as the auction seems to be more popular.
0 5 10 15 20 25 30 35 40 0 0.5 1 1.5 2 2.5
Percentage Cache Hit Rate
Percentage Cache Size H-AND-1-30:AB-PRT H-AND-2-30:AB-PRT H-AND-3-30:AB-PRT H-AND-1-50:AB-PRT H-AND-2-50:AB-PRT
Fig. 8.Hit ratio for various HIT-AND-n-ppolicies.
Figure 9 is similar to Fig. 8 except that a H-OR placement policy is used as opposed to a H-AND one. The H-OR policies provide higher hit ratios than their H-AND counterparts. We already knew that would be the case for unlimited cache sizes according to Fig. 3. For example, while H-AND-1-50:AB-PRT has a cache hit ratio of 37.8% forPc= 2.5%, H-OR-1-50:AB-PRT has a cache hit ratio
of 59.0% for the same value ofPc. Consider now the same relationship for a small
cache size of Pc = 0.3%. The H-OR-1-50 policy outperforms the H-AND-1-50
0 10 20 30 40 50 60 70 80 0 1 2 3 4 5 6 7
Percentage Cache Hit Rate
Percentage Cache Size H-OR-1-30:AB-PRT H-OR-2-30:AB-PRT H-OR-3-30:AB-PRT H-OR-1-50:AB-PRT H-OR-2-50:AB-PRT
Fig. 9.Hit ratio for various HIT-OR-n-ppolicies.
Another observation from Fig. 9 is that a large cache is required to achieve an unlimited cache size performance level (Pc= 6.5% as opposed toPc= 2.5%)
when compared to the H-AND case. For the large cache sizes, the following relationships, which are in accordance with Fig. 3, can be observed (from best to worst): i) H-OR-1-50→H-OR-2-50. ii) H-OR-1-30→H-OR-2-30→ H-OR-3-30. iii) H-OR-1-50→H-OR-1-30. iv) H-OR-2-50→H-OR-2-30. It is interesting to note the crossovers between H-OR-1-50 and H-OR-1-30 and between H-OR-2-50 and H-OR-2-30. They show that for smaller cache sizes, the preferred policy is not the one that has the best performance for unlimited cache sizes.
5.4 Policy Comparisons
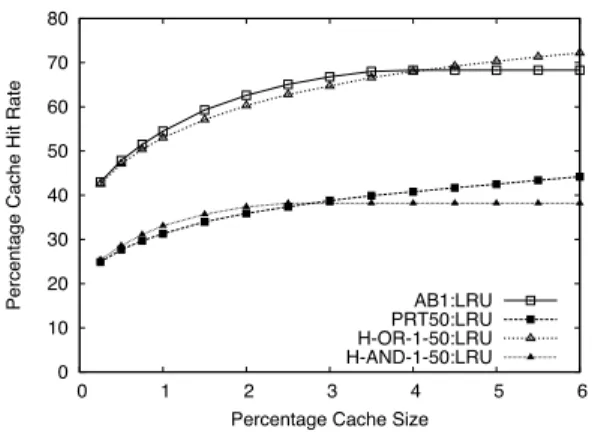
This section compares the best policies of each category—AB1:LRU, PRT50:LRU, H-OR-1-50:LRU, and H-AND-1-50:LRU—with respect to the cache hit ratioH
and the cache efficiencyε. Figure 10 compares these policies with respect toH
and shows that AB1:LRU and H-OR-1-50:LRU are very similar and far superior than PRT50:LRU and AND-1-50:LRU. AB1:LRU is slighty superior than H-OR-1-50:LRU for 0.25%≤ Pc ≤4.0%. For Pc > 4.0%, H-OR-1-50:LRU has a
higher hit ratio. Figure 11 compares the same policies in terms of cache efficiency. It can be seen that, for all four policies,ε decreases very fast as the cache size increases indicating that small caches are very effective because of the power law characteristics of auction workloads [1, 16]. In fact, the efficiency curves also fol-lows a power law. For example, using regression on the AB1:LRU efficiency curve yieldsε= 0.001704/P0.703
c . As can be seen, AB1:LRU and H-OR-1-50:LRU have
higher cache efficiency than the two other policies.
6
Experimental Performance Evaluation
Section 5 provided an extensive evaluation of various cache placement and re-placement policies using trace-based simulation. We then implemented the best
0 10 20 30 40 50 60 70 80 0 1 2 3 4 5 6
Percentage Cache Hit Rate
Percentage Cache Size AB1:LRU PRT50:LRU H-OR-1-50:LRU H-AND-1-50:LRU
Fig. 10.Hit ratio comparison for various policies.
0.00 0.02 0.04 0.06 0.08 0.10 0.12 0 1 2 3 4 5 6 Cache Efficiency
Percentage Cache Size AB1:LRU PRT50:LRU H-OR-1-50:LRU H-AND-1-50:LRU
policies in a multitiered auction site and conducted experiments to evaluate the best placement and replacement policies in an experimental setting by varying the load expressed in terms of the number of client emulators. This allowed us, among other things, to compare response time and throughput with and without caching.
6.1 Experimental Setup
Our experimental online auction site is based on Rice University Bidding Sys-tem (RUBiS) [3, 7]—a transactional web service benchmark that supports the major activities of an online auction site—and on the Transaction Performance Processing Council’s e-commerce benchmark (TPC-W).
The experimental auction site distinguishes between three types of user ses-sions: visitor, buyer, and seller. Each session is represented by a Customer Be-havior Model Graph (CBMG) [18]. Visitors can browse and search on comments without authenticating themselves. Buyers and sellers need to be authenticated before bidding or creating new auctions. The site also supports leaving com-ments and viewing comcom-ments on other registered users as is typically supported by most online auction sites. A buyer session includes viewing bids on an item, bidding on an item, and viewing comments from others. Seller sessions include payment of listing fees, specifying details of the auction item, and the auction details, such as duration in days, minimum price (reserve price), bid increments, whether the item is available as a buy-it-now item, and buy-it-now price, if applicable.
There are two significant differences between our benchmark and RUBiS. The first difference lies on the client emulator, which generates a load that more closely reflects a realistic activity given that it is based on our previous work on workload characterization of a large production auction site [1, 2, 16]. As we demonstrated in that work, bidding activity depends on auction age. To generate realistic bidding activity we used the following approach. If a bid cannot be placed, the user session goes back to a previous state, from which it can navigate to a new path. We modified RUBiS’ client emulator to view auctions that are closing soon more often than those that just opened. We keep track of of auctions viewed at each age interval. The process to select an auction to view among the auctions displayed by a search is done in a way that the minimizes the error between the current and desired view auction distribution. After a number of such executions, the expected and actual distributions converge. The distribution of bids submitted during each auction age interval versus the lifetime of an auction is shown in Fig. 12. This distribution closely mirrors the observed distribution at a real large production auction site [1, 16]
The second main difference is in the server side. We implemented the server-side cache at the application server as described in the previous sections of this paper. We cached auction information (id, name, description, initial price, quantity, reserve price, market value, buy now price, number of bids, maximum bid, starting date, end date, seller, and category), seller information (id, name, e-mail, rating, balance, creation date, and region), bid history (id, user id, item
0 0.5 1 1.5 2 2.5 3 3.5 4 4.5 5 0 10 20 30 40 50 60 70 80 90 100
Percentage of Bids Placed
Auction Age
Fig. 12.Percentage of bids submitted vs. life of an auction.
id, quantity, bid, maximum bid, and bid date), comments (id, from user id, to user id, rating, comment date, and comment text), region information (id and name), and categories (id, parent category id, and name). Regions and categories always remain in the cache while the other items are placed and replaced from the cache according to the placement and replacement policies. When all the auctions of a given seller are removed from the cache, the seller information, along with its comments are also removed. When an auction is removed, its bid history is removed from the cache. The cache size is a configurable parameter set to 3% of all auctions for all experiments.
We evaluated experimentally the best placement policy identified during our simulations, which is the activity based placement policy with a single bid as the threshold, i.e., the AB1 placement policy). Since we cache multiple data elements (auctions, bids, users, comments etc.) we used the AB bidding activity based cache replacement policy instead of LRU. This is done because, as described above, it makes sense to remove from the cache items that are no longer relevant (for example, the seller information is removed from the cache when there are no more auctions for that seller in the cache). Thus, our experiments use the AB1:AB policy pair throughout.
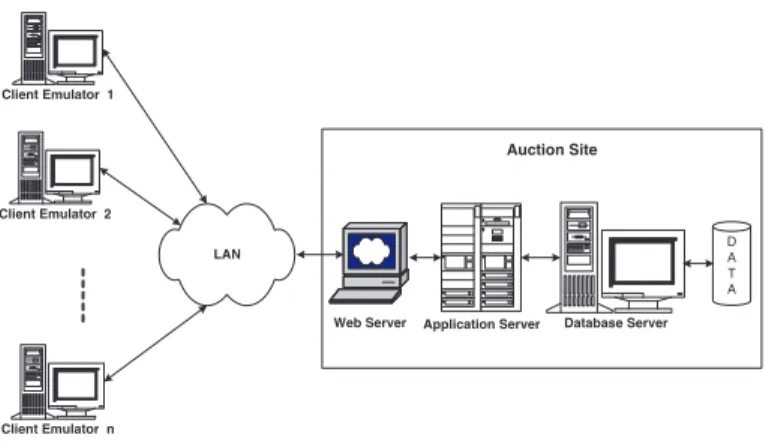
The server side of the experimental setup (see Fig. 13) is composed of three Intel Pentium 4 machines running Linux to implement the Web server (Apache version 2.0), application server (servlets provided with RUBiS modified to handle caching running on Tomcat version 4.2 as servlet container), and database server (MySql version 3.23). We used four client machines also running Linux. These client machines run our modified browser emulator. It was necessary to use four client machines to make sure that the clients would not become a bottleneck in terms of being able to drive the auction site to high utilizations.
The client emulator generates workload on the auction site by creating one thread per user session. Each user session creates load on the site by placing various HTTP requests on a persistent HTTP connection. The load on the site
Database Server Application Server D A T A Web Server Client Emulator 2 Auction Site LAN Client Emulator 1 Client Emulator n
Fig. 13.Experimental testbed.
can be varied by changing the number of user sessions. Each user session sends an HTTP request, reads the response, and follows embedded hyperlinks in the response in a loop until an end state is reached. The user session waits between placing requests emulating the “think time” of real users as required by TPC-W. The next state is determined by a CBMG that can be configured to create different types of loads by changing the transition probabilities in the CBMG. We use the default bidding mix used by RUBiS [3] in all our experiments, which is based on eBay’s activity.
Each experiment ran for thirty minutes navigating the auction site and roughly generating the activity illustrated in Table 1 from one of the experi-ments. We compressed time in order to complete all experiments in a reasonable amount of time. We modeled one day of real time as one hour in the experiments. So a one-hour auction represents a one-day auction. We also made sure that some auctions would be closing within a few minutes after the experiments started.
Before the start of each experiment we i) delete existing auctions and bids placed on them, ii) re-generate 32000 auction items with start dates randomly created in the past and in the future in order to create a realistic distribution of auctions closing soon at the start of the experiment, iii) insert auctions into the database, iv) restart the web server, application server, and database server. During the experiments we usesarto gather CPU, memory, and disk activity information on all the machines in the environment. At the end of the experiment we merge the results from each client.
6.2 Experimental Results
The results in this section will be classified under the following categories: a) system-wide performance metrics; b) CPU utilization results for the web, ap-plication, and database servers; c) memory utilization for the Web server and application server; and d) disk activity at the database server. Disk activity at
Table 1. Transaction type distribution per user session.
Request Type % Visits Request Type % Visits
Home 4.19 Register Form 1.18
Register user 1.16 Browse main page 7.15
Browse categories 5.05 Search items in categories 21.63 Browse regions 2.00 Browse categories in region 1.97
Search items in region 4.64 View item 27.58
View user info 0.94 View bid history 0.79
Put bid authorization 4.47 Put bid 4.86
Store bid 3.66 Put comment 0.24
Store comment 0.23 Authentication for selling 0.54
Select category to sell 0.53 Sell item form 0.52
Submit item registration 0.52 About me (authorization form) 1.64
About me 1.83 Back probability 1.33
End of session 1.37
the web and application servers and memory utilization at the database server is not discussed because of their negligible impact on performance.
System-wide Performance Metrics Figure 14 shows the variation of the throughput of the auction site, measured in HTTP requests per second, as a function of the number of clients for the situation with and without caching. The figure shows that in both cases, the throughput saturates at high loads as expected. However, caching provides a 56% increase in throughput. For example, at 600 clients the throughput with caching is 51 requests/sec, while without caching is 32.7 requests/sec. 5 10 15 20 25 30 35 40 45 50 55 100 200 300 400 500 600 Requests/sec Number of Clients Cache No Cache
Figure 15 depicts the variation of the response time at the auction site as a function of the number of clients. Response time is measured at the client and includes the time to download all images of a page. It also includes the time necessary for retries in case of timeouts; a maximum of five retries can be attempted before aborting a request. As it can be seen, caching was able to significantly reduce the response time especially at high loads. For instance, at 600 clients, the response time without caching is 8 seconds, i.e., over three times higher than the response time with caching, which is 2.6 seconds.
0 1 2 3 4 5 6 7 8 100 200 300 400 500 600
Avg. Reponse Time (sec)
Number of Clients Cache
No Cache
Fig. 15.System response time (sec) vs. number of clients.
In e-commerce activities, response time is important and customers tend to abandon a site if response times are large. We looked at the percentage of requests that have a response time higher than 5 seconds to gives us an indication of what would be the percentage of lost requests. This is depicted in Fig. 16. As it can be seen, as the load increases, the percentage of requests with response times exceeding 5 seconds increases much faster when caching is not used. For example, for 600 clients 67% of the requests take longer than 5 seconds while caching is able to reduce that number to 12%.
CPU Utilization The variation of the utilization of the CPU of the Web server as a function of the load is depicted in Fig. 17. Our results show, consistently with [3, 7], that the Web server’s CPU is the bottleneck of the system. The Web server serves many static HTML pages and images. Despite a much higher throughput at high loads, the use of caching provides slightly lower utilization of the CPU at the Web server.
Figure 18 shows the utilization of the CPU for the application server. It can be seen that the utilization levels of the CPU at the application level are much lower than that for the Web server. The figure shows an interesting crossover point between the caching and non-caching curves. At light loads, the throughput is
0 10 20 30 40 50 60 70 100 200 300 400 500 600 Percentage of Requests Number of Clients Cache No Cache
Fig. 16. Percentage of requests that take longer than 5 seconds vs. number of clients. 10 20 30 40 50 60 70 80 90 100 200 300 400 500 600 CPU Utilization Number of Clients Cache No Cache
almost the same for both caching and non-caching cases (see Fig. 14). However, the non-caching case has a slightly higher CPU utilization because of various reasons: establishing more connections with the database server, putting together SQL calls, and managing a larger number of concurrent threads. As the load increases, the throughput increases more with caching than without caching as seen in Fig. 14 and since caching takes place at the application server, its CPU utilization requires more CPU processing for a higher number of requests per unit time. Thus, at high loads, the CPU utilization of the application server is higher for the caching case.
1 2 3 4 5 6 7 8 9 100 200 300 400 500 600 CPU Utilization Number of Clients Cache No Cache
Fig. 18.Application server CPU utilization vs. number of clients.
The utilization of the database server’s CPU, shown in Fig. 19, which shows that with caching the CPU utilization is significantly lower since many requests can be satisfied by the cache at the application server and do not need to go to the database server. For example, at a high load of 600 clients, the non-caching CPU utilization is 2.3 times higher than in the caching case.
Memory Utilization Figure 20 shows the variation of the amount of memory used by the web server machine including memory allocated to the operating system, http server, and threads created to process http requests, as a function of the number of clients. As the figure illustrates, the use of caching reduces the amount of memory required because when caching is not used, requests take longer to be processed (see Fig. 15) and request-related data has to be stored in the system for longer time. For example, for 600 clients, 427 MB are required when caching is not used while 372 MB are needed if caching is used. Another way of understanding this phenomenon is through an analysis of the average number, ¯n, of concurrent requests in the system for the same external load. Using Little’s Law [13] we can compute the average number of concurrent requests in the system as the product of the throughput by the average response time. So, for caching, ¯n = 51×2.7 = 138 and for the non-caching case it is
5 10 15 20 25 30 35 40 100 200 300 400 500 600 CPU Utilization Number of Clients Cache No Cache
Fig. 19.Database server CPU utilization vs. number of clients.
¯
n= 32.7×8 = 262. Thus, when caching is used, there are less requests in the system for the same number of clients and therefore less memory is required.
260 280 300 320 340 360 380 400 420 440 100 200 300 400 500 600 Memory Utilization (MB) Number of Clients Cache No Cache
Fig. 20.Web server memory utilization (in MB) vs. number of clients.
The memory utilization of the application server is shown in Fig. 21. The difference between the caching and non-caching curves is constant and equal to 23 MB, which is exactly the amount of main memory needed by the application server to cache auction, bidding, and user data. It should be noted that the y axis of this figure starts at 180 MB, so the difference between the curves is relatively small. For example, for 600 clients, the use of caching requires 11.6% more memory.
Disk Activity Figure 22 shows the I/O activity of the database server indicat-ing the number of 512-byte blocks read and written per second for the cachindicat-ing
180 185 190 195 200 205 210 215 100 200 300 400 500 600 Memory Utilization (MB) Number of Clients Cache No Cache
Fig. 21.Application server memory utilization (in MB) vs. number of clients.
and non-caching cases. The first observation is that there is significantly more read than write activity. The second observation is that for all cases, the I/O activity follows the trend observed in the throughput curves since as the num-ber of requests processed increases so does the I/O activity as explained by the Forced Flow Law [15]. Finally, despite the fact that caching implies in less I/Os to the database per transaction, it also increases significantly the throughput resulting in slightly higher I/O activity for the caching case. For example, for 600 clients, caching results in 12.7% more reads/second in the caching case than in the non-caching one. But as seen before, the throughput in this case is 56% higher. This indicates that the cache hit ratio for 600 clients is the difference, i.e., 56%−12.7% = 43.3%. 0 100 200 300 400 500 100 200 300 400 500 600
Disk Activity (blocks/sec)
Number of Clients Reads - Cache
Reads - No Cache Writes - Cache Writes - No Cache
7
Concluding Remarks
This paper proposed several cache placement and replacement policies and ana-lyzed them through trace-based simulations using traces from a large production site. Some general observations from our analysis are: i) LRU is the cache re-placement policy that outperforms the others when combined with any of the placement policies considered. For example, for Pc = 0.25%, AB1:LRU
outper-forms AB1:AB by a 53% margin. ii) Hit ratios increase much faster for small cache sizes than for larger ones. For example, for the AB1:AB policy, an increase in cache size from 0.25% to 0.5% provides a 27% increase in hit ratio. An in-crease in cache size from 4% to 4.5% provides only a 0.7% inin-crease in hit ratio. iii) The unlimited cache behavior can be obtained with cache sizes ranging from 2.5%, for H-AND policies, to around 6% for the other policies. iv) a relatively small cache, e.g., 4 to 5% of all auctions is enough to generate cache hit ratios of around 50 to 70% as is the case with the ABnpolicies. Even very small caches of about 1% can generate cache hit ratios as large as 40%. v) the H-OR-n-ppolicies provide a much better hit ratio than the H-AND-n-pones. For example, while H-AND-1-50:AB-PRT has a cache hit ratio of 37.8% for Pc = 2.5%,
H-OR-1-50:AB-PRT has a cache hit ratio of 59.0% for the same value ofPc. vi) The H-OR
policies have crossover points indicating that the best policy for unlimited cache sizes is not the best for smaller cache sizes. vii) AB1:LRU and H-OR-1-50:LRU are very similar and far superior than PRT50:LRU and H-AND-1-50:LRU. viii) AB1:LRU is slighty superior than H-OR-1-50:LRU for 0.25%≤Pc≤4.0%. For
Pc>4.0%, H-OR-1-50:LRU has a higher hit ratio. ix) The cache efficiency
de-creases very fast as the cache size inde-creases indicating that small caches are very effective because of the power law characteristics of auction workloads. In fact, the efficiency curves also follows a power law.
This analysis showed that the performance of online auction sites can be significantly increased with very small caches (on the order of 1% of the millions of items being auctioned). These small caches are more effective than larger caches and produce more hits per cached auction. We then implemented a three-tiered auction site that uses the best cache placement and replacement techniques considered in the simulation studies. The results indicated that caching can significantly increase the performance of online auction sites. For example, at high loads, the maximum throughput obtained with caching is 56% higher than when caching is not used. The response time for the same condition is about three times smaller when caching used. We also saw that at the same high load levels, 67% of the requests take longer than 5 seconds to be processed if caching is not used while this percentage falls to 12% with the used of cache. These significant performance gains are achieved with very little additional memory at the application server: 11.6% more memory, or 23MB.
In summary, this paper presented a comprehensive study of the benefits of using server-side caching on online auction sites. Cache placement and replace-ment policies were presented, analyzed through trace-driven simulations using traces collected from a large production auction site. Then, the best policies
were implemented so that response time and throughput measurements, among others, could be evaluated.
References
1. Akula, V., Menasc´e, D.A.: An analysis of bidding activity in online auctions. 5th Intl. Conf. (EC-Web 2004), Zaragoza, Spain, Aug./Sept. (2004) 206–217
2. Akula, V., Menasc´e, D.A.: Two-Level Workload Characterization of Online Auc-tions. Electronic Commerce Research and Applications Journal, Elsevier, to ap-pear.
3. Amza, C., Cecchet, E., Chanda, A., Cox, A., Elnikety, S., Gil, R., Marguerite, J., Rajamani, K., and Zwaenepoel, W.: Specification and Implementation of Dynamic Web Site Benchmarks. IEEE Workload Characterization Conference (WWC-5), Austin, TX, USA, November 25, 2002.
4. Bapna,R., Goes, P., Gupta, A.: Online auctions: insights and analysis. Comm. ACM.44(11)(2001) 42–50
5. Bradford, L., Milliner, S., Dumas, M.: Scaling Dynamic Web Content Provi-sion Using Elapsed-Time-Based Content Degradation. Proc. Web Information Systems (WISE 2004) Conf., Lecture Notes in Computer Science, Springer Berlin/Heidelberg, Volume 3306/2004
6. Breslau, L., Cao, P., Fan, Li., Phillips, G., Shenker, S.: Web Caching and Zipf-like Distributions: Evidence and Implications. INFOCOM (1), (1999), 126-134. 7. Cecchet, E., Chanda, A., Elnikety, S., Marguerite, J., and Zwaenepoel, W.:
Per-formance Comparison of Middleware Architectures for Generating Dynamic Web Content. 4th ACM/IFIP/USENIX International Middleware Conference, Rio de Janeiro, Brazil, June 16-20, 2003
8. Chen, T.: A new cache document replacement policy considering the contribution to sales. Electronic Commerce Research and Applications 4(3), Autumn 2005: 283-297 (2005)
9. Coffman Jr., E.G., Denning, P.J.: Operating Systems Theory. Prentice Hall, Upper Saddle River, NJ (1973)
10. Davison, B. D.: The Design and Evaluation of Web Prefetching and Caching Techniques PhD Dissertation, Rutgers University, October (2002) URL: http://citeseer.ist.psu.edu/davison02design.html
11. Douglis, F., Davison, B. D. (eds) : Web Content Caching and Distribution Proc. 8th International Workshop. Kluwer, June (2004)
12. hardwarezone.com: 10,000 Ebay Enthusiasts to Gather For 10TH Anniversary Cel-ebration. URL: www.hardwarezone.com/news/view.php?id=1576&cid=5, May 26 (2005)
13. Kleinrock, L.: Queuing Systems: Theory, Vol I. John Wiley & Sons, NY (1975) 14. Lee, D., Choi, J., Kim, J., Noh, S., Min, S.L., Cho, Y., Kim, C.: LRFU: A Spectrum
of Policies that Subsumes the Least Recently Used and Least Frequently Used Policies. IEEE Trans. Computers 50(12): 1352-1361 (2001)
15. Menasc´e, D.A., V.A.F. Almeida, and L.W. Dowdy: Performance by Design: Ca-pacity Planning by Example. Prentice Hall, Upper Saddle River, NJ, 2004. 16. Menasc´e, D.A., Akula, V.: Towards workload characterization of auction sites.
Proc. IEEE 6th Annual Workshop on Workload Characterization (WWC-6), Austin, TX, Oct. 27 (2003)
17. Menasc´e, D.A., Akula, V.: Improving the performance of online auction sites through closing time rescheduling. 1st Intl. Conf Quantitative Evaluation of Sys-Tems (QEST-2004), Enschede, the Netherlands, Sept. 27-30 (2004)
18. Menasc´e, D.A., Almeida, V.A., Fonseca, R., Mendes, M.: A methodology for work-load characterization for e-commerce servers. ACM Conf. Electronic Commerce, Denver, CO, Nov. 3-5, (1999) 119-128
19. Pierre, G.: A Web caching bibliography, June (2000) URL : cite-seer.ist.psu.edu/pierre00web.html
20. Rabinovich, M., Spatscheck, O.: Web Caching and Replication. Pearson Education, (2001)
21. Sarkar, P., Hartman, J: Efficient Cooperative Caching Using Hints. Proc. 1996 USENIX 2nd. Symp. on Operating Systems Design and Implementation, Seattle, WA, October, (1996)
22. Yagoub, K., Florescu, D., Issarny, V., Valduriez, P.: Caching Strategies for Data-Intensive Web Sites. The VLDB Journal, (2000) 188–199. URL : cite-seer.ist.psu.edu/yagoub00caching.html
23. Yahoo!Japan: Monthly Disclosure - March (2005 URL:http://ir.yahoo.co.jp/en/monthly/200503.html, April 8 (2005)