A
R
A: Adaptive Resource Allocation for Cloud
Computing Environments under Bursty Workloads
Jianzhe Tai
Juemin Zhang
Jun Li
Waleed Meleis
Ningfang Mi
Northeastern University, Boston, MA 02115, USA
{jtai, jzhang, junli, meleis, ningfang}@ece.neu.edu Abstract—Cloud computing nowadays becomes quite popular
among a community of cloud users by offering a variety of resources. However, burstiness in user demands often dramat-ically degrades the application performance. In order to satisfy peak user demands and meet Service Level Agreement (SLA), efficient resource allocation schemes are highly demanded in the cloud. However, we find that conventional load balancers unfortunately neglect cases of bursty arrivals and thus experience significant performance degradation. Motivated by this problem, we propose new burstiness-aware algorithms to balance bursty workloads across all computing sites, and thus to improve overall system performance. We present a smart load balancer, which leverages the knowledge of burstiness to predict the changes in user demands and on-the-fly shifts between the schemes that are “greedy” (i.e., always select the best site) and “random” (i.e., randomly select one) based on the predicted information. Both simulation and real experimental results show that this new load balancer can adapt quickly to the changes in user demands and thus improve performance by making a smart site selection for cloud users under both bursty and non-bursty workloads.
I. INTRODUCTION
Cloud computing nowadays becomes quite popular among a community of cloud users by offering a variety of re-sources. Cloud computing platforms, such as those provided by Microsoft, Amazon, Google, IBM, and Hewlett-Packard, let developers deploy applications across computers hosted by a central organization. These applications can access a large network of computing resources that are deployed and managed by a cloud computing provider. Developers obtain the advantages of a managed computing platform, without having to commit resources to design, build and maintain the network. Yet, an important problem that must be addressed effectively in the cloud is how to manage QoS and maintain SLA for cloud users that share cloud resources.
In cloud platforms, resource allocation (or load balancing) takes place at two levels. First, when an application is uploaded to the cloud, the load balancer assigns the requested instances to physical computers, attempting to balance the computational load of multiple applications across physical computers. Sec-ond, when an application receives multiple incoming requests, these requests should be each assigned to a specific application instance to balance the computational load across a set of instances of the same application. For example, Amazon EC2 uses elastic load balancing (ELB) to control how incoming requests are handled. Application designers can direct requests to instances in specific availability zones, to specific instances, or to instances demonstrating the shortest response times.
Bursty workloads are often found in multi-tier architectures, large storage systems, and grid services [1], [2], [3]. Internet flash-crowds and traffic surges are familiar examples of bursty traffic, where bursts of requests are aggressively clustered together during short periods and thus create spikes with extremely high arrival rate. We argue that the presence of burstiness can cause load unbalancing in clouds and con-sequently degrade the overall system performance. In cloud systems, many applications are no longer single-program-single-execution applications. These applications involve a large number of concurrent and dependent jobs, which can be executed either in parallel or sequentially. Simultaneously launching jobs from different applications during a short time period can immediately cause a significant arrival peak, which further aggravates resource competitions and load un-balancing among computing sites. Also, as the number of these applications significantly increases in recent years, the present of Internet flash-crowds and traffic surges becomes more frequent. As a result, how to counteract burstiness and maintain high quality of service and system availability becomes imminently important but challenging as well in clouds. However, conventional methods unfortunately neglect cases of bursty arrivals and cannot capture the impacts of burstiness on system performance.
Motivated by this problem, we propose a new load balanc-ing algorithm, called ARA, for adaptive resource allocation in cloud systems, which attempts to counteract the effect of burstiness and improve overall system performance and availability. The main contributions of this paper are (1) to present an on-off prediction approach which accurately fore-casts changes in user demands by leveraging the knowledge of burstiness in workloads; and (2) to develop a smart load balancer, which on-the-fly shifts between the schemes that are “greedy” (i.e., always select the best site) and “random” (i.e., randomly select one among all sites) based on the predicted information.
Our simulation results show that ARA reduces the response times by optimizing the dispatch of loads across computing sites and adapts quickly to the changes in user demands by making a smart site selection for cloud users under both bursty and non-bursty workloads. Sensitivity analysis with respect to various system parameters validates that ARA is effective and robust in many different environments. The real experiments conducted in Amazons EC2 further reveal the effectiveness of our ARA in a real cloud environment.
We expect that our new burstiness-aware load balancing allows cloud users to experience higher quality of service (e.g., shorter response times) without purchasing additional comput-ing resources. We also expect that our new burstiness-aware load balancing enables cloud computing systems to make better use of their infrastructure without over-provisioning during bursty periods yet keep the simplicity in resource man-agement, allowing applications to consume fewer resources and gaining maximum economic profit. The remainder of the paper presents our results in detail.
II. MOTIVATION
In this section, we first demonstrate the impact of burstiness on load balancing in a distributed simulation environment, which is developed on the CSim library [4]. We refer the interested readers to [5] for the details on system design and remark that such a simulation environment can be used to simulate a cloud computing framework. In our simulation, the system consists of N computing sites, where each site runs the First-In-First-Out (FIFO) policy to schedule the assigned jobs. The specifications of a job, including job inter-arrival time and job execution time, are created based on the specified distributions and methods.
To select an effective site for an incoming job, a load balancer periodically queries the load information (e.g., queue length and site utilization level) about each site as the ranking criteria from the host resource management systems. The load balancer then selects a computing site that has the highest ranking value (such as the shortest queue length) among all sites of the targeting application. The higher ranking values, the more likely we can complete jobs with shorter queuing times and thus obtain better system performance. Such a load balancing scheme can be referred to as “greedy” because it always selects the top-ranked site for service. We also evaluate another load balancing scheme, dubbed as Rand, which randomly selects one among all available sites.
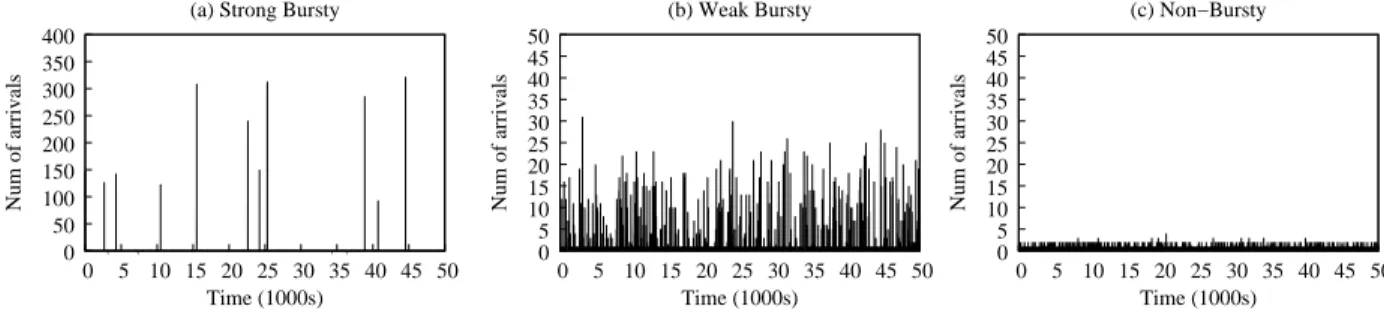
To demonstrate the performance impact of bursty arrivals, we run the simulations under three different arrival processes with burstiness profiles as shown in Figure 1. Each arrival process is drawn from a 2-state Markovian-Modulated Poisson Process (MMPP)1that can be parameterized to have the same mean equal to 10s but three different levels of burstiness: strong, weak, and non-bursty, such that the corresponding values of index of dispersionI are equal to313.5,32.25, and 1, respectively, see the details of I in Section III-B1. Here, we remark that the index of dispersion has been frequently used as a measure of burstiness in the analysis of time series and network traffic [7], [8]. The higher I indicates stronger burstiness in workloads. We observe that the number of arrivals are significantly varied under the three different workloads. In all experiments, the system consists of N = 16sites and has an average site utilization equal to50%.
1Markovian-Modulated Poisson Process (MMPP) is a special case of the Markovian Arrival Process (MAP) [6], which is used here to generate bursty flows because it is analytically tractable.
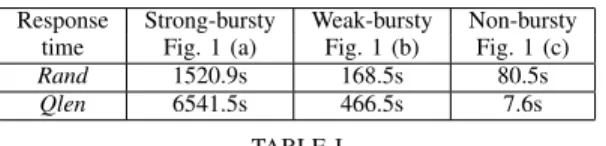
Table I shows the average response times of two load bal-ancers. We first observe that burstiness in arrivals dramatically degrades the system performance under both two algorithms. As the intensity of burstiness increases, such negative impacts on system performance become more significant. More impor-tantly, the “greedy” load balancer, Qlen, outperforms when there is no burstiness in arrivals yet ceases to be effective due to the imbalance of load among computing sites when the workload arrival process is bursty. We interpret this effect by observing that the greedy algorithms cannot detect system load surges on computing sites during bursty arrivals because of the delay in updating load information from sites, and thus make incorrect decisions based on the outdated information. For example, once a job is assigned to a computing site, the associated load information (e.g., the present queue length) of that site cannot be updated immediately at the load balancer. As a result, the load balancer always submits the bursty arrivals to that top-ranked site within the delay period2. Consequently, significant load is incurred on that particular site, resulting in the performance degradation under bursty workloads.
Response Strong-bursty Weak-bursty Non-bursty time Fig. 1 (a) Fig. 1 (b) Fig. 1 (c)
Rand 1520.9s 168.5s 80.5s
Qlen 6541.5s 466.5s 7.6s
TABLE I
MEAN RESPONSE TIMES OF TWO LOAD BALANCERS UNDER THE THREE WORKLOADS. THE NUMBER OF COMPUTING SITES ISN= 16AND THE
INFORMATION QUERY DELAY ISD= 1S.
We stress that such an information query delay unfortunately isunavoidablein real systems because when a job is submitted to a site, it takes non-negligible time for that particular site to update the information about system load. Similarly, the communication for querying and broadcasting such load in-formation between the distributed load balancers and the sites via network also take a non-negligible amount of time among clouds. Therefore, we argue thatsuch deleterious effects due to burstiness and information query delay must be considered in the performance evaluation and load balancer design for cloud computing.
III. NEWLOADBALANCER: ARA
In this section, we present our new ARA algorithm for adaptive resource allocation in cloud systems, which attempts to counteract the deleterious effect of burstiness by allowing some randomness in the decision making process and thus improve overall system performance and availability.
A. Static Version
To address the load unbalancing problem caused by bursti-ness, we present a new load balancer which can balance bursty workloads across available resources and thus improve the overall system performance. Later, we show how this new load balancer can be deployed for load balancing across a set of instances of the same application in a real cloud platform.
2In our simulation, we set the information query delayDas1second. The sensitivity analysis toDwill be given in the next subsections.
0 50 100 150 200 250 300 350 400 0 5 10 15 20 25 30 35 40 45 50 Num of arrivals Time (1000s) (a) Strong Bursty
0 5 10 15 20 25 30 35 40 45 50 0 5 10 15 20 25 30 35 40 45 50 Num of arrivals Time (1000s) (b) Weak Bursty 0 5 10 15 20 25 30 35 40 45 50 0 5 10 15 20 25 30 35 40 45 50 Num of arrivals Time (1000s) (c) Non−Bursty
Fig. 1. Illustrate the number of arrives per second under the three workloads with mean inter-arrival times equal to10s.
We observed in Section II that under non-bursty conditions the “greedy” methods that always select the best site, obtain better performance than the “random” ones. But we also observed the advantage of distributing jobs randomly among all computing sites under bursty conditions. This observation inspires us to design a new ARA algorithm which adjusts the randomness and the greediness in the decision making process.
Algorithm:static version of ARA 1.initialize
a.number of candidates:K=k; b.information query delay:D=d; /* load information updating*/ 2. foreach window ofD time
a.send queries to all computing sites for load information; b.update load information received from all computing sites; end
/* site selection process */ 3. upon each job arriving
a.sort all sitesSi,1≤i≤N, by current load information; b.setS={S1, S2, ..., SK}; /* getKsites with least load */
c.sets=uniform(1, K); /* randomly select one site from the candidate setS */
d.submit the job to siteSs; end
Fig. 2. The high level idea of the static ARA.
Given an incoming job and N available computing sites, ARA finds K sites, where K ≤ N, as the best candidates for serving that job, using queue length as the ranking crite-rion. Then, that particular job will be randomly submitted or enqueued to one site among the selected K candidates. The value of Kin ARA is critical for system performance, which in turn should be set appropriately based on the intensity of burstiness in workloads. For example,
• under the case of no burstiness in arrivals, K is set to small values (i.e., close to 1). It turns out that ARA performs exactly the same as the “greedy” load balancer, alwaysselecting the best site with shortest queue length;
• under the case of extremely strong burstiness in arrivals, the number of best candidates is set equal (or close) to the total number of available sites, i.e., K = N. Consequently, ARA has behavior similar to the “random” method, which allows the bursty workload to be shared among all sites, therefore alleviating the imbalance of load;
• otherwise, K is set to the value between1 andN.
As a result, ARA dispatches the load among sites by combin-ing the features of bothQlenandRand. Figure 2 presents the high level idea of this static version of ARA.
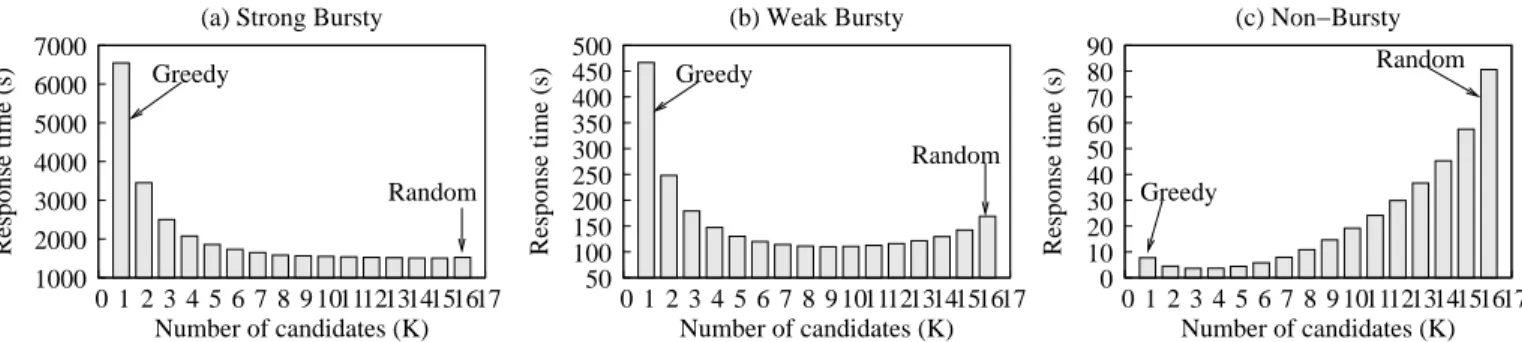
In order to evaluate the performance of ARA, we here investigate the sensitivity analysis over a range of bursty conditions and statically set the value of K from 1 to N. Figure 3 shows the average response times under ARA as a function of the number of candidatesK, as well as ones under bothQlen(see the left most bar in the figure) and Rand(see the right most bar in the figure) policies. These results give us a first proof of concept that ARA with an appropriate K
value can be beneficial for performance of cloud applications with bursty arrivals. For example, in the case of non-bursty condition, a small K (e.g., K = 3 in Figure 3 (c)) allows ARA to achieve performance similar toQlen, which greedily chooses the best candidate for the incoming jobs and thus obtains the best performance. As burstiness becomes stronger, the value of K then keeps increasing which allows ARA to behave almost the same as Rand counteracting the load unbalancing problem incurred by burstiness, see Figure 3 (a). We also notice that our static ARA achieves very similar performance as the algorithm in [9], which considers the supermarket model such that customers can randomly choose a constant number of servers and waits for service at the one with the fewest customers3.
However, such performance improvements depend on the degree of randomness that is introduced by the number of top candidates K. A good choice of K can result in significant performance improvements, but an unfortunate choice may also result in poor performance. Furthermore, real traffic of dynamic cloud environments indeed changes over times: extremely busy in some periods and quite idle in other periods. We thus remark that with a fixedKboth static ARA and the algorithm in [9] cannot always achieve the best performance across different bursty conditions. To quickly adapt to the changes in user demands, an effective way for online adjusting
K, instead of using a fixedK, becomes imminently important in cloud systems.
B. Online Version
Here, we design an online version of ARA which can re-adjust the degree of randomness (i.e.,K) on-the-fly according to the workload changes. We first leverage the knowledge of
3The experimental results obtained under [9] are not reported here due the limited space.
Greedy Random Greedy Greedy Random Random 50 100 150 200 250 300 350 400 450 500 0 1 2 3 4 5 6 7 8 9 10 11 12 13 14 15 16 17 Response time (s) Number of candidates (K) (b) Weak Bursty 0 10 20 30 40 50 60 70 80 90 0 1 2 3 4 5 6 7 8 9 10 11 12 13 14 15 16 17 Response time (s) Number of candidates (K) (c) Non−Bursty 1000 2000 3000 4000 5000 6000 7000 0 1 2 3 4 5 6 7 8 9 10 11 12 13 14 15 16 17 Number of candidates (K)
(a) Strong Bursty
Response time (s)
Fig. 3. The average response times of the ARA load balancer as a function of the number of candidatesK under (a) strong bursty workload, (b) weak bursty workload, and (c) non-bursty workload. The average response times of theQlenandRandload balancers, as well as the best performance of ARA (see the black bars) are also marked in the plots.
burstiness to develop predictors which can accurately detect the changes in user demands and then present the online ARA which dynamically shifts between the “greedy” and the “random” schemes based on the predicted information.
1) On-Off Predictor: We incorporate the index of disper-sion [7], [8] I to detect bursts in the incoming traffic. The advantage ofI is that it can qualitatively capture burstiness in a single number and thus provide a simple yet powerful way to promptly identify the start and the end of a bursty period. The mathematical definition of the index of dispersion I of a stochastic process is given as follows:
I=SCV (1 + 2P∞k=1ρk), (1)
where SCV is the squared-coefficient of variation and ρk
is the autocorrelation function (ACF) at lag k. The joint presence of SCV and autocorrelations in I is sufficient to discriminate traces with different burstiness intensities and thus to capture changes in user demands.
To understand how I performs as a single measure, we illustrate the arrival rates (i.e., the number of arrivals per 100 seconds) of a bursty workload across the time in Figure 4 (a). The trace shown in this plot consists of two idle phases and one single peak phase. We divide the whole trace into five parts during the following time windows:W1= [40K,50K), W2= [50K,55K), W3 = [55K,64K), W4 = [64K,70K), and
W5 = [70K,75K), where only windows W2 andW4 cover both idle and peak phases while the remaining windows include only one phase. We also measure the corresponding index of dispersions for each window, see the values of I
marked in the plot. We notice that the values of I are quite small when the trends of traffic are stable during both idle and peak phases, e.g., windows W1, W3, and W5, however, for the windows with clear changes in traffic, e.g., W2 with the burst arriving andW4with the burst ending, the values ofI significantly increase. This observation indicates that dramatic changes in I can be used as a measure criterion to detect the start and the end of bursty arrivals and further predict the changes in user demands.
In [10], an algorithm has been proposed to use I coupled with information about the current and previous arrival rates to detect changes in arrival intensities. In this paper, we consider to exploit this algorithm for identifying changes in cloud user demands. However, we also find that the algorithm in [10]
cannot accurately detect the start and the end of some bursts. Especially, the end of a burst is easily missed because of the deficiency of the algorithm, which results in the unnecessary delay in the detection of changes from peak to idle. In addition, the monitoring window size used in [10] is too large, which although is beneficial to capture the state transition, further extends the delay of detections in the ending of bursts.
In order to improve the prediction accuracy, we refine the al-gorithm by dynamically adjusting the monitoring window size
minstead of a fixed value in [10] to trade off the contradiction of monitoring window size and detection delay. To shorten the detection delay, a small window size is preferred which however may miss the detections of state changes, especially the end of bursts. This is because m now is too short to provide sufficient samples for readjustingIfrom small values to large ones, seeW3andW4in Figure 4. In our algorithm, we initially choose a small value of m, but dynamically enlarge the monitoring window (e.g., 2m requests) to collect enough samples for updating I, given that the original window size (i.e.,m) is not large enough.
Figure 4 (b) shows the outputs of the algorithm, where state “on” indicates the start of a burst and state “off” means the end of a burst. We can see that the changes of states “on” and “off” correctly follow the actual bursts plotted in solid lines in the figure. One should notice that the algorithm is slower in the detection of an idle period. This is the outcome of our new dynamic window size, which indeed has negligible impacts on our new load balancer’s performance because of few arrivals during idle periods. Figure 4 (c) further validates the effective of this new predictor algorithm, illustrating the accurate prediction results for the arrival traffic with strong burstiness, as shown in Figure 1 (a). We expect that this new refined predictor can accurately forecast the changes in user demands and thus can provide significant valuable information to ARA for effectively load balancing in clouds.
2) Online Adjusting of K: Motivated by the fact that Internet flash-crowds and traffic surges often present in real systems, we now propose a new load balancing algorithm, named ARA PRED, that detects the phases of “burst” and “idle” in user demands and further discriminates these two phases by introducing different degrees of randomness in an online fashion. In particular, when the predictor detects the start of a burst, we increase the degree of randomness by
3.49 37.7 4.79 35.27 3.67 W1 W2 W3 W4 W5 (a) (b) 0 10 20 30 40 50 60 70 80 90 100 7.6 7.8 8 8.2 8.4 8.6 8.8 Time(x100Ks) −10 0 10 20 30 40 50 60 70 80 90 100 4 4.5 5 5.5 6 6.5 7 7.5 Num of arrivals Time (x10Ks) Num of arrivals 0 50 100 150 200 250 300 350 Num of arrivals 0 5 10 15 20 25 30 35 40 45 50 0 5 10 15 20 25 30 35 40 45 50 On Off Predict results Time (x 1000s) Time (x 1000s)
Fig. 4. Illustrating (a) the index of dispersions that are measured within five monitoring windows under a bursty workload, (b) prediction results that accurately capture the start and the end of bursts, where the solid lines are actual traffic (i.e., arrival rates across time) and dashed lines show the detection of when burstiness starts (state “on”) and when it ends (state “off”), and (c) prediction results for the strong bursty workload, see Fig. 1(a), where the above plot shows the detections and the bottom plot presents the actual traffic.
setting K to a large value th l close to the total number of available sites. On the other hand, when the predictor detects the start of an idle period, the value of K is be decreased to a small value th s close to 1. The degree of greediness is then increased and ARA performs closely to Qlen. As a result, by leveraging the knowledge of burstiness, this new load balancer can quickly adapt to changes in user demands by shifting between the “greedy” and the “random” schemes, and thus optimize the utilization of available resources and application performance by making a smart site selection for cloud users. The high level idea of the online ARA is described in Figure 5.
Algorithm:online ARA 1.initialize
a.the large thresholdthlforK; /* e.g.,thl=d0.5∗Ne*/ b.the small thresholdths forK; /* e.g.,ths= 1*/ 2. run the prediction algorithm;
3. upon the detection of changes in user demands a. ifdetect the start of “burst”
thenincreaseKtothl; b. ifdetect the start of “idle”
thendecreaseKto ths;
c.useKfor the site selection process as shown in Fig. 2; end
Fig. 5. The high level idea of the online ARA.
C. Performance Improvement of ARA PRED
To investigate the performance of the online ARA, we here consider a case such that user demands arriving during the “burst” and the “idle” phasesbothhave non-negligible impacts on the system load, as well as the overall system performance. For example, in the arrival trace used by the following experi-ments, there are almost half of traffic arriving when the system is relatively idle, although 51% of jobs aggregate in bursts. It becomes sophisticated and time consuming to search a good value ofKfor the static version. Some value ofKmay benefit the arrivals during “idle” periods but degrade the performance of those in the “burst” periods; vice versa. Thus, adjusting values of K based on the changes in traffic becomes more important to such a case.
Figure 6 depicts the performance measures (e.g., the average response times) under the online version of ARA. The results under the greedy (e.g., Qlen) and the random (e.g., Rand)
algorithms are plotted in the figure as well. Also, in order to evaluate the prediction algorithm, we present the results for a new version of ARA, dubbed as ARA OPT, that assumes to have a priori knowledge of each job’s arrival time and thus makes an exact detection of when the burst starts and when it ends. This version thus provides an upper bound for ARA PRED. Note that when boththsandthlare equal to1,
ARA PREDperforms exactly asQlen. In all experiments, the number of computing sites isN = 16, the average utilization of each computing site is 50%, and the information query delay isD= 1s. Additionally, we here fix the small threshold
ths as 1 but change the large threshold thl from 1 to 16 in
Figure 6 (a), while fix the large thresholdthlas14but change
the small thresholdths from1 to16 in Figure 6 (b).
Greedy Best Random Optimal Greedy Optimal Random Best 0 0 0 0 0 0 1 1 1 1 1 1 0 0 0 0 0 1 1 1 1 1 1000 1040 1080 1120 1160 1200 1240 1280 1 2 3 4 5 6 7 8 9 10 11 12 13 14 15 16 Response time (s) Number of Candidates (K) (a) Fixed Small Threshold
1000 1040 1080 1160 1200 1240 1280 1 2 3 4 5 6 7 8 9 10 11 12 13 14 15 16 1120 Response time (s) Number of Candidates (K) (b) Fixed Large Threshold
Fig. 6. The average response times under the online version of ARA, where (a) the small threshold ths is kept as 1 while the large thresholdthl is changed from1to16, and (b) the small thresholdthsis changed from1to
16while the large thresholdthlis kept as14. The performance underQlen,
Randand ARA OPTare also plotted. Here, the number of computing sites is
N= 16, and the average site utilization is50%, and the information query delay isD= 1s.
The results shown in Figure 6 first confirm that neitherQlen norRandis able to obtain good performance for this workload. Qleneven presents the worst behavior because of the moderate burstiness in arrivals. Instead, our new algorithms ARA PRED
and ARA OPTsignificantly improve the system performance, using distinguished values ofK for the phases with different
burstiness intensities. Also, ARA PRED performs closely to the one with optimal forecasting, validating the accuracy of our prediction algorithm. More importantly, ARA PRED can always achieve such performance improvements as long as
thl is larger than some thresholds (e.g., 8 in Figure 6 (a))
and ths is smaller than some thresholds (e.g., 6 in Figure 6
(b)). This is because jobs in a “burst” phase could be almost equally distributed among all the sites in the following cases: when K = 8 and the duration of a “burst” phase is short (e.g., around 2s), the jobs in this phase may be sent randomly to the top 8 sites in the first second and to the remaining 8 sites in the second seconds, leading to the similar results as the case that K = 16 and all jobs are sent randomly to 16 sites in two seconds. Therefore, we argue that the results shown in Figure 6 demonstrate that our algorithms ARA PREDhas more robustness, which provides a simple yet flexible knob for deciding the value ofK. In contrast, the static version described in Section III-A and the algorithm proposed in [9] require more efforts to tune the values of K, which is sophisticated when the workload is dynamically changed. D. Sensitivity Analysis on Experimental Parameters
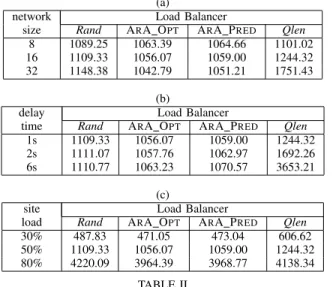
Now, we turn to analyze the effects of different experimental parameters on ARA PRED’s performance. We first focus on investigating the sensitivity of ARA to the network size (i.e., the number of computing sites) by evaluating job response time for N = 8,16, and 32. In all experiments, we scale the mean service times in order to fix the site utilization levels equal to 50%. All the other parameters are kept the same as the experiments shown in Figure 6. The performance results under the four algorithms are shown in Table II(a). These results first confirm that the conventional algorithms (e.g.,RandandQlen) poorly behave under all the three network sizes, and our new ARA ones improve the system performance by discriminating bursty periods from non-bursty ones. We also observe that as the system becomes larger (i.e.,N increases), jobs experience worse response times under the “greedy” and the “random” methods. But, such a performance trend disappears under the two ARA ones. We interpret that as the number of sites becomes larger, it is more likely forQlen(resp.Rand) to make wrong decisions for bursty (resp. non-bursty) traffic, resulting in more dramatic degradation on system performance. On the other hand, by online adjusting the values of K for bursty and non-bursty traffic, two ARA algorithms select the good sites for incoming jobs, which may have less loads (i.e., the number of queuing jobs) as the number of sites increases and thus reduce the waiting times for those jobs.
As the existence of delays in computing and communi-cating the site load information is critical to the algorithm performance, we investigate the sensitivity of load balancers to information query delay D. In this set of experiments, we fix all the other parameters, e.g.,N = 16and site utilization is 50%, but increaseDto2s and6s. The reason to setD= 6s is because the average duration of bursty periods is equal to 6s as well, which then provides an extreme case such that all jobs arriving during bursty periods are either sent to a single site or
(a)
network Load Balancer
size Rand ARA OPT ARA PRED Qlen
8 1089.25 1063.39 1064.66 1101.02 16 1109.33 1056.07 1059.00 1244.32 32 1148.38 1042.79 1051.21 1751.43
(b)
delay Load Balancer
time Rand ARA OPT ARA PRED Qlen
1s 1109.33 1056.07 1059.00 1244.32 2s 1111.07 1057.76 1062.97 1692.26 6s 1110.77 1063.23 1070.57 3653.21
(c)
site Load Balancer
load Rand ARA OPT ARA PRED Qlen
30% 487.83 471.05 473.04 606.62 50% 1109.33 1056.07 1059.00 1244.32 80% 4220.09 3964.39 3968.77 4138.34
TABLE II
SENSITIVE ANALYSIS OF SYSTEM PARAMETERS(A)NETWORK SIZE, (B)
DELAY TIME,AND(C)SITE LOAD ONARA PRED PERFORMANCE.
fully randomly sent to one of all sites in average. Table II(b) shows the performance results. First, different delay times do not affect the performance of the “random” algorithm because the candidate site is always selected randomly no matter how long the delay is. However, for the “greedy” algorithm, the performance becomes worse as the delay time increases. This is because more jobs in bursty periods are then sent together to the same site due to the outdated load information and thus the load of that particular site significantly increases, causing serious load unbalancing and bad performance. For both of the ARA algorithms, we observe again the performance improvement compared to the other two conventional ones. Also, the delay time has less impact on the ARA performance. This is because after detecting the start of bursty periods, ARA quickly shifts to the “random” scheme.
In order to understand the performance benefit of the algorithm when the system reaches critical congestion, we turn to analyze the impacts of utilization levels on ARA performance. We here conduct experiments with three different site utilization levels: 30%, 50% and 80% by scaling the mean service times, while keeping the other parameters fixed as the experiments shown in Figure 6. The performance measures provided by four load balancing algorithms are illustrated in Table II(c). We observe that both two ARA algorithms achieve better performance than the conventional ones (e.g.,Randand Qlen) across all three utilization levels.
In summary, the extensive experimentation produced in this section has validated that ARA using prediction information
can effectively improve the system performance, compared to the conventional load balancers which ignore the effects of burstiness in arrivals. The sensitivity results on network size, delay time, and system load have further demonstrated that the gains of ARA are visible in a variety of different conditions.
IV. CASESTUDY: AMAZONEC2
To further verify the effectiveness of our new load balancer, we implement and evaluate the ARA algorithms as well as the conventional ones (i.e.,RandandQlen) in Amazon EC2, a real
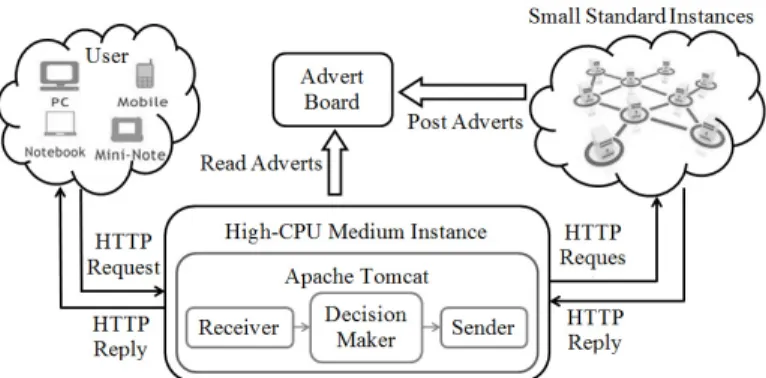
Fig. 7. The overview framework of our implementation in Amazon EC2.
cloud platform that provides pools of computing resources to developers for flexibly configuring and scaling their compute capacity on demand. Figure 7 illustrates the basic framework of our implementation in Amazon EC2.
In particular, we replace the Elastic Load Balancing (ELB) in Amazon EC2 with our load balancing (LB) service and then direct all the incoming application requests to this new LB service for load dispatch across multiple Amazon EC2 instances. This new LB service is then run at a High-CPU Medium Instance which provides five EC2 compute units for compute-intensive applications. We also lease 8 Small Stan-dard Instances as servers, each of which has one EC2 compute unit and 1.7GB memory by default. Such a configuration of instances aims to ensure that the system bottleneck is not our load balancer while the overall performance is dominated by the load balancing algorithms as well as the processing capability of each server instance.
We then conduct real experiments in Amazon EC2 by running microbenchmarks like the execution ofFibonacci
numbers. As illustrated in Figure 7, multiple users can simul-taneously send HTTP requests to our load balancer instance. Each HTTP request contains an URL, which includes a decision maker ID and the corresponding job size parameters. Once the load balancer receives an HTTP request, Apache Tomcat, an installed Java Servlet container, parses that re-quest’s header and then selects a server instance for serving that request according to the implemented load balancing al-gorithm. Here, on each of server instances, thesarcommand was run for measuring and reporting the CPU utilizations every 1 second to load balancer via advert board. The chosen server instance then calculates aFibonaccinumber and sends the result back to a client through the load-balancer instance.
Greedy Random Best 00 00 00 00 00 00 00 00 00 00 11 11 11 11 11 11 11 11 11 11 0 0.1 0.2 0.3 0.4 0.5 0.6 0.7 1 2 3 4 5 6 7 8 Response time (s) Number of Candidates (K)
Fig. 8. The average end-to-end response times underRand,Qlenand our online ARA where the small threshold ths is kept as1 while the large thresholdthlis changed from1to8.
In terms of evaluation, we measured end-to-end response
times (i.e., the duration between request submission and reply receiving) for the QoS assessment and monitored utilization levels at each site (or application instance) for the load balance assessment. Figure 8 presents the performance of the online ARA in our Amazon EC2 model, where burstiness was injected into the arrivals of HTTP requests. The results under both Qlen and Rand are also plotted in the figure. We observe that consistently to our simulations, none of the conventional load balancers (e.g., Qlen and Rand) is able to obtain good performance under bursty workload, while our online ARA algorithm achieves significant performance improvements by dynamically shifting between “greedy” and “random” according to the workload changes. The best per-formance under ARA is obtained whenK is equal to4 such that the relative improvements are 48% over Qlen and 50% over Rand, respectively. We also observe that the measured utilization levels at all 8 server instances are quiet close to each other, i.e., about41%in average, which indicates a good load balancing across multiple Amazon EC2 instances.
V. RELATEDWORK
Burstiness has been known as an important characteristic of traffic in communication networks [11], [12], [13], [14] and has fueled much research over the past two decades [15], [13]. Recently, the presence of burstiness has also been identified in a variety of settings, including enterprise systems [2], [16], grids [1], storage systems [17], [18] and file systems [19]. The impact of burstiness on system performance has been examined and reported in [20], [21], [2].
In resource-sharing environments, such as grids and clouds, a privileged resource management system is designated to manage how these resources are used. LoadLeveler [22], PBS [23], LSF [24], NQS [25], Maui [26] and Condor [27] are the most commonly used resource management systems. These systems manage computing resources within a single administrative domain. Loadleveler, PBS, and LSF can allocate resources in a parallel system running a homogeneous oper-ating system. Condor is designed for a distributed computing environment with non-dedicated resources that can be shared with local users while processing computational requests from remote users. Nimrod/G [28] is a resource management and scheduling system based on the Globus Toolkit. It targets applications that involve a large number of task executions and a range of parameters.
In cloud computing systems, users pay to lease a collection of virtual machines that are used to execute applications. These virtual machines are assigned to physical resources so as to achieve certain goals. These goals may include satisfying users’ resource requirements and computational de-mands, minimizing application latency, or maximizing appli-cation throughput. [29] evaluated conservative, selective, and aggressive backfill cloud scheduling algorithms by comparing computing the performance/cost ratio for each algorithm. Other market-based scheduling algorithms have been proposed to manage cloud resources [30]. However, we notice that none of the above studies research resource management in cloud systems by taking account of the performance impact of burstiness.
A dynamic load balancing scheme was proposed by Mitzen-macher in [9] which considers the supermarket model such that customers can randomly choose a constant number of servers and waits for service at the one with the fewest customers. Via theoretical justification and simulations, the author shows that two or a small number of choices can produce exponential improvements. We notice that this approach [9] is the closest one to our work presented in this paper. However, it only con-siders the Poisson arrival streams as well as the exponentially distributed service time and the fixed number of choices (i.e., servers). On the other hand, we provide a method of adjusting the number of candidates depending on the measurement of traffic burstiness.
VI. CONCLUSION ANDFUTUREWORK
In this paper, we have described our new adaptive load bal-ancing algorithms for clouds under bursty workloads. Our new static ARA algorithm tunes the load balancer by adjusting the trade-off between randomness and greediness in the selection of sites. While this approach gives very good performance, tuning the algorithm can be difficult. We therefore proposed our new online ARA algorithm that predicts the beginning and the end of workload bursts and automatically adjusts the load balancer to compensate. We show that the online algorithm gives good results under a variety of system settings. This approach is more robust than the static algorithm, and does not require the algorithm parameters to be carefully tuned. We conclude that an adaptive, burstiness-aware load balancing algorithm can significantly improve the performance of cloud computing systems.
REFERENCES
[1] H. Li and M. Muskulus, “Analysis and modeling of job arrivals in a production grid,”SIGMETRICS Perform. Eval. Rev., vol. 34, no. 4, pp. 59–70, 2007.
[2] N. Mi, Q. Zhang, A. Riska, E. Smirni, and E. Riedel, “Performance impacts of autocorrelated flows in multi-tiered systems,”Perform. Eval., vol. 64, no. 9-12, pp. 1082–1101, 2007.
[3] A. Riska and E. Riedel, “Disk drive level workload characterization,” in
USENIX Annual Technical Conference, General Track 2006, 2006, pp. 97–102.
[4] “CSIM19 development toolkit for simulation and modeling,” http://www.mesquite.com, 2005.
[5] J. Zhang, N. Mi, J. Tai, and W. Meleis, “Decentralized scheduling of bursty workload on computing grids,” inIEEE International Conference on Communications (ICC), 2011.
[6] M. F. Neuts,Structured Stochastic Matrices of M/G/1 Type and Their Applications. New York: Marcel Dekker, 1989.
[7] D. Cox and P. Lewis,The Statistical Analysis of Series of Events. New York: John Wiley and Sons, 1966.
[8] R. Gusella, “Characterizing the variability of arrival processes with indexes of dispersion,”IEEE JSAC, vol. 19, no. 2, pp. 203–211, 1991. [9] M. Mitzenmacher, “The power of two choices in randomized load balancing,”IEEE Trans. Parallel Distrib. Syst., vol. 12, pp. 1094–1104, October 2001.
[10] A. Caniff, L. Lu, N. Mi, L. Cherkasova, and E. Smirni, “Fastrack for taming burstiness and saving power in multi-tiered systems,” in
Proceedings of the 22nd International Teletraffic Congress (ITC’10), Amsterdam, The Netherlands, 2010.
[11] M. E. Crovella and A. Bestavros, “Self-similarity in world wide web traffic: evidence and possible causes,” inSIGMETRICS. ACM Press, 1996, pp. 160–169.
[12] R. L. Cruz, “Service burstiness and dynamic burstiness measures: A framework,”Journal of High Speed Networks, vol. 1, no. 2, 1992. [13] W. E. Leland, M. S. Taqqu, W. Willinger, and D. V. Wilson, “On
the self-similar nature of Ethernet traffic,”IEEE/ACM Transactions on Networking, vol. 2, pp. 1–15, 1994.
[14] V. Paxson and S. Floyd, “Wide-area traffic: the failure of Poisson modeling,”IEEE/ACM Transactions on Networking, vol. 3, no. 3, pp. 226–244, Jun. 1995.
[15] G. Banga and P. Druschel, “Measuring the capacity of a Web server,” inProceedings of USITS, Monterey, CA, Dec. 1997.
[16] N. Mi, G. Casale, L. Cherkasova, and E. Smirni, “Burstiness in multi-tier applications: Symptoms, causes, and new models,” in
ACM/IFIP/USENIX 9th International Middleware Conference (Middle-ware’08), Leuven, Belgium, 2008, pp. 265–286.
[17] A. Riska and E. Riedel, “Long-range dependence at the disk drive level,” in QEST ’06: Proc. of the Third International Conference on the Quantitative Evaluation of Systems. Riverside, CA, USA: IEEE Computer Society, 2006, pp. 41–50.
[18] B. Schroeder and G. A. Gibson, “Understanding disk failure rates: What does an mttf of 1,000,000 hours mean to you?”ACM Trans. on Storage, vol. 3, no. 3, p. 8, 2007.
[19] S. D. Gribble, G. S. Manku, D. Roselli, E. A. Brewer, T. J. Gibson, and E. L. Miller, “Self-similarity in file systems,” inProceedings of the ACM SIGMETRICS. ACM Press, 1998, pp. 141–150.
[20] A. M. Adas and A. Mukherjee, “On resource management and QoS guarantees for long range dependent traffic.” inINFOCOM, 1995, pp. 779–787.
[21] A. Erramilli, O. Narayan, and W. Willinger, “Experimental queueing analysis with long-range dependent packet traffic,” IEEE/ACM Trans. Netw., vol. 4, no. 2, pp. 209–223, 1996.
[22] I. Corporation, “IBM loadleveler,”User’s Guide, 1993.
[23] R. Henderson and D. Tweten, “Portable batch system: External reference specification,”Technical report, NASA, Ames Research Center, 1996. [24] S. Zhou, “LSF: Load sharing in large-scale heterogeneous distributed
systems,” inProc. Workshop on Cluster Computing, 1992.
[25] S. Herbert, “Official administrators guide to generic nqs,” September 1994.
[26] D. B. Jackson, Q. Snell, and M. J. Clement, “Core algorithms of the maui scheduler,” in JSSPP ’01: Revised Papers from the 7th International Workshop on Job Scheduling Strategies for Parallel Processing, 2001, pp. 87–102.
[27] M. Litzkow, M. Livny, and M. Mutka, “Condor - a hunter of idle workstations,” in Proceedings of the 8th International Conference of Distributed Computing Systems, June 1988.
[28] R. Buyya, D. Abramson, and J. Giddy, “Nimrod/G: An architecture of a resource management and scheduling system in a global computational grid,” inProceedings of the Fourth International Conference Exhibition on HPC in the Asia-Pacic Region, vol. 1, 2000, pp. 283–289. [29] M. de Assuncao, A. di Costanzo, and R. Buyya, “Evaluating the
cost-benefit of using cloud computing to extend the capacity of clusters,” in
HPDC ’09: Proceedings of the 18th ACM international symposium on High performance distributed computing, 2009, pp. 141–150. [30] G. Singh, C. Kesselman, and E. Deelman, “Adaptive pricing for resource
reservations in shared environments,” inGRID ’07: Proceedings of the 8th IEEE/ACM International Conference on Grid Computing, 2007, pp. 74–80.