Remote Monitoring of Fatigue Cracks Growth in the Aircraft Structure
Based on Active Piezosensor Network During the Full Scale Fatigue
Test
Krzysztof Dragan
1, 2, a,*
,
Michal Dziendzikowski
2,b, Tadeusz Uhl
1,c,
Tadeusz Stepinski
1,d1
AGH University of Science and Technology, al. Mickiewicza 30, 30-059 Krakow, Poland
2Air Force Institute of Technology, ul. Ks. Boleslawa 6, 01-494 Warszawa, Poland
a[email protected], b[email protected], c[email protected],d[email protected],
*corresponding author
Keywords: structural health monitoring, fatigue cracks monitoring, remote monitoring, damage size estimation, piezosensor networks
Abstract. One of the major issues from a structural integrity point of view of the aircraft structure is an appropriate health monitoring technology delivery for the damage tolerant philosophy. This paper presents a development of a system for fatigue crack growth monitoring and early damage detection in the PZL – 130 ORLIK TC II turbo-prop military trainer aft structure. The maintenance system of the aircraft shifts from the safe-life to the hard-time. The aircraft started Full Scale Fatigue Test (FSFT) which will continue up to 2013. In the article a built block approach for the system design, signal modeling, sensing and signal processing as well as damage detection is presented. Taking into the consideration a previous experience of AGH as well as AFIT, a network of PZT transducers was deployed in the aircraft structure hot-spots. The system components are: remote monitoring unit, signal analysis, graphical user interface, sensor self-diagnostic tools, and data classification model. Description of damage detection capabilities are delivered in the paper. In particular some issues concerning the proposed damage indices and its application to crack growth estimation models are discussed. Fisher’s Linear Discriminant is used as a method to obtain effective crack growth predictors and one of the self-diagnostic tools used in the system. The results of the data collected from specimen fatigue tests are delivered and cross-validation technique is used to evaluate a classification model based on the damage indices derived.
Introduction
In the article the results of the R&D work (part of the SYMOST project) connected with the development of a health monitoring technology for an aircraft structure is delivered. The structure where system was implemented is the military turbo prop aircraft PZL Orlik TC II used for preliminary training of pilots. The aircraft undergo the full scale fatigue test. That test opens an opportunity for a SHM system installation for selected aircraft ‘hot spot’ locations monitoring as well as early damage detection. The article presents an approach for remote constant monitoring of the aircraft structure during the test. One of the major issues for such system implementation is elaboration of the signal processing techniques which deliver the possibility of the: self diagnostics of the sensors network, damage detection capability (including statistical inference), automated classification for the damage intervals (important from the point of view damage tolerance). Furthermore article presents concept of such system and schematically presents location of the sensor nodes in the aircraft. The statistical techniques of inference and damage classification was verified during fatigue tests of the aircraft panels. Selected results from the elaborated statistical models are presented in the article. In accordance to related standards all the tests and damage detection activities are verified with the use of NDT techniques used for maintenance and in service aircraft inspection.
All rights reserved. No part of contents of this paper may be reproduced or transmitted in any form or by any means without the written permission of TTP, www.ttp.net. (ID: 149.156.115.121-08/11/13,14:51:00)
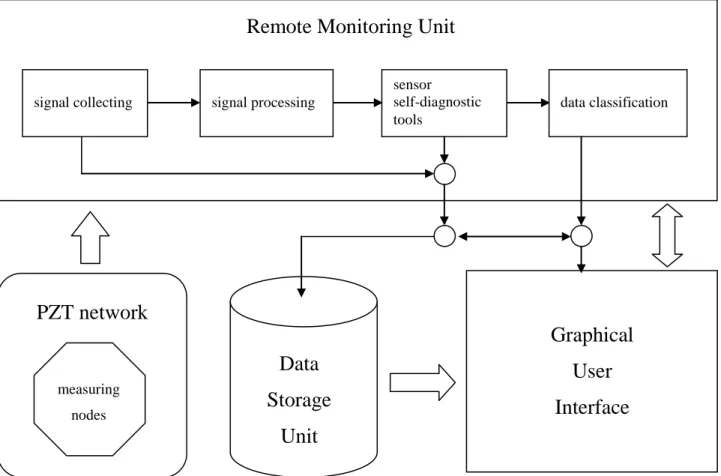
Figure 1: System block diagram.
System Design Scheme
A brief overview of SHM system for fatigue crack growth monitoring is presented in the following section. The system building blocks are schematically presented on the figure (Fig. 1). These are:
PZT network divided into several measuring nodes;
Remote Monitoring Unit (RMU) – based on DSP architecture CPU;
Data Storage Unit (DSU);
Graphical User Interface (GUI).
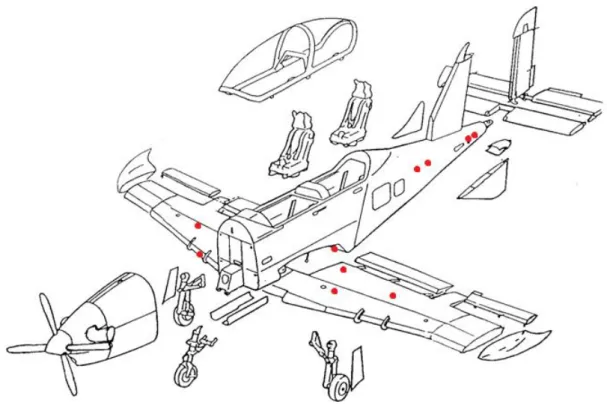
Selected part of the aircraft structure ‘hot-spots’ where measuring nodes were deployed are presented on the figure (Fig. 2). The core of the RMU consists of four subsequent routines:
- signal collecting and its storage in DSU if indicated by sensor self-diagnostics component (Fig. 1);
- signal processing based on several signal Damage Indices (DI’s) correlated with the fatigue crack growth;
- sensor self-diagnostic component validating the PZT network, e.g. noise detection, sensors’ surface coupling strength, significant sensor working conditions changes detection;
- data classification methods for damage growth assessment.
One of the key issues in applying of PZT based monitoring systems to structures used in aerospace is to ensure sensor network durability in extremely varying environmental conditions. Thus a network self-diagnostic tools allowing for signal decoherence tracking in time is a vital component for any such application. Furthermore the most of data classification models are sensitive to outlying observations, therefore efficient sensor self-diagnostic prior to crack growth assessment is
signal collecting
Remote Monitoring Unit
signal processing sensor self-diagnostic tools data classification
Data
Storage
Unit
Graphical
User
Interface
PZT network
measuring nodesFigure 2: Selected aircraft structure hot-spots.
crucial for proper system working, e.g. misclassification avoidance. In the proposed approach signals which not pass sensor integrity check are stored in DSU for further expert assessment as depicted on the figure (Fig. 1).
Signal Analysis
Signals received by network transducers can be influenced by many factors. Apart from environmental conditions, whose variability should be compensated, significant difference in a signal can be also caused by relative geometry changes of a node, e.g. the damage localization and its orientation with respect to sensors of the node. Statistical methods of classification and regression need all important factors to be controlled in order to obtain accurate predictions. Initial stage of structural damage development leads to local signal changes which can be very subtle. Therefore some models of damage detection are based on signal per se, utilizing the full information what it carries [1-4]. In such approaches a broad class of signal transformations is considered, providing a method to derive the most optimal damage indices. The damage indices obtained in this way are finely tuned to a particular problem considered, e.g. damage presence at a given location, which is one of the major disadvantages of such models.
In the adopted approach the following damage indices (DI’s), carrying marginal signal information content are proposed:
, 1 1 , (| | | |) symmetric characteristic ( , ) gs gs b , gs b f f dt DI g L s f dt
(1)
2 2 , 2 2 2 , symmetric characteristic ( , ) , gs gs b gs b dt f L f DI g s f dt
3where fgs denotes a signal generated in the transducer g and received in the sensorsat the current state of the structure and fgs b, denotes the baseline signal. Similar DI’s can be defined based on signal envelope, its Fourier transform, and other signal transformations. These DI’s are correlated with the total energy received by a given sensor therefore can capture the two main modes of guided wave interaction with a fatigue crack. Low information content carried by those DI’s, makes them more persistent under varying sensor working conditions. This should improve the false calls ratio of the system.
Classification and Sensor Self-diagnostic Methods.
The damage indices proposed in the previous section (Eq. 1) still depend on the damage location, since they are calculated for a sensing path gs, given by a generator g and a sensor s. In order to overcome this problem the Averaged Damage Indices (ADI’s) can be defined [5]:
, : 1 : ( , ), ( 1) j j g s g s ADI DI g s n n
(2)where n is the number of transducers in a network measurement node. Averaged damage indices (ADI’s) are less dependent on the damage localization which makes them better suited for damage size estimation. These indices remain structure quantification possibility also in the case of improper functioning of several transducers of the network. The procedure of averaging (Eq. 2) is highly sensitive to outlying observations, emphasizing the importance of the sensor self-diagnostic component of the system.
Relying on the ADI’s defined above (Eq.2) effective fatigue crack growth predictors can be obtained by means of statistical dimensional reduction methods, e.g. Principal Component Analysis (PCA) or Fisher’s Linear Discriminant (FLD) [6]. These techniques can be also used for signal characteristics efficiency evaluation. The both techniques were used in the context of PZT based SHM systems [7-10]. In the system presented the FLD method is applied.
Given a high dimensional problem, e.g. SHM system based on many DI’s, dimensional reduction methods are supposed to provide such combinations of considered variables, e.g. DI’s, that resulting variables, separate the best the data corresponding to different classes, e.g. severity of structural damage. Emerged variables, called predictors, allow for efficient evaluation of a monitored structure. The methods differs in the choice of the data separation measure, which is to be maximized. In the approach proposed, FLD based efficient linear predictors diare of the form
1 D j i i j j d n ADI
, (3)where D is the number of signal characteristics considered and n iij, 1,,K1 are components of orthogonal directions subsequently maximizing K class separation magnitude S. In the system considered, classes correspond to the crack length intervals. The class separation S along a given direction nis defined as ) ( T b T w S n n n n n, (4)
where b, ware between and within class covariance matrices respectively [6]. Typically values of these coefficients corresponding to different ADI’s significantly differs, providing a measure of effectiveness of the characteristics used (Eq. 1). Denoting as nia dominating components of directions nithe effective Averaged Damage Indices (eADI’s) can be considered
.
a
i i a
a
eADI
n ADI (5)Since eADI’s correspond to few signal characteristics they are easier to interpret comparing to the predictors di (Eq. 3) while they still preserve data separation property. Some of the proposed ADI’s are defined by linear signal transformations therefore some of the effective averaged damage indices eADI’s given above can be highly correlated. In this case they usually correspond to the same signal characteristic but with different weights nia assigned to signal transformation, e.g. Fourier filtering. Observations distorted by noise or originated from faulty generators resulting in particular in different spectrum of the received signal are outlying from the correlation line and therefore can be dropped out providing a sensor network self diagnostic tool.
The best Fisher’s predictor (Eq. 3) or their effective counterparts (Eq. 5) can be used for data classification. In this paper the nearest neighbor (NN) method is considered [6]. Classification regions for nearest neighbor model are calculated in the space spanned by a given number of predictors (Eq. 3, Eq. 5) by determining the most frequent class of k samples from the training dataset which are the nearest to a fixed data point.
Figure 3: Test specimen.
The Results
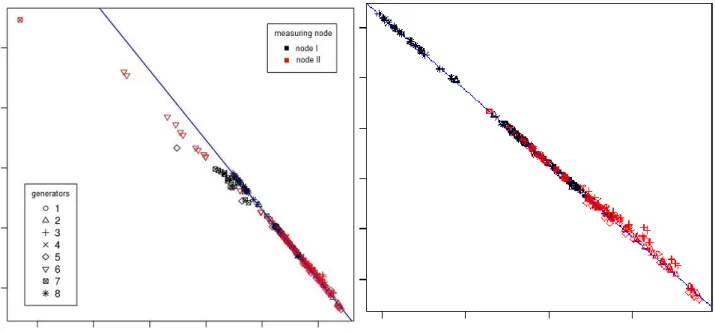
The SHM system outlined in the previous sections was verified on aircraft skin panel containing riveted joints, substructures and other wave reflectors (Fig. 3). A PZT network containing two measuring nodes (with 4 transducers each) was deployed in the structure. Measurements were performed at three different stress levels. A sensor self-diagnostic method introduced in the previous section was applied. Effective Fisher’s discriminants were calculated for partially averaged damage indices (pADI’s):
Figure 4: Sensor self-diagnostic tool. The data before (left) and after filtering (right). : 1 ( ) ( , ) ( 1) j j s s g pADI g DI g s n
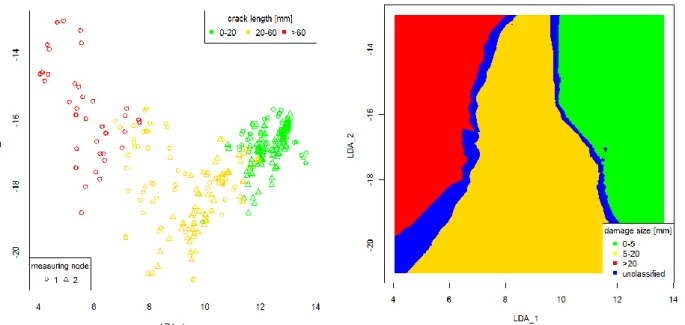
, (6)and two correlated effective indices were chosen for self-diagnostic purposes. Observations originated from generator no 7 as well as some excitations from generator no 5 and 6 are outlying from the correlation line and therefore were dropped out (Fig. 4). Partially averaged damage indices (Eq. 6) were then averaged also with respect to generators (Eq. 2) and FLD method was again applied, providing Fisher’s predictors LDA_1, LDA_2, LDA_3 well separating the data corresponding to different crack lengths (Fig. 5).
Figure 6: The best data separating Fisher’s predictors (left) and corresponding nearest neighbor classifier (right).
Two the most efficient Fisher’s linear predictors as well as classification regions of nearest neighbor model are presented on the figure (Fig. 6). The NN model was obtained using 20 neighboring points and the classification was made on the basis of absolute majority. The domains where the number of single class training data points contained in the neighborhood is not sufficient, and the classification was not possible are marked in blue. The efficiency of this model was verified with use of 5-fold cross-validation method [6] (Tab. 1) obtaining damage size classification probability for different crack length intervals.
Table 1: Cross-validation results of nearest neighbor model.
Since classification regions of undamaged (0-20mm crack length) and severely damaged (>60 mm crack length) are well separated (Fig. 6) there is no risk of type II misclassification which is preferred from the operational safety perspective. Measurements were performed at different levels of stress distribution. Under high loads changes of Fisher’s predictors LDA_1, LDA_2 for smaller cracks are comparable to those obtained for longer cracks under free ends conditions. This yielded misclassification probabilities between second (20-60 mm cracks) and third class (>60 mm cracks) of the damage severity.
Summary
In the article an approach for development of a SHM system built for a real aircraft structure is delivered. That include the concept of the system, deployment of the sensors network in the aircraft, remote monitoring of the structure of the aircraft as well as the structural elements. The main part of such system are the proper mathematical methods for the damage detection and classification of the damage presence as well as the damage size. Methods proposed in the article were verified during
Probability of classification into crack length interval 0 – 20 [mm] 20 – 60 [mm] > 60 [mm] Dam ag e 0 – 20 [mm] 0.95÷0.99 0.01÷0.05 0 20 – 60 [mm] 0.05÷0.17 0.81÷0.95 0.00÷0.04 > 60 [mm] 0 0.03÷0.30 0.70÷0.97
the tests and will be employed in the system software. There are still tests in progress and a further validation of the elaborated methods will be proceeded. The results of the tests are promising for further development of the concept of the system especially from the point of view sensors technology integration with the structure as well as the methods for data classification and system’s self diagnostic.
Acknowledgments
We would like to thank very much the NCBIR for the supporting of the work which has to be realized under the LIDER project LIDER/25/43/L-2/10/NCBiR/2011 based on the agreement from the 09.08.2011 r.
References
[1] L. E. Mujica, J. Rodellar, A. Fernandez, A. Guemes, Q-statistic and T2-statistic PCA-based measures for damage assessment in structures, Struct. Health Monit. Vol. 10(5) (2010), p. 539.
[2] F. Gharibnezhad, L. E. Mujica, J. Rodellar, C.-P. Fritzen, Damage detection using robust fuzzy principal component analysis, Proceedings of the sixth European workshop on Structural Health Monitoring Vol.2, Dresden, Germany, July 3–6, 2012.
[3] I. Buethe, M.A. Torres-Arredondo, L.E. Mujica, J. Rodellar, C.P. Fritzen, Damage detection in piping systems using pattern recognition techniques, Proceedings of the sixth European workshop on Structural Health Monitoring Vol.2, Dresden, Germany, July 3–6, 2012.
[4] D. A. Tibaduiza, L. E. Mujica, M. Anaya, J. Rodellar, A. Güemes, Principal Component Analysis vs. Independent Component Analysis for Damage Detection, Proceedings of the sixth European workshop on Structural Health Monitoring Vol.2, Dresden, Germany, July 3– 6, 2012.
[5] K. Dragan, M. Dziendzikowski, T. Uhl, The development of the non-parametric classification models for the damage monitoring on the example of the ORLIK aircraft structure, Key Eng. Mat. Vol. 518 (2012), p. 358.
[6] T. Hastie, R. Tibshirani, J. Friedman: The Elements of Staistical Learning: Data Mining, Inference, and Prediction, second ed., Springer Science+Business Media, New York, 2009. [7] H. Sohn, J.A. Czarnecki, C.R. Farrar, Structural health monitoring using statistical process
control, J. Struct. Eng. Vol. 126(1) (2000), p. 1356.
[8] P. De Boe, J.C. Golinval, Principal component analysis of a piezosensor array for damage localization, Struct. Health Monit. Vol. 2(2) (2003), p. 137.
[9] K. Dragan, M. Dziendzikowski, T. Uhl, L. Ambrozinski, Damage detection in the aircraft structure with the use of integrated sensors – the SYMOST project, Proceedings of the sixth European workshop on Structural Health Monitoring Vol.2, Dresden, Germany, July 3–6, 2012.
[10] M. Dziendzikowski, K. Dragan, Damage size estimation with active piezosensor network, Proceedings of the sixth European workshop on Structural Health Monitoring Vol.2, Dresden, Germany, July 3–6, 2012.
Remote Monitoring of Fatigue Cracks Growth in the Aircraft Structure Based on Active Piezosensor Network during the Full Scale Fatigue Test