Aerosolized Polymyxin B for Treatment
of Respiratory Tract Infections:
Determination of
Pharmacokinetic-Pharmacodynamic Indices for
Aerosolized Polymyxin B against
Pseudomonas aeruginosa
in a Mouse
Lung Infection Model
Yu-Wei Lin,
aQi Zhou,
bNikolas J. Onufrak,
cVeronika Wirth,
dKe Chen,
dJiping Wang,
dAlan Forrest,
cHak-Kim Chan,
aJian Li
eAdvanced Drug Delivery Group, Faculty of Pharmacy, The University of Sydney, Sydney, New South Wales, Australiaa; Department of Industrial and Physical Pharmacy, College of Pharmacy, Purdue University, West Lafayette, Indiana, USAb; Department of Pharmacotherapy and Experimental Therapeutics, Eshelman School of Pharmacy, The University of North Carolina, Chapel Hill, North Carolina USAc; Drug Delivery, Disposition and Dynamics, Monash Institute of Pharmaceutical Sciences, Monash University (Parkville Campus), Parkville, Victoria, Australiad; Biomedicine Discovery Institute, Department of Microbiology, Monash University, Clayton, Victoria, Australiae
ABSTRACT
Pulmonary administration of polymyxins is increasingly used for the
treat-ment of respiratory tract infections caused by multidrug-resistant Gram-negative
bacte-ria, such as those in patients with cystic fibrosis. However, there is a lack of
pharmacoki-netics (PK), pharmacodynamics (PD), and toxicity data of aerosolized polymyxin B to
inform rational dosage selection. The PK and PD of polymyxin B following pulmonary
and intravenous dosing were examined in neutropenic infected mice, and the data were
analyzed by a population PK model. Dose fractionation study was performed for total
daily doses between 2.06 and 24.8 mg base/kg of weight against
Pseudomonas
aerugi-nosa
ATCC 27853, PAO1, and FADDI-PA022 (MIC of 1 mg/liter for all three strains).
Histo-pathological examination of the lung was undertaken at 24 h posttreatment in both
healthy and neutropenic infected mice. A two-compartment PK model was required for
both epithelial lining fluid (ELF) and plasma drug exposure. The model consisted of
cen-tral and peripheral compartments and was described by bidirectional first-order
distribu-tion clearance. The ratio of the area under the curve to the MIC (AUC/MIC) was the most
predictive PK/PD index to describe the antimicrobial efficacy of aerosolized polymyxin B
in treating lung infections in mice (
R
2of 0.70 to 0.88 for ELF and 0.70 to 0.87 for
plasma). The AUC/MIC targets associated with bacteriostasis against the three
P.
aerugi-nosa
strains were 1,326 to 1,506 in ELF and 3.14 to 4.03 in plasma. Histopathological
re-sults showed that polymyxin B aerosols significantly reduced lung inflammation and
preserved lung epithelial integrity. This study highlights the advantageous PK/PD
charac-teristics of pulmonary delivery of polymyxin B over intravenous administration in
achiev-ing high drug exposure in ELF.
KEYWORDS
polymyxins, respiratory tract infections, pulmonary administration,
Pseudomonas aeruginosa
, antibiotic resistance, Gram-negative bacteria
T
he emergence of multidrug-resistant (MDR) Gram-negative bacteria, such as
Pseu-domonas aeruginosa
, represents a major public health threat globally (1).
Polymyx-ins are considered the last-line therapeutic option for these MDR Gram-negative
Received3 February 2017Returned for modification2 April 2017Accepted20 May 2017
Accepted manuscript posted online30 May 2017
CitationLin Y-W, Zhou Q, Onufrak NJ, Wirth V, Chen K, Wang J, Forrest A, Chan H-K, Li J. 2017. Aerosolized polymyxin B for treatment of respiratory tract infections: determination of pharmacokinetic-pharmacodynamic indices for aerosolized polymyxin B against
Pseudomonas aeruginosain a mouse lung infection model. Antimicrob Agents Chemother 61:e00211-17.https://doi.org/10 .1128/AAC.00211-17.
Copyright© 2017 American Society for Microbiology.All Rights Reserved. Address correspondence to Hak-Kim Chan, [email protected], or Jian Li, [email protected].
PHARMACOLOGY
pathogens (2, 3). Polymyxins are a class of multicomponent, polypeptide antibiotics,
and there are two polymyxins available in the clinic, polymyxin B and colistin (i.e.,
polymyxin E), which differ by only an amino acid (4). Both polymyxins display similar
in
vitro
pharmacodynamic (PD) properties (4). However, in clinical practice colistin is
administered in the form of an inactive prodrug, colistin methanesulfonate (CMS),
which subsequently converts to colistin
in vivo
(5), while polymyxin B is parenterally
administered in its pharmacologically active sulfate salt form (6). They substantially
differ in their plasma pharmacokinetic (PK) properties following intravenous
adminis-tration in critically ill patients (2, 7–11). In patients with cystic fibrosis, the maximum
plasma concentration (
C
max, Plasma) of formed colistin following parenteral CMS (150 mg
colistin base activity) ranged from 0.40 to 0.77 mg/liter (12). Even when a CMS loading
dose is utilized, optimal plasma concentrations of formed colistin cannot be rapidly
achieved (9, 13). Conversely, intravenous infusion of polymyxin B allows rapid
attain-ment of relatively higher plasma concentrations (2.38 to 13.9 mg/liter) (13, 14).
Al-though PK of polymyxin B in plasma following intravenous administration has been
examined previously, very limited PK data are available for polymyxin B in epithelial
lining fluid (ELF) following pulmonary or intravenous administration.
To date, the clinical use of polymyxins has been focused on parenteral
administra-tion (3, 15, 16). Only recently has the importance of aerosolized polymyxins for the
treatment of respiratory tract infections started attracting significant interest (17–24).
The majority of current preclinical and clinical PK/PD data for aerosolized polymyxins
focus on CMS/colistin (12, 19, 21, 22, 25–27), although aerosolized polymyxin B has also
been used in the clinic (28). There is currently a lack of reliable PK data of aerosolized
polymyxin B to guide the dosage selection of inhalational therapy. As the systemic PK
differ between the two polymyxins, it is important to examine the PK/PD of polymyxin
B after pulmonary administration to maximize its efficacy while minimizing toxicity and
development of resistance. Our study aimed to investigate the PK of aerosolized
polymyxin B in a neutropenic mouse lung infection model. The population PK model
enabled a better and quantitative understanding of polymyxin B disposition in ELF and
plasma following both pulmonary and intravenous administration. Furthermore, this
study aimed to identify the most predictive PK/PD index of polymyxin B that describes
its efficacy against
P. aeruginosa
and to determine the magnitudes of the PK/PD index
associated with different killing effects. Finally, the safety of aerosolized polymyxin B
was assessed by histopathological examination of lung tissues.
RESULTS
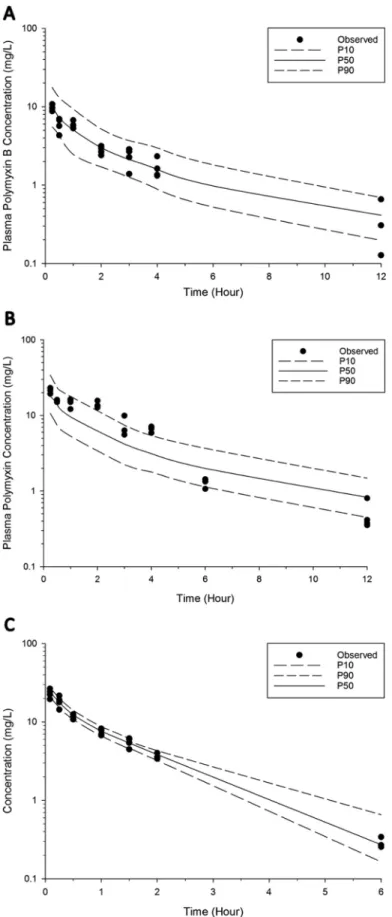
PK of polymyxin B following intravenous and pulmonary administration.
Figure 1
shows the concentration-time profiles of polymyxin B following intravenous
adminis-tration of 4.12 mg base/kg of body weight polymyxin B and pulmonary adminisadminis-tration
of 4.12 and 8.24 mg base/kg polymyxin B. An average unbound fraction of 0.046
(unpublished data; methods are provided in the supplemental material) was used to
generate the corresponding unbound polymyxin B concentration-time profiles (Fig. 1B).
Intravenous administration of polymyxin B resulted in an average free plasma
concen-tration of 1.07
⫾
0.14 mg/liter at 5 min after administration and declined rapidly (Fig.
1). Following pulmonary administration of 4.12 or 8.24 mg base/kg polymyxin B, the
maximum ELF concentration (
C
max, ELF) was 107.0
⫾
24.6 mg/liter or 184.0
⫾
35.1
mg/liter, and the concentration was quantifiable over the 12-h sampling time (Fig. 1A
and Table 1). After inhalation, polymyxin B was rapidly absorbed into the systemic
circulation with a time to peak plasma concentration (
T
max) of 15 min and
fC
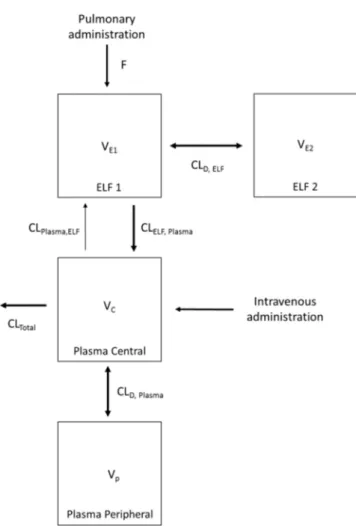
max, Plasmathe final PK analysis (refer to Fig. 1 for the outliers). Overall, a two-compartment model
was required to describe polymyxin B PK in both ELF and plasma following pulmonary
and intravenous administrations (Fig. 4). The PK model estimated parameters are
presented in Table 2. The model consisted of a central plasma compartment connected
to a peripheral plasma compartment, with bidirectional transfer via first-order
distri-bution clearance term (CL
D, Plasma). The rate of polymyxin B transfer from the ELF1
compartment to the central plasma compartment was bidirectional and described by
two first-order clearance terms, CL
Plasma, ELF(1.14
⫻
10
⫺4liters/h/kg; standard error [SE]
of 4.69%) and CL
ELF, Plasma(4.08
⫻
10
⫺3liters/h/kg; SE of 6.18%). Only the unbound
fraction was assumed to be shared between central and peripheral plasma
compart-ments, and the unbound fraction in plasma was fixed to 0.046. The low rate of transfer
(CL
Plasma, ELFof 1.14
⫻
10
⫺4liters/h/kg) from the central plasma compartment to the
ELF1 compartment was adequate to explain the negligible ELF exposure after
intrave-FIG 1(A) Polymyxin B ELF concentration-time profiles following pulmonary (i.e., intratracheal [I.T.]) administration of 4.12 and 8.24 mg base/kg polymyxin B. The polymyxin B ELF concentration following intravenous (I.V.) administration was below the LOQ. (B) Total and unbound plasma polymyxin B concentration-time profiles after pulmonary (4.12 and 8.24 mg base/kg) and intravenous (4.12 mg base/kg) administration of polymyxin B in neutropenic lung-infected mice. Each symbol represents the means ⫾standard deviations (SD) (n ⫽3 or more). Six data points were excluded from the final population PK model. Data enclosed in circles were identified as potential outliers.nous administration. Elimination from the biological system is described by a linear
first-order total clearance (CL
Totalof 3.54 liters/h/kg; SE of 0.48%) and originates only
from the central plasma compartment. The estimated bioavailability after pulmonary
administration was 99.3% (SE of 6.89%) (Table 2).
TABLE 1PK parameters for polymyxin B following pulmonary and intravenous administration in neutropenic infected mice
Parameter and sample source
Value after single dose
Pulmonary Intravenousa
4.12 mg base/kg 8.24 mg base/kg 4.12 mg base/kg ELF
Cmax, ELF(mg/liter) 107⫾24.6 184⫾35.1 NA
AUCELF(mg · h/liter) 601 1,203 ⬍LOQ
Plasma
fCmax, Plasma(mg/liter) 0.46⫾0.04 1.00⫾0.08 NA
Tmax(min) 15 15 NA
fAUCPlasma(mg · h/liter) 1.10 2.25 1.10
aNA, not applicable.
FIG 3Visual predictive checks for polymyxin B in plasma following pulmonary administration of 4.12 mg base/kg (A) and 8.24 mg base/kg (B) and intravenous administration of 4.12 mg base/kg (C). The solid line represents the median model-predicted concentrations (P50); the broken lines represent the model predicted 10th (P10) and 90th (P90) percentiles. The solid dots represent the observed concentrations. Six data points were excluded from the final population PK model.
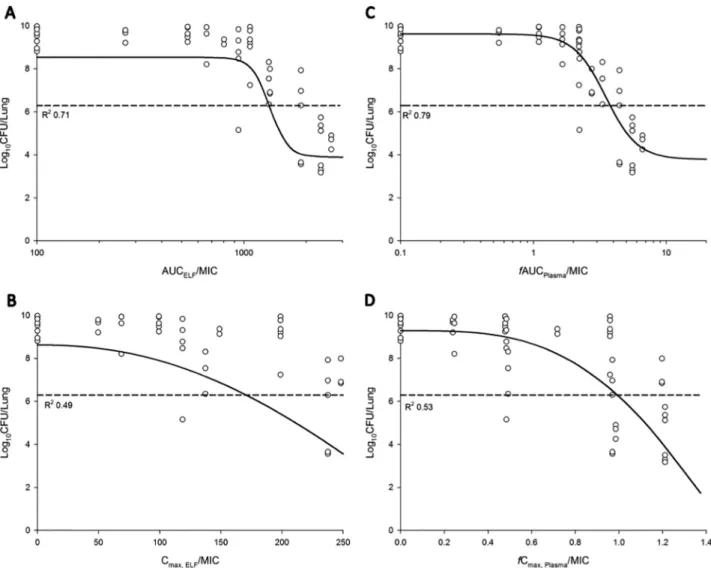
PK/PD of aerosolized polymyxin B.
The relationship between the ratio of the area
under the curve to the MIC (AUC/MIC) and the ratio of
C
maxto MIC (
C
max/MIC) in ELF
or plasma and the bacterial load at 24 h is presented in Fig. 5. Based on the
R
2value
and the dispersion of the observed data around the fitted function, AUC/MIC in ELF
(AUC
ELF/MIC) and
f
AUC/MIC in plasma (
f
AUC
Plasma/MIC) was the most predictive of
antimicrobial efficacy for all three tested
P. aeruginosa
strains (Table 3). The values of
AUC/MIC associated with bacteriostasis and 1-log
10and 2-log
10kills are presented in
FIG 4Schematic representation of the population PK model describing the disposition of polymyxin B following intravenous and pulmonary administration in neutropenic lung-infected mice.
TABLE 2Population PK parameter estimates for unbound polymyxin B after pulmonary and intravenous administration in neutropenic infected mice
Parameter Description Unit Estimated value SEa(%)
VE1 ELF1 vol of distribution Liters/kg 3.32⫻10⫺4 11.7
VE2 ELF2 vol of distribution Liters/kg 1.49⫻10⫺2 14.5
VC Vol of distribution of central plasma compartment Liters/kg 3.06 2.05
VP Vol of distribution of peripheral plasma compartment Liters/kg 1.56 1.15
CLD, ELF ELF intercompartmental clearance Liters/h/kg 3.97⫻10⫺3 2.07
CLD, Plasma Plasma intercompartmental clearance Liters/h/kg 3.51 6.62
CLTotal Total clearance Liters/h/kg 3.54 0.48
CLELF, Plasma Intercompartmental clearance ELF to plasma Liters/h/kg 4.08⫻10⫺3 6.18 CLPlasma, ELF Intercompartmental clearance plasma to ELF Liters/h/kg 1.14⫻10⫺4 4.69
fu Unbound fraction % 4.60⫻10⫺2(fixed) NA
F Bioavailability % 99.3 6.89
t1/2 Elimination half-lifeb h 0.60 ND
aNA, not applicable; ND, not determined. bCalculated usingt
Table 4. The AUC/MIC targets associated with bacteriostasis against the three
P.
aeruginosa
strains were 1,326 to 1,506 in ELF and 3.14 to 4.03 in plasma.
Histopathological examination of the lungs following treatment with
aerosol-ized polymyxin B in healthy and neutropenic infected mice.
Table 5 shows the
histopathological results of the mouse lungs following pulmonary administration of
FIG 5Relationship between the log10CFU/lung ofP. aeruginosaPAO1 at 24 h and the PK/PD indices for AUCELF/MIC (A), Cmax,ELF/MIC (B),fAUCPlasma/MIC
(C), andfCmax Plasma/MIC (D). %T⬎MIC,ELFand %fT⬎MIC,Plasmacould not be adequately examined. The broken line represents the average bacterial burden
in the lungs at the start of aerosolized polymyxin B treatment.
TABLE 3PK/PD model parameters for AUCELF/MIC andfAUCplasma/MIC of aerosolized polymyxin B against three strains ofP. aeruginosa
Strain and sample source
Value(s) (% RSE) for PK/PD parametera:
Emax(log10CFU/lung) EO(log10CFU/lung) EI50 ␥ R2
ELF
ATCC 27853 4.74 (11.6) 8.54 (3.26) 1340 (4.67) 9.99 (61.5) 0.70
PAO1 4.65 (10.8) 8.54 (3.21) 1,335 (4.60) 9.94 (59.7) 0.71
FADDI-PA022 4.34 (7.51) 8.54 (1.48) 1,528 (4.73) 9.02 (29.7) 0.88
Plasma
ATCC 27853 6.61 (29.6) 9.06 (4.61) 3.35 (24.2) 2.80 (42.5) 0.70
PAO1 5.84 (19.9) 9.62 (2.71) 3.50 (15.0) 3.63 (33.3) 0.79
FADDI-PA022 4.70 (11.0) 8.63 (1.80) 3.61 (7.40) 5.13 (26.2) 0.87
aE
0is the effect in the absence of polymyxin B treatment;Emaxis the maximal effect; EI50is the value of
fAUC/MIC required to achieve 50% ofEmax;␥is the Hill coefficient.
polymyxin B. Mice treated with saline showed no significant inflammation (SQS
of
⬍⫹
0.50). Mice treated with the highest tolerable inhalable dose of polymyxin B (8.24
mg base/kg thrice daily or 10.3 mg base/kg twice daily) showed only minor
inflamma-tion (SQS of
⫹
1.33). At 24 h postdose, the infected lungs had necrosis and alveolar
inflammation with infiltration of polymorphonuclear cells (SQS of
⫹
2.00) (Table 5).
Following treatment with aerosolized polymyxin B (4.12 mg base/kg twice and thrice
daily and 8.24 mg base/kg twice and thrice daily), inflammation was substantially
reduced and the lung epithelium was mostly unaffected. Treatment with 4.12 mg
base/kg polymyxin B thrice daily significantly reduced the SQS scoring to
⫹
0.75,
indicating very minor damage.
DISCUSSION
Respiratory tract infections due to MDR
P. aeruginosa
are increasing and place a
major burden on the global health care system (1). Over the last decade, inhalation of
polymyxins has become a complementary practice for treating respiratory tract
infec-tions, such as those in patients with cystic fibrosis (29, 30) and ventilator-associated
pneumonia (31–33). Recent preclinical and clinical PK/PD studies highlighted the
advantage of aerosolized polymyxins over systemic administration in treating
respira-tory tract infections (12, 17–19, 22, 34, 35). However, the majority of PK/PD studies of
TABLE 4Polymyxin B AUCELF/MIC andfAUCplasma/MIC target values associated with bacteriostasis and 1- and 2-log10killsaStrain
Target valueb
Stasis 1-log10kill 2-log10kill
AUCELF/MIC
ATCC 27853 1,506 (1,337–1,951) 1,922 (1,422–2,663) ND
PAO1 1,326 (1,213–1,448) 1,453 (1,315–1,773) 1,693 (1,410–2,558)
FADDI-PA022 1,416 (1,296–1,512) 1,573 (1,470–1,697) 1,778 (1,635–2,076)
fAUCplsma/MIC
ATCC 27853 4.03 (2.44–7.53) 5.24 (2.89–10.6) ND
PAO1 3.78 (2.91–5.30) 4.68 (3.46–7.57) 6.70 (4.01–10.9)
FADDI-PA022 3.14 (2.72–3.51) 3.73 (3.32–4.26) 4.49 (3.89–5.74)
aResults show target values associated with bacteriostasis and 1- and 2-log
10kills against all three strains of
P. aeruginosain the mouse lung infection model.
bValues in parentheses are the 10th to 90th percentile ranges generated from Monte Carlo simulation. ND,
not determined.
TABLE 5Histopathological examination of lung toxicity in healthy andP. aeruginosa -infected mouse lungs 24 h after pulmonary administration of polymyxin B
Amt of polymyxin
B (mg base/kg) Dosing regimen
Histopathological result for:
Noninfected healthy mice
Neutropenic infected mice
n Avg SQS n Avg SQS
Saline Once daily 4 0.00 NA NA
Saline Twice daily 3 0.00 NA NA
Saline Thrice daily 4 ⫹0.50 NA NA
Growth control NAa NA NA 8 ⫹2.00
2.06 Once daily 3 ⫹1.00 NA NA
2.06 Twice daily 3 ⫹1.00 NA NA
2.06 Thrice daily 3 ⫹0.33 NA NA
4.12 Once daily 3 ⫹1.00 4 ⫹2.00
4.12 Twice daily 3 ⫹1.33 4 ⫹1.00
4.12 Thrice daily 3 ⫹1.00 4 ⫹0.75
8.24 Once daily 3 ⫹1.00 4 ⫹2.25
8.24 Twice daily 3 ⫹1.00 3 ⫹1.00
8.24 Thrice daily 3 ⫹1.33 5 ⫹1.40
10.3 Once daily 3 ⫹0.67 NA NA
10.3 Twice daily 3 ⫹1.33 NA NA
aerosolized polymyxins have focused on CMS/colistin, despite aerosolized polymyxin B
also being used in the clinic (28). Give that the systemic PK differ between colistin and
polymyxin B following systemic administration, it is necessary to examine the PK/PD of
polymyxin B following pulmonary administration. Our study is the first to examine the
PK/PD of aerosolized polymyxin B in a mouse lung infection model and to demonstrate
that AUC
ELF/MIC and
f
AUC
Plasma/MIC was the most predictive PK/PD index of
aerosol-ized polymyxin B (Fig. 5 and Table 3).
To investigate the PK of polymyxin B following pulmonary and intravenous
admin-istration, a population PK model was constructed (Fig. 4). The developed population PK
model adequately predicted polymyxin B disposition following intravenous and
pul-monary administration (Fig. 2 and 3). In our model, the absorption of polymyxin B into
the systemic circulation following pulmonary administration is best described by the
first-order rate constant (Fig. 4). Similar to aerosolized colistin (2.64 and 5.28 mg
base/kg) in neutropenic lung-infected mice (26), the peak plasma concentration of
unbound polymyxin B (
fC
max, Plasmaof 0.46
⫾
0.04 mg/liter) (Fig. 1 and Table 1)
appeared rapidly after pulmonary administration, with a time to peak plasma
concen-tration (
T
max) of 15 min (for a dose of 4.12 mg base/kg). Despite the fast absorption of
polymyxin B into the systemic circulation following pulmonary administration, the
plasma
fC
max, Plasmavalue achieved after pulmonary administration was significantly
lower than that at 15 min (0.84
⫾
0.14 mg/liter) (Fig. 1) following intravenous
admin-istration (4.12 mg base/kg).
Based on the current PK model, most of the polymyxin B inhaled dose (
⬃
99.3% [SE
of 6.89%]) (Table 2) was absorbed into systemic circulation. The bioavailability of
aerosolized polymyxin B was very similar to the result obtained from an aerosolized
colistin study in
P. aeruginosa
-infected mice (100%) (26) but was significantly higher
than that in rats (31 to 69%) (18, 19, 36). The differences in the observed bioavailability
among different species are likely due to differential expression of the peptide
trans-porter PEPT2 in lung epithelial cells (37). PEPT2 has recently been identified to be
responsible for the uptake of polymyxins in human embryonic kidney 293 (HEK293)
cells (38). Given that PEPT2 is abundantly expressed in the airway epithelium (37, 39),
it may have a significant impact on the disposition of polymyxins (18). The expression
level of PEPT2 mRNA in mouse lungs is approximately 2-fold higher than that in rat
lungs (40). Unfortunately, interspecies differences between the expression level of
PEPT2 of mice and humans is unknown (41). It should be noted, however, that the
mouse and human PEPT2 have a similar structure (sequence homology of 80%) (41)
and that both are able to transport the same range of substrates (42, 43). In a recent
PK study following pulmonary administration of colistin to rats (18), a nonlinear
(Michaelis-Menten) model was incorporated to describe the transfer of colistin across
the lung epithelium. In the current study, the incorporation of Michaelis-Menten
kinetics to describe the transfer of polymyxin B from ELF to plasma did not provide a
significant improvement in the PK model. Although the role of PEPT2 in transporting
polymyxins has been verified in HEK293 cells (38) and supported by PK modeling in rats
(18), its roles in mice remain unclear. Further studies are being conducted in our
laboratory.
A two-compartment PK model was required to describe the disposition of
poly-myxin B in ELF following pulmonary administration (Fig. 4). The ELF1 compartment
potentially represents a depot for polymyxin B in the upper airway from which the drug
is bidirectionally transferred to peripheral lung regions and, to some extent, the lung
epithelial cells. In the current study, the apparent volume of the epithelial lining fluid
(
V
ELF) was estimated in the proposed population PK model, and interestingly, the
estimated
V
ELFvalue (named
V
E1in Table 2) was relatively larger than the calculated
V
ELFusing the urea dilution method. In compartmental PK analysis, an estimated
V
ELFhas no real physiological meaning (21). The relatively large estimated
V
E1and
V
E2values
(0.0149 liters/kg; SE of 14.5%) indicate significant binding of polymyxin B in the lungs
(e.g., to mucin, surfactants, and lung epithelial cells).
Similar to the observations from the colistin PK study (18, 19, 26), the polymyxin B
concentration in ELF was affected by the route of administration. In contrast to the high
polymyxin B exposure in ELF (AUC
ELFof
⬃
600 mg · h/liter for 4.12 mg base/kg) (Table
1) following pulmonary delivery, polymyxin B was undetectable in ELF following
intravenous administration (Fig. 1 and Table 1). The population PK model developed
here provides an opportunity to simulate the undetectable ELF polymyxin B
concen-tration following intravenous adminisconcen-tration. It is important to note that the LOQ for
polymyxin B in ELF is
⬃
2.00 mg/liter in our study, and the ELF concentrations simulated
by the PK model after intravenous administration of polymyxin B (4.12 mg base/kg)
remained below the ELF LOQ.
Our study in neutropenic infected mice demonstrates that inhalation of polymyxin
B achieved prolonged and extensive pulmonary exposure (Fig. 1). High pulmonary
exposure to polymyxin B was maintained above the resistance breakpoints (
⬎
2 mg/
liter) against
P. aeruginosa
and
A. baumannii
over the 12-h sampling period (44). The
retention of polymyxin B in ELF was proposed to be due to the binding of polymyxin
B to alveolar macrophages (45) and the alveolar basement membrane (46) via
electro-static interactions (47). Similar mechanisms were also suggested for the prolonged and
extensive exposure observed in ELF following pulmonary administration of colistin in
sheep (35), rats (36), and mice (26). The exact mechanism for the polymyxin retention
in ELF is not known, and further studies are warranted.
Collectively, the PK results suggest that aerosolized polymyxin B is as effective as
aerosolized colistin. It should be noted that colistin in clinical practice is administered
in the form of a prodrug, CMS. In a rat PK study following pulmonary administration of
CMS, only 23 to 39% of the dose converted to colistin in the rat lungs (17, 19).
Furthermore, the CMS-to-colistin conversion process is slow and the
T
maxof the formed
colistin is only achieved at 1 to 5 h after nebulization in patients with cystic fibrosis (12).
On the contrary, polymyxin B is administered in its active form, hence, therapeutic
efficacy can be rapidly attained (Fig. 1).
AUC
ELF/MIC and
f
AUC
plasma/MIC were identified as the most predictive PK/PD
indices to describe the antimicrobial efficacy of aerosolized polymyxin B against MDR
P. aeruginosa
in the mouse lung infection model (Fig. 5 and Table 3). A relatively low
degree of interstrain variability (
⬍
1-fold) in AUC
ELF/MIC and
f
AUC
plasma/MIC was
ob-served for all three strains of
P. aeruginosa
(Table 4). The
f
AUC
plasma/MIC target values
associated with various killing effects for aerosolized polymyxin B (Table 4) compared
well with those obtained in aerosolized colistin studies using the same strains in a
mouse lung infection model (26). Unlike the
f
AUC
plasma/MIC, the AUC
ELF/MIC of
poly-myxin B differs from that observed previously in the colistin PK/PD study (26). The
AUC
ELF/MIC of polymyxin B to achieve bacteriostasis against
P. aeruginosa
was 1,326 to
1,506 (Table 4), which is much higher than the AUC
ELF/MIC of colistin (684 to 1,050) (26),
even after accounting for the difference in molecular weights. The differences could be
interpreted in terms of the different binding affinities to lung surfactants and plasma
between polymyxin B and colistin. Polymyxin B (82.3%
⫾
4.30% and 68.4%
⫾
3.50% for
polymyxin B1 and polymyxin B2, respectively) was found to display much higher
plasma protein binding than colistin (56.6%
⫾
9.25% and 41.7%
⫾
12.4% for colistin A
and colistin B, respectively) in rat plasma (48). Structurally, polymyxin B contains a
D-phenylalanine residue at position 6 as opposed to a
D-leucine residue at position 6 of
colistin (4). The much higher plasma protein binding properties of polymyxin B very
likely is due to the higher hydrophobicity of
D-phenylalanine compared to
D-leucine
(49). Based on the structural differences, polymyxin B and colistin are likely to have
different binding affinities to pulmonary surfactants, proteins, mucin, and lung
epithe-lium in the ELF, hence the differences in AUC
ELF/MIC observed. Future studies to
examine the binding of polymyxin B to substances in ELF are needed. Another
noticeable difference between the two studies was that unlike the colistin PK/PD study,
in which a 2-log
10kill was not achieved for any of the three strains (26), in the current
study, a 2-log
10kill was achieved for strains PAO1 and FADDI-PA022 but not for ATCC
27853 (Table 4).
2-log
10reductions in bacterial loads was 100 times higher than the MICs for all three
P.
aeruginosa
strains. This higher-than-expected AUC
ELF/MIC target was proposed to be
linked to the presence of multiple purulent plugs obstructing bronchioles, which
prevented aerosolized polymyxin B from accessing all sites of infection (34). This
phenomenon was noted in
P. aeruginosa
-infected piglets in which the deposition of a
colistin aerosol was significantly impaired in deep airway infections (34). It could also be due
to the presence of mucin (50) and a pulmonary surfactant (51). An
in vitro
study has shown
significant impairment of the antimicrobial activity of polymyxins as a result of the
inter-action with porcine lung surfactants (51). Finally, the Penn-Century MicroSprayer used for
pulmonary administration generates aerosol droplets with a size of
⬎
10
m (17), which
may result in a heterogeneous disposition of polymyxin B in the lungs.
Due to toxicity concerns and technical difficulties in pulmonary administration,
traditional dose fractionation experiments could not be reliably performed in the
present study. As mice were unable to tolerate
⬎
10.3 mg base/kg aerosolized
polymyxin B in a single dose or a cumulative dose of 24.8 mg base/kg, a modified
dose fractionation study was conducted. Nevertheless, much better correlations
were observed between the killing effect and AUC
ELF/MIC (
R
2of 0.70 to 0.88) than
with
C
max, ELF/MIC (
R
2of 0.49 to 0.58) and, similarly, killing effect versus AUC
Plasma/
MIC (
R
2of 0.70 to 0.87) than with
C
max, Plasma
/MIC (R
2⫽
0.53 to 0.60) (Fig. 5 and Table
3). Due to the limited tolerance, the sigmoid dose-response relationship could not be
fully characterized for aerosolized polymyxin B. In addition, for easy comparisons with
aerosolized colistin PK/PD, the same bacterial isolates (polymyxin B MICs of 1 mg/liter)
were examined in the present study (26, 52). In light of the interspecies differences,
translation of the calculated PK/PD targets from mouse to human needs to be verified
in future clinical studies.
A potential advantage of pulmonary administration of polymyxin B in treating
respiratory tract infections was also supported by the histopathological results (Table
5). Severe lung infection resulted in inflammation and tissue necrosis, with a
corre-sponding SQS of
⫹
2 (Table 5). In lung infections caused by
P. aeruginosa
,
lipopolysac-charide (LPS), an endotoxin released by bacteria, can induce severe lung damage and
inflammation (53). In addition to the antimicrobial effect, polymyxin B exhibits an
LPS-neutralizing effect (53, 54). Aerosolized polymyxin B reduced the lung inflammation
when multiple dosage regimens were utilized (Table 5). The treatment with the highest
tolerable aerosolized polymyxin B dose (8.24 mg base/kg thrice daily) was able to
protect the lung epithelium and reduced the inflammation at 24 h posttreatment (SQS
of
⫹
1.40) (Table 5). Potential toxicity of aerosolized polymyxin B was also examined in
healthy mice (Table 5). The pulmonary delivery resulted in minor lung inflammation,
which was comparable to the results of colistin administration but slightly worse than
that obtained after the administration of CMS (26). These results suggest that
aerosol-ized polymyxin B is relatively safe to use for treating respiratory tract infections.
To the best of our knowledge, this is the first population PK model that describes the
disposition of polymyxin B in both ELF and plasma in mice following pulmonary and
intravenous administration. This study highlights the distinct advantage of pulmonary
delivery of polymyxin B in achieving high drug exposures in ELF over intravenous
administration. Furthermore, AUC
ELF/MIC and
f
AUC
plasma/MIC were identified as the
most predictive PK/PD indices that describe the antimicrobial efficacy of aerosolized
polymyxin B against
P. aeruginosa
in a mouse lung infection model. We also
deter-mined the AUC
ELF/MIC and
f
AUC
plasma/MIC targets associated with various magnitudes
of bacterial kill. The potential advantage of pulmonary delivery of polymyxin B is also
supported by the safety results. Ultimately, the PK model and PK/PD targets provide
important information for optimizing the inhalation of polymyxin B to maximize its
antimicrobial efficacy while minimizing any potential toxicity.
MATERIALS AND METHODS
Chemicals and bacterial strains.Polymyxin B was purchased from Sigma-Aldrich (St. Louis, MO, USA), and solutions were freshly prepared in sterile 0.9% saline (52). Three strains ofP. aeruginosawere
examined: two reference strains, ATCC 27853 and PAO1, and one MDR clinical isolate, FADDI-PA022 (MIC of 1 mg/liter for all three strains). MICs were determined using the broth microdilution method in cation-adjusted Mueller-Hinton broth (CAMHB) (55) without polysorbate 80 or mucin.
PK of aerosolized and intravenous polymyxin B in neutropenic infected mice. All animal experiments were approved by the Monash Institute of Pharmaceutical Sciences Animal Ethics Commit-tee and conducted in accordance with the Australian Code of Practice for the Care and Use of Animals for Scientific Purposes. Female Swiss mice (6 to 8 weeks, weight of 30 to 35 g) were employed (Monash Animal Research Platform, Victoria, Australia) in the neutropenic mouse lung infection model (26). A Penn-Century MicroSprayer (model IA-1C; Penn-Century, Philadelphia, PA, USA) was used to deliver 25l of bacterial suspension (approximately 106bacterial cells in the early logarithmic phase) directly into the
lungs (56). Aerosolized polymyxin B treatment began 2 h after bacterial inoculation.
Single-dose PK studies were conducted in neutropenic lung-infected mice following administration of polymyxin B by inhalation (4.12 and 8.24 mg base/kg, volume of 25l) or intravenously (4.12 mg base/kg, volume of 50l). The maximum dosage regimens for intravenous and pulmonary administra-tion of polymyxin B were chosen based upon the tolerability in mice. The lowest pulmonary dosage regimen was selected considering the LOQ of the analytical method for polymyxin B in plasma samples. For the pulmonary dosing study, plasma and bronchoalveolar lavage fluid (BALF) were collected at 15 and 30 min and at 1, 2, 3, 4, 6, and 12 h postdose (n⫽4 per time point). For the intravenous dosing study, plasma and BALF were collected at 5, 15, and 30 min and 1, 1.5, 2, 3, and 6 h postdose (n⫽4 per time point). Bronchoalveolar lavage was performed using 0.5 ml of 0.9% saline for two cycles, and for each animal the recovered BALF fractions were pooled. The BALF and plasma samples from each animal were stored separately, and the concentrations were determined by a validated liquid chromatography-tandem mass spectrometry (LC-MS/MS) assay, with minor modifications (57). Briefly, the BALF and plasma samples were deproteinized with 0.1% formic acid in acetonitrile and centrifuged at 18,210⫻gfor 15 min. The calibration curve ranged from 0.10 mg/liter to 10.0 mg/liter for plasma and 0.10 mg/liter to 8.00 mg/liter for BALF. The LOQ for BALF and plasma was 0.10 mg/liter. The assay accuracies in BALF and plasma were⬍11.0% and⬍14.8%, respectively.
Urea was used to determine the apparent volume of the epithelial lining fluid (VELF) (58). Urea
concentrations in both BALF and plasma were determined using a QuantiChrom urea assay kit (BioAssay Systems, California, USA).VELFwas calculated asVELF⫽[urea]BALF/[urea]Plasma⫻VBALF, where [urea]Plasma,
[urea]BALF, andVBALFare urea concentration (milligrams per decaliter) in plasma and BALF and recovered
BALF volume, respectively.
The apparent polymyxin B concentration for each animal inVELFwas calculated by multiplying the
polymyxin B concentration in BALF by the ratio of urea concentration in plasma and BALF as [polymyxin B]ELF⫽[polymyxin B]BALF⫻[urea]Plasma/[urea]BALF.
Population PK modeling.Noncompartmental (NCA) PK parameters (Phoenix WinNonlin software, version 6.3; Pharsight Corporation) were used as an initial estimate to guide the development of a population PK model (see Fig. S1 in the supplemental material). Initially, the model was independently developed for polymyxin B concentrations in plasma and ELF following intravenous or pulmonary administration. Subsequently, the ELF and plasma concentrations after pulmonary or intravenous administration were simultaneously analyzed using a Monte Carlo parametric expectation maximization algorithm (importance sampling, pmethod of 4) in S-ADAPT (version 1.57) facilitated by S-ADAPT TRAN (59). The Akaike information criterion (AIC), Bayesian information criterion (BIC) values, and visual inspection of the diagnostic plots (i.e., observed versus population-fitted concentration plots) and fitted functions were used to guide the selection of the best model to describe the observed data. In addition, the objective function (reported as⫺1⫻ log likelihood in S-ADAPT) was employed to discriminate between the nested models; a decrease in the objective function of 1.92 U (chi-square test, with one degree of freedom) was considered significant. The final polymyxin B population PK model was evaluated using a visual predictive check (60).
The population PK model was built with a reduced data set (i.e., the data set without outliers) (61). Suspected outlier observations were tested, and if significant, outliers were excluded based on the following criteria. Data points were considered outliers if weighted residuals were greater than 3 to 5 standard deviation units and their exclusion changed the fitted function. For the case in which the exclusion of outliers significantly improved the fitted function and the precision of the estimates, the outliers were excluded from the final population PK model. The residual unexplained variability in both plasma and ELF was evaluated using additive and proportional errors, which were fixed to the assay precision and LOQ. Plasma drug concentrations below the LOQ were included using the Beal M3 method (62).
PK/PD of aerosolized polymyxin B.Neutropenic mice infected withP. aeruginosaATCC 27853, PAO1, and FADDI-PA022 were treated with aerosolized polymyxin B 2 h after bacterial inoculation. Dose fractionation studies were performed; the dosage regimens involved once-daily administration of 2.06, 4.12, 6.18, 8.24, and 10.3 mg base/kg, twice-daily administration of 4.12, 8.24, and 10.3 mg base/kg, and thrice-daily administration of 4.12 and 8.24 mg base/kg. Lungs were aseptically harvested at 24 h after dosing, homogenized with 8 ml of 0.9% saline, and filtered through a sterile filter bag (bag stomacher filter, sterile; pore size, 280m; 0.5 by 16 cm; Labtek Pty Ltd., QLD, Australia). Filtrate samples were serially diluted with 0.9% saline and spiral plated on nutrient agar plates to determine bacterial load in the lungs. Bacterial loads were expressed as the log10CFU per lung, and the limit of counting was 164
and unbound concentration-time profiles to obtain the corresponding PK parameters (fCmax,fAUC, and
fT⬎MIC) for multiple dosage regimens (26, 52). Subsequently, the inhibitory sigmoid dose-effect model
was fitted to the PK/PD data to estimate the PK/PD indices for plasma and ELF (i.e.,fAUC/MIC,fCmax/MIC,
and %fT⬎MIC). The magnitude of various killing effects was assessed for the most predictive PK/PD index
using the nonlinear least-squares regression analysis (63). Monte Carlo simulation (n⬎10,000) was employed to estimate the 10th and 90th percentile range for the PK/PD target.
Histopathological examination. Histopathological examinations of lungs were performed in healthy and neutropenic lung infected mice with aerosolized polymyxin B. The dosage regimens involved once-, twice-, and thrice-daily administration of polymyxin B at 2.06, 4.12, 8.24, and 10.3 mg base/kg. Due to profound toxicity, the largest total daily dose administered was 24.8 mg base/kg. At 24 h following pulmonary administration, mice were humanely killed and lungs were harvested and fixed in formalin immediately. To avoid any potential artificial damage to the lung epithelium, bronchoalveolar lavage and cardiac puncture were not performed. A semiquantitative scoring (SQS) system was adapted to quantify the extent of lung damage (64). Briefly, we used the following grades for the severity and nature of the histopathological changes in the lungs: grade 0, no changes or mild changes considered insignificant; grade 1, minimal lesions affecting 1 to 25% of the area; grade 2, multifocal lesions affecting 25 to 50% of the area; and grade 3, severe tissue changes affecting⬎50% of the area. The grades were given the following scores: grade 0, 0.1; grade 1, 1; grade 2, 4; and grade 3, 10. Percentages of damage across different levels of the lungs were given the following scores:⬍1%, 0; from 1 to⬍5%, 1; from 5 to⬍10%, 2; from 10 to⬍20%, 3; from 20 to⬍30%, 4; from 30 to⬍40%, 5;ⱖ40%, 6. The overall lung histology score was determined as the product of the grade and percent damage score. An SQS was assigned the following scores: SQS 0, no significant change; SQS⫹1, mild damage; SQS⫹2, mild to moderate damage; SQS⫹3, moderate damage; SQS⫹4, moderate to severe damage; and SQS⫹5, severe damage.
SUPPLEMENTAL MATERIAL
Supplemental material for this article may be found at
https://doi.org/10.1128/AAC
.00211-17
.
SUPPLEMENTAL FILE 1,
PDF file, 0.6 MB.
ACKNOWLEDGMENTS
We acknowledge financial support from the National Health and Medical Research
Council’s (NHMRC) project grant (APP1065046). J.L. and A.F. are supported by research
grants from the National Institute of Allergy and Infectious Diseases (NIAID) of the
National Institutes of Health (NIH; R01 AI111965). Y.-W.L. is a recipient of the Australian
Postgraduate Award. J.L. is an Australian NHMRC Senior Research Fellow.
The content is solely the responsibility of the authors and does not necessarily
represent the official views of the National Institute of Allergy and Infectious Diseases
or the National Institutes of Health.
This study utilized the Australian Phenomics Network Histopathology and Organ
Pathology Service at the University of Melbourne.
REFERENCES
1. Bodey GP, Bolivar R, Fainstein V, Jadeja L. 1983. Infections caused by Pseudomonas aeruginosa. Rev Infect Dis 5:279 –313.https://doi.org/10 .1093/clinids/5.2.279.
2. Zavascki AP, Goldani LZ, Li J, Nation RL. 2007. Polymyxin B for the treatment of multidrug-resistant pathogens: a critical review. J Antimi-crob Chemother 60:1206 –1215.https://doi.org/10.1093/jac/dkm357. 3. Li J, Nation RL, Turnidge JD, Milne RW, Coulthard K, Rayner CR, Paterson
DL. 2006. Colistin: the re-emerging antibiotic for multidrug-resistant Gram-negative bacterial infections. Lancet Infect Dis 6:589 – 601.https:// doi.org/10.1016/S1473-3099(06)70580-1.
4. Kwa A, Kasiakou SK, Tam VH, Falagas ME. 2007. Polymyxin B: similarities to and differences from colistin (polymyxin E). Expert Rev Anti Infect Ther 5:811– 821.https://doi.org/10.1586/14787210.5.5.811.
5. Bergen PJ, Li J, Rayner CR, Nation RL. 2006. Colistin methanesulfonate is an inactive prodrug of colistin against Pseudomonas aeruginosa. Anti-microb Agents Chemother 50:1953–1958.https://doi.org/10.1128/AAC .00035-06.
6. Nation RL, Velkov T, Li J. 2014. Colistin and polymyxin B: peas in a pod, or chalk and cheese? Clin Infect Dis 59:88 –94.https://doi.org/10.1093/ cid/ciu213.
7. Karvanen M, Plachouras D, Friberg LE, Paramythiotou E, Papadomichela-kis E, Karaiskos I, Tsangaris I, Armaganidis A, Cars O, Giamarellou H. 2013.
Colistin methanesulfonate and colistin pharmacokinetics in critically ill patients receiving continuous venovenous hemodiafiltration. Antimi-crob Agents Chemother 57:668 – 671. https://doi.org/10.1128/AAC .00985-12.
8. Karaiskos I, Friberg LE, Pontikis K, Ioannidis K, Tsagkari V, Galani L, Kostakou E, Baziaka F, Paskalis C, Koutsoukou A. 2015. Colistin popula-tion pharmacokinetics after applicapopula-tion of a loading dose of 9 MU colistin methanesulfonate in critically ill patients. Antimicrob Agents Chemother 59:7240 –7248.https://doi.org/10.1128/AAC.00554-15. 9. Plachouras D, Karvanen M, Friberg LE, Papadomichelakis E, Antoniadou
A, Tsangaris I, Karaiskos I, Poulakou G, Kontopidou F, Armaganidis A, Cars O, Giamarellou H. 2009. Population pharmacokinetic analysis of colistin methanesulfonate and colistin after intravenous administration in criti-cally ill patients with infections caused by gram-negative bacteria. An-timicrob Agents Chemother 53:3430 –3436.https://doi.org/10.1128/AAC .01361-08.
10. Garonzik SM, Li J, Thamlikitkul V, Paterson DL, Shoham S, Jacob J, Silveira FP, Forrest A, Nation RL. 2011. Population pharmacokinetics of colistin methanesulfonate and formed colistin in critically ill patients from a multicenter study provide dosing suggestions for various categories of patients. Antimicrob Agents Chemother 55:3284 –3294.https://doi.org/ 10.1128/AAC.01733-10.
11. Sandri AM, Landersdorfer CB, Jacob J, Boniatti MM, Dalarosa MG, Falci DR, Behle TF, Bordinhao RC, Wang J, Forrest A, Nation RL, Li J, Zavascki AP. 2013. Population pharmacokinetics of intravenous polymyxin B in critically ill patients: implications for selection of dosage regimens. Clin Infect Dis 57:524 –531.https://doi.org/10.1093/cid/cit334.
12. Yapa WS, Li J, Patel K, Wilson JW, Dooley MJ, George J, Clark D, Poole S, Williams E, Porter CJ, Nation RL, Mclntosh MP. 2014. Pulmonary and systemic pharmacokinetics of inhaled and intravenous colistin methane-sulfonate in cystic fibrosis patients: targeting advantage of inhalational administration. Antimicrob Agents Chemother 58:2570 –2579.https:// doi.org/10.1128/AAC.01705-13.
13. Cheah S-E, Li J, Tsuji BT, Forrest A, Bulitta JB, Nation RL. 2016. Colistin and polymyxin B dosage regimens against Acinetobacter baumannii: differ-ences in activity and the emergence of resistance. Antimicrob Agents Chemother 60:3921–3933.https://doi.org/10.1128/AAC.02927-15. 14. Zavascki AP, Goldani LZ, Cao G, Superti SV, Lutz L, Barth AL, Ramos F,
Boniatti MM, Nation RL, Li J. 2008. Pharmacokinetics of intravenous polymyxin B in critically ill patients. Clin Infect Dis 47:1298 –1304.https:// doi.org/10.1086/592577.
15. Hartzell JD, Neff R, Ake J, Howard R, Olson S, Paolino K, Vishnepolsky M, Weintrob A, Wortmann G. 2009. Nephrotoxicity associated with intrave-nous colistin (colistimethate sodium) treatment at a tertiary care medical center. Clin Infect Dis 48:1724 –1728.https://doi.org/10.1086/599225. 16. Nation RL, Garonzik SM, Thamlikitkul V, Giamarellos-Bourboulis EJ,
For-rest A, Paterson DL, Li J, Silveira FP. 2016. Dosing guidance for intrave-nous colistin in critically-ill patients. Clin Infect Dis 64:565–571. 17. Marchand S, Gobin P, Brillault J, Baptista S, Adier C, Olivier J-C, Mimoz O,
Couet W. 2010. Aerosol therapy with colistin methanesulfonate: a bio-pharmaceutical issue illustrated in rats. Antimicrob Agents Chemother 54:3702–3707.https://doi.org/10.1128/AAC.00411-10.
18. Gontijo AVL, Grégoire N, Lamarche I, Gobin P, Couet W, Marchand S. 2014. Biopharmaceutical characterization of nebulized antimicrobial agents in rats: 2. Colistin. Antimicrob Agents Chemother 58:3950 –3956. https://doi.org/10.1128/AAC.02819-14.
19. Yapa WS, Li J, Porter CJ, Nation RL, Patel K, McIntosh MP. 2013. Popu-lation pharmacokinetics of colistin methanesulfonate in rats: achieving sustained lung concentrations of colistin for targeting respiratory infec-tions. Antimicrob Agents Chemother 57:5087–5095.https://doi.org/10 .1128/AAC.01127-13.
20. Ratjen F, Rietschel E, Kasel D, Schwiertz R, Starke K, Beier H, Van Koningsbruggen S, Grasemann H. 2006. Pharmacokinetics of inhaled colistin in patients with cystic fibrosis. J Antimicrob Chemother 57: 306 –311.https://doi.org/10.1093/jac/dki461.
21. Boisson M, Jacobs M, Grégoire N, Gobin P, Marchand S, Couet W, Mimoz O. 2014. Comparison of intrapulmonary and systemic pharmacokinetics of colistin methanesulfonate (CMS) and colistin after aerosol delivery and intravenous administration of CMS in critically ill patients. Antimi-crob Agents Chemother 58:7331–7339. https://doi.org/10.1128/AAC .03510-14.
22. Marchand S, Bouchene S, de Monte M, Guilleminault L, Montharu J, Cabrera M, Grégoire N, Gobin P, Diot P, Couet W. 2015. Pharmacokinetics of colistin methansulphonate (CMS) and colistin after CMS nebulisation in baboon monkeys. Pharm Res 32:3403–3414.https://doi.org/10.1007/ s11095-015-1716-0.
23. Athanassa ZE, Markantonis SL, Fousteri M-ZF, Myrianthefs PM, Bout-zouka EG, Tsakris A, Baltopoulos GJ. 2012. Pharmacokinetics of inhaled colistimethate sodium (CMS) in mechanically ventilated critically ill pa-tients. Intensive Care Med 38:1779 –1786. https://doi.org/10.1007/ s00134-012-2628-7.
24. Nakwan N, Lertpichaluk P, Chokephaibulkit K, Villani P, Regazzi M, Imberti R. 2015. Pulmonary and systemic pharmacokinetics of colistin following a single dose of nebulized colistimethate in mechanically ventilated neonates. Pediatr Infect Dis J 34:961–963.https://doi.org/10 .1097/INF.0000000000000775.
25. Gunderson BW, Ibrahim KH, Hovde LB, Fromm TL, Reed MD, Rotschafer JC. 2003. Synergistic activity of colistin and ceftazidime against multiantibiotic-resistant Pseudomonas aeruginosa in an in vitro phar-macodynamic model. Antimicrob Agents Chemother 47:905–909. https://doi.org/10.1128/AAC.47.3.905-909.2003.
26. Lin Y-W, Zhou Q, Cheah S-E, Zhao J, Chen K, Wang J, Chan H-K, Li J. 2017. Pharmacokinetics/pharmacodynamics of pulmonary delivery of colistin against Pseudomonas aeruginosa in a mouse lung infection model. Antimicrob Agents Chemother 61:e02025-16.https://doi.org/10.1128/ AAC.02025-16.
27. Velkov T, Rahim NA, Zhou QT, Chan H-K, Li J. 2015. Inhaled anti-infective chemotherapy for respiratory tract infections: successes, challenges and the road ahead. Adv Drug Deliv Rev 85:65– 82.https://doi.org/10.1016/ j.addr.2014.11.004.
28. Pereira GH, Muller PR, Levin AS. 2007. Salvage treatment of pneumonia and initial treatment of tracheobronchitis caused by multidrug-resistant Gram-negative bacilli with inhaled polymyxin B. Diagn Microbiol Infect Dis 58:235–240.https://doi.org/10.1016/j.diagmicrobio.2007.01.008. 29. Jensen T, Pedersen SS, Garne S, Heilmann C, Høiby N, Koch C. 1987.
Colistin inhalation therapy in cystic fibrosis patients with chronic Pseu-domonas aeruginosa lung infection. J Antimicrob Chemother 19: 831– 838.https://doi.org/10.1093/jac/19.6.831.
30. Hansen C, Pressler T, Høiby N. 2008. Early aggressive eradication therapy for intermittent Pseudomonas aeruginosa airway colonization in cystic fibrosis patients: 15 years experience. J Cyst Fibros 7:523–530.https:// doi.org/10.1016/j.jcf.2008.06.009.
31. Chastre J, Fagon J-Y. 2002. Ventilator-associated pneumonia. Am J Respir Crit Care Med 165:867–903. https://doi.org/10.1164/ajrccm.165.7 .2105078.
32. Michalopoulos A, Kasiakou SK, Mastora Z, Rellos K, Kapaskelis AM, Falagas ME. 2005. Aerosolized colistin for the treatment of nosocomial pneumonia due to multidrug-resistant Gram-negative bacteria in pa-tients without cystic fibrosis. Crit Care 9:R53–R59. https://doi.org/10 .1186/cc3020.
33. Mubareka S, Rubinstein E. 2005. Aerosolized colistin for the treatment of nosocomial pneumonia due to multidrug-resistant Gram-negative bac-teria in patients without cystic fibrosis. Crit Care 9:29 –30.
34. Lu Q, Girardi C, Zhang M, Bouhemad B, Louchahi K, Petitjean O, Wallet F, Becquemin M-H, Le Naour G, Marquette C-H. 2010. Nebulized and intravenous colistin in experimental pneumonia caused by Pseudomo-nas aeruginosa. Intensive Care Med 36:1147–1155. https://doi.org/10 .1007/s00134-010-1879-4.
35. Landersdorfer CB, Nguyen T-H, Lieu LT, Nguyen G, Bischof RJ, Meeusen EN, Li J, Nation RL, McIntosh MP. 2017. Substantial targeting advantage achieved by pulmonary administration of colistin methanesulfonate in a large-animal model. Antimicrob Agents Chemother 61:e01934-16. https://doi.org/10.1128/AAC.01934-16.
36. Yapa SW. 2013. Ph.D. thesis. Monash University, Melbourne, Victoria, Australia.
37. Bosquillon C. 2010. Drug transporters in the lung– do they play a role in the biopharmaceutics of inhaled drugs? J Pharm Sci 99:2240 –2255. https://doi.org/10.1002/jps.21995.
38. Lu X, Chan T, Xu C, Zhu L, Zhou QT, Roberts KD, Chan H-K, Li J, Zhou F. 2016. Human oligopeptide transporter 2 (PEPT2) mediates cellular up-take of polymyxins. J Antimicrob Chemother 71:403– 412.https://doi .org/10.1093/jac/dkv340.
39. Saito H, Terada T, Okuda M, Sasaki S, Inui K-I. 1996. Molecular cloning and tissue distribution of rat peptide transporter PEPT2. Biochim Bio-phys Acta 1280:173–177.https://doi.org/10.1016/0005-2736(96)00024-7. 40. Lu H, Klaassen C. 2006. Tissue distribution and thyroid hormone regu-lation of Pept1 and Pept2 mRNA in rodents. Peptides 27:850 – 857. https://doi.org/10.1016/j.peptides.2005.08.012.
41. Kamal MA, Keep RF, Smith DE. 2008. Role and relevance of PEPT2 in drug disposition, dynamics, and toxicity. Drug Metab Pharmacokinet 23: 236 –242.https://doi.org/10.2133/dmpk.23.236.
42. Ganapathy ME, Brandsch M, Prasad PD, Ganapathy V, Leibach FH. 1995. Differential recognition of-lactam antibiotics by intestinal and renal peptide transporters, PEPT 1 and PEPT 2. J Biol Chem 270:25672–25677. https://doi.org/10.1074/jbc.270.43.25672.
43. Sugawara M, Huang W, Fei YJ, Leibach FH, Ganapathy V, Ganapathy ME. 2000. Transport of valganciclovir, a ganciclovir prodrug, via peptide transporters PEPT1 and PEPT2. J Pharm Sci 89:781–789.https://doi.org/ 10.1002/(SICI)1520-6017(200006)89:6⬍781::AID-JPS10⬎3.0.CO;2-7. 44. Gales AC, Jones RN, Sader HS. 2011. Contemporary activity of colistin
and polymyxin B against a worldwide collection of Gram-negative pathogens: results from the SENTRY Antimicrobial Surveillance Program (2006-09). J Antimicrob Chemother 66:2070 –2074.https://doi.org/10 .1093/jac/dkr239.
45. Bysani GK, Stokes DC, Fishman M, Shenep JL, Hildner WK, Rufus K, Bradham N, Costlow ME. 1990. Binding of polymyxin B to rat alveolar macrophages. J Infect Dis 162:939 –943.https://doi.org/10.1093/infdis/ 162.4.939.
transport in permeability pulmonary edema in rats. Circ Res 55:155–167. https://doi.org/10.1161/01.RES.55.2.155.
47. Kunin CM, Bugg A. 1971. Binding of polymyxin antibiotics to tissues: the major determinant of distribution and persistence in the body. J Infect Dis 124:394 – 400.https://doi.org/10.1093/infdis/124.4.394.
48. Sivanesan S, Roberts K, Wang J, Chea S-E, Thompson PE, Li J, Nation RL, Velkov T. 2017. Pharmacokinetics of the individual major components of polymyxin B and colistin in rats. J Nat Prod 80:225–229.https://doi.org/ 10.1021/acs.jnatprod.6b01176.
49. Wimley WC, White SH. 1996. Experimentally determined hydrophobicity scale for proteins at membrane interfaces. Nat Struct Mol Biol 3:842– 848.https://doi.org/10.1038/nsb1096-842.
50. Huang JX, Blaskovich MA, Pelingon R, Ramu S, Kavanagh A, Elliott AG, Butler MS, Montgomery AB, Cooper MA. 2015. Mucin binding reduces colistin antimicrobial activity. Antimicrob Agents Chemother 59: 5925–5931.https://doi.org/10.1128/AAC.00808-15.
51. Schwameis R, Erdogan-Yildirim Z, Manafi M, Zeitlinger M, Strommer S, Sauermann R. 2013. Effect of pulmonary surfactant on antimicrobial activity in vitro. Antimicrob Agents Chemother 57:5151–5154.https:// doi.org/10.1128/AAC.00778-13.
52. Cheah S-E, Wang J, Turnidge JD, Li J, Nation RL. 2015. New pharma-cokinetic/pharmacodynamic studies of systemically administered colistin against Pseudomonas aeruginosa and Acinetobacter baumannii in mouse thigh and lung infection models: smaller response in lung infection. J Antimicrob Chemother 70:3291–3297.
53. Aoki N, Tateda K, Kikuchi Y, Kimura S, Miyazaki C, Ishii Y, Tanabe Y, Gejyo F, Yamaguchi K. 2009. Efficacy of colistin combination therapy in a mouse model of pneumonia caused by multidrug-resistant Pseudomo-nas aeruginosa. J Antimicrob Chemother 63:534 –542.https://doi.org/10 .1093/jac/dkn530.
54. Duff GW, Atkins E. 1982. The inhibitory effect of polymyxin B on endotoxin-induced endogenous pyrogen production. J Immunol Meth-ods 52:333–340.https://doi.org/10.1016/0022-1759(82)90005-9. 55. Cockerill F, Patel J, Alder J, Bradford P, Dudley M, Eliopoulos G. 2013.
Performance standards for antimicrobial susceptibility testing: 23rd
in-formational supplement; M100-S23. Clinical and Laboratory Standards Institute, Wayne, PA.
56. Bivas-Benita M, Zwier R, Junginger HE, Borchard G. 2005. Non-invasive pulmonary aerosol delivery in mice by the endotracheal route. Eur J Pharm Biomed 61:214 –218.https://doi.org/10.1016/j.ejpb.2005.04.009. 57. Cheah S-E, Bulitta JB, Li J, Nation RL. 2014. Development and validation
of a liquid chromatography–mass spectrometry assay for polymyxin B in bacterial growth media. J Pharm Biomed Anal 92:177–182.https://doi .org/10.1016/j.jpba.2014.01.015.
58. Rennard S, Basset G, Lecossier D, O’Donnell KM, Pinkston P, Martin P, Crystal R. 1986. Estimation of volume of epithelial lining fluid recovered by lavage using urea as marker of dilution. J Appl Phys 60:532–538. 59. Bulitta JB, Landersdorfer CB. 2011. Performance and robustness of the
Monte Carlo importance sampling algorithm using parallelized S-ADAPT for basic and complex mechanistic models. AAPS 13:212–226.https:// doi.org/10.1208/s12248-011-9258-9.
60. Bergstrand M, Hooker AC, Wallin JE, Karlsson MO. 2011. Prediction-corrected visual predictive checks for diagnosing nonlinear mixed-effects models. AAPS 13:143–151.https://doi.org/10.1208/s12248-011 -9255-z.
61. U.S. Food and Drug Administration. 1999. Guidance for industry. Popu-lation pharmacokinetics. U.S. Food and Drug Administration, Washing-ton, DC.
62. Beal SL. 2001. Ways to fit a PK model with some data below the quantification limit. J Pharmacokinet Pharmacodyn 28:481–504.https:// doi.org/10.1023/A:1012299115260.
63. Dudhani RV, Turnidge JD, Nation RL, Li J. 2010. fAUC/MIC is the most predictive pharmacokinetic/pharmacodynamic index of colistin against Acinetobacter baumannii in murine thigh and lung infection models. J Antimicrob Chemother 65:1984 –1990. https://doi.org/10.1093/jac/ dkq226.
64. Roberts KD, Azad MA, Wang J, Horne AS, Thompson PE, Nation RL, Velkov T, Li J. 2015. Antimicrobial activity and toxicity of the major lipopeptide components of polymyxin B and colistin: last-line antibiotics against multidrug-resistant gram-negative bacteria. ACS Infect Dis 1:568 –575.https://doi.org/10.1021/acsinfecdis.5b00085.