MOTIVATION, RESILIENCE, AND RURAL STUDENTS WITH LEARNING DISABILITIES
Alfred Michael Caprino, III
A dissertation submitted to the faculty at the University of North Carolina at Chapel Hill in partial fulfillment of the requirements for the degree of Doctor of Philosophy in the Department
of Educational Psychology, Measurement and Evaluation in the School of Education.
Chapel Hill 2016
© 2016
ABSTRACT
Alfred Michael Caprino, III: Motivation, Resilience, and Rural Students with Learning Disabilities
(Under the direction of Judith Meece)
As the largest category of students receiving special education services in the United States, students with learning disabilities often encounter challenges in their attempts to succeed in school (Fuchs, Fuchs, Mathes, & Lipsey, 2000; Mason & Hedin, 2011; Mastropieri, Scruggs, & Graetz, 2003; National Association of Special Education Teachers, 2015; Wagner et al., 2003). Students with learning disabilities report lower postsecondary educational aspirations (Irvin et al., 2011a) and do not achieve academically at the same level as their nondisabled peers (National Center for Learning Disabilities, 2014a). In addition, students with learning
disabilities frequently experience low levels of motivation to learn in school (Adelman & Taylor, 1983, 1990; Irvin et al., 2011a; Lichtinger & Kaplan, 2015; Melekoglu, 2011; Sideridis, 2003; Zisimopoulos & Galanski, 2009). These challenges can be compounded when students with learning disabilities reside in rural communities. For example, rural schools lack the resources to recruit psychologists, school counselors, and special education teachers to meet the needs of students with disabilities (Hardré, 2012; Irvin, Meece, Byun, Farmer, & Hutchins, 2011b).
academically and aspire educationally to levels similar to their nondisabled peers. Data used for this research were sourced from the Rural High School Aspirations study (National Research Center on Rural Education Support, 2011). A cluster analysis procedure was used to create three motivational belief profiles and two-way ANOVA procedures were used to test hypotheses regarding positive motivation beliefs serving as a protective factor. I did not find that positive motivational beliefs provided the hypothesized boost for rural students with learning disabilities in terms of their academic achievement or postsecondary educational aspirations. The findings of this study contribute to the limited research base focused on the motivational beliefs and resilience of rural high school students with learning disabilities.
ACKNOWLEDGEMENTS
This dissertation would not have been possible without the support of my family, friends, and mentors. Again, thank you to my wife, Katie, you are integral and irreplaceable. To my family, thank you for your support of my educational goals and for helping to shape me into the person I am today. I appreciate all of the sacrifices that you have made and the resilience that you have demonstrated that makes such an undertaking possible for me. To Katie’s family for their support and encouragement and for helping to drive many moving vans in pursuit of this adventure! Thank you to the Griffith family for your great friendship and support. Thank you also to Shirley Parker for your mentorship, belief in me, and encouragement to pursue this degree. Thank you too, to the many individuals too numerous to list who offered me a helping hand along the way. Your kindness will never be forgotten.
This work would not have been possible without funding provided to Dr. Judith Meece from the Institute of Educational Sciences and the Chancellor’s Fellowship generously provided to me from the Graduate School at the University of North Carolina. Receiving the Chancellor’s Fellowship and being a part of the Royster Society of Fellows has offered me the educational opportunity of a lifetime and I will be forever grateful for that.
Studying resilience has helped to strengthen me and I have drawn on several resilience-related quotes for inspiration during the dissertation process. I offer these quotes to all students struggling to succeed in school and in life. My wish for you is that you discover your unique strengths and know that there is hope in the future:
In the depths of winter, I discovered in me an invincible summer. ~Albert Camus
In order to succeed, people need a sense of self-efficacy, to struggle together with resilience to meet the inevitable obstacles and inequities of life. ~Albert Bandura
Although the world is full of suffering, it is also full of the overcoming of it. ~Helen Keller
TABLE OF CONTENTS
LIST OF TABLES ...v
LIST OF FIGURES ... vi
CHAPTER ONE ...1
Students with LD ...3
Rural Context ...4
Theoretical Framework ...5
Statement of the Problem ...6
Purpose of the Study ...6
Summary ...7
CHAPTER TWO ...8
Learning Disabilities, Educational Aspirations, and Academic Achievement ... 8
Educational Aspirations of High School Students with Learning Disabilities ...9
Academic Achievement of High School Students with LD ...11
Resilience ... 13
Sources of Risk for Students with LD ... 15
Biological and Physical Development ...15
Cognitive Development ...16
Emotional and Social Development ...18
Sources of Resilience for Students with LD ... 18
MotivationalBeliefs and Resilience ...20
Academic self-concept ...21
Academic self-efficacy ...21
Perceived cognitive competence ...23
School belonging ...23
School valuing ...25
Research summary ...26
Purpose of the Study ... 31
Research Questions ... 33
CHAPTER THREE ...34
Rural High School Aspirations Study ... 34
Consent Procedures ...35
Student Participants with LD ...35
Data Collection Procedures ...36
Current Study ... 37
LD Sample and Matching Procedures ...37
Measures ...37
LD status ...37
Clustering variables ...37
Academic self-concept ...38
School valuing ...38
School belonging ...38
Problem behaviors ...39
Dependent variables ...39
Postsecondary educational aspirations ...39
Academic achievement ...40
Analysis Plan ... 40
Preparation of Data for Analyses ...40
Matching ...40
Descriptive Analyses ...41
Cluster Analysis ...41
Analysis of Variance ...47
Research Hypotheses ...50
Hypothesis 1...50
Hypothesis 2.1...50
Hypothesis 2.2...50
Hypothesis 3.2...50
CHAPTER FOUR ...51
Data Preparation ...51
Creation of matched subsample ...51
Descriptive Analyses ...52
Dependent variables ...53
Clustering variables and validation variable ...54
Clustering variables correlation ...54
Cluster Analysis ...55
Cluster solution results ...55
Cluster descriptive statistics ...57
Cluster solution validation ...59
Clustering variables analysis of variance ...59
Naming of clusters ...62
Validation variable analysis of variance ...62
Analysis of Variance ...64
Educational aspirations analysis of variance ...65
Academic achievement analysis of variance ...67
Summary ...70
CHAPTER FIVE ...73
Resilience Theory Lens ... 73
Summary of Major Findings ... 75
Motivational Belief Profiles ...76
Motivation Profiles and Academic Achievement ...77
Cognitive challenges ...77
Teacher expectations ...78
Rural context ...79
Motivational Profiles and Educational Aspirations ...80
Motivational Resilience Model ...80
Educational Aspirations, Disability Status, and Postsecondary Transitions ...82
Implications and Limitations for Educational Psychology ... 84
Contributions to Educational Psychology ...84
Future Directions ... 86
Conclusions ... 87
LIST OF TABLES
TABLE 4.1: Gender, Ethnicity, and Grade Level of Students with LD Sample ………53
TABLE 4.2: Descriptive Statistics for Full Sample ………..…...54
TABLE 4.3: Descriptive Statistics for Students with LD Subsample ………...54
TABLE 4.4: Descriptive Statistics for Nondisabled Subsample ………...…...54
TABLE 4.5: Descriptive Statistics for Clustering Variables ………..………....55
TABLE 4.6: Clustering Variables Correlations ………..…………..………..55
TABLE 4.7: Agglomeration Schedule ………..…………..…………57
TABLE 4.8: Clustering Variable Means by Cluster ………...59
TABLE 4.9: Expected Counts in Clusters for Disability Status ………....……….60
TABLE 4.10: Clustering Variables – One-Way ANOVA Descriptive Statistics ………...……61
TABLE 4.11: ANOVA – Clustering Variables ………..…..……..62
TABLE 4.12: Problem Behavior by Cluster – One-Way ANOVA Descriptive Statistics …………...65
TABLE 4.13: ANOVA – Problem Behavior Scale by Cluster ………...…..…65
TABLE 4.14: Two-Way ANOVA – Educational Aspirations Descriptive Statistics ……….…66
TABLE 4.15: Two-Way ANOVA for Educational Aspirations ………...………67
TABLE 4.16: Two-Way ANOVA – Academic Achievement Descriptive Statistics ……….68
TABLE 4.17: Two-Way ANOVA for Academic Achievement ……….69
TABLE 4.18: Descriptive Statistics for Academic Achievement by Disability Status in Cluster 1……….………….70
TABLE 4.19: Descriptive Statistics for Academic Achievement by Disability Status in Cluster 2 ……….……….……...…………....70
TABLE 4.20: Descriptive Statistics for Academic Achievement by Disability Status in Cluster 3….………..……….……….….71
LIST OF FIGURES
FIGURE 2.1: Motivation Resilience Model ……….…..20
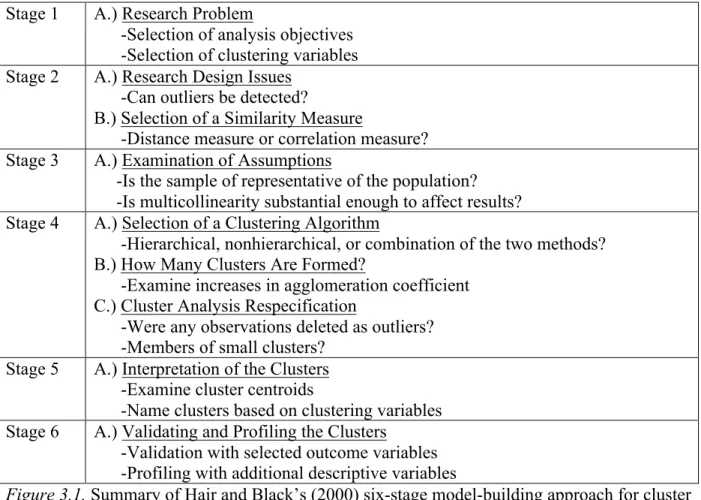
FIGURE 3.1: Summary of Hair and Black’s (2000) Six-Stage Model-Building Approach for Cluster Analysis ………...………….…….42
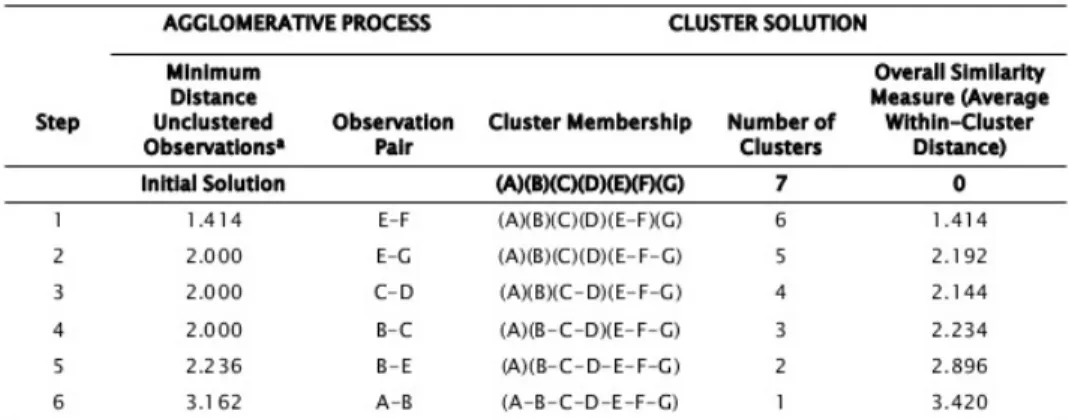
FIGURE 3.2: Agglomerative Cluster Solution Table ……….……45
FIGURE 3.3: Interaction Effect Hypothetical Scenario ……….49
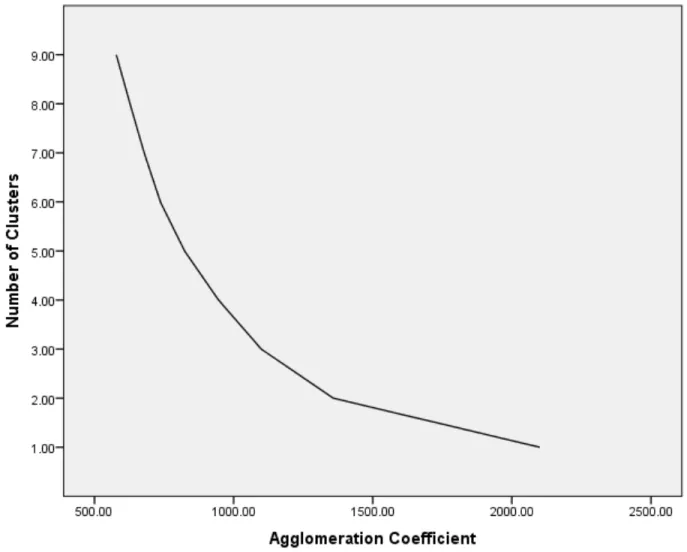
FIGURE 4.1: Agglomeration Coefficient Scree Plot ………. 58
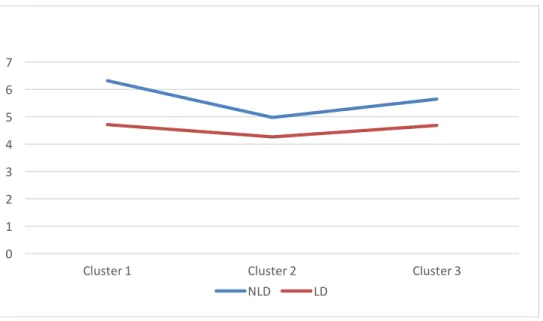
FIGURE 4.2: Motivational Belief Means by Cluster Plot ………..59
FIGURE 4.3: Cluster Descriptive Statistics...………..63
FIGURE 4.4: Academic Achievement Differences by LD Status within Clusters …………...………….71
CHAPTER ONE INTRODUCTION
Educational professionals are tasked with preparing each of America’s K-12 students for college and career readiness (National Governors Association Center for Best Practices, Council of Chief State School Officers, 2010). The sheer number of students with learning disabilities (LD) necessitate that educational researchers investigate the unique needs of these students in America’s classrooms. In the 2010 census, 4.6 million Americans reported having LD (National Center for Learning Disabilities [NCLD], 2014a). Students with LD make up approximately 5% of the total population of students in America’s public schools, or 2.4 million students (NCLD, 2014b). As the largest category of students receiving special education services in the United States, students with LD often encounter challenges in their attempts to succeed in school
(Fuchs, Fuchs, Mathes, & Lipsey, 2000; Mason & Hedin, 2011; Mastropieri, Scruggs, & Graetz, 2003; National Association of Special Education Teachers, 2015; Wagner et al., 2003).
Numerous studies and reports document statistically significant achievement disparities between students with LD and nondisabled students (Judge & Watson, 2011; Mason & Hedin, 2011; NCLD, 2014a; Shin & Bryant, 2015; Wagner et al., 2003). Although teachers and parents may identify that a student needs extra support in reading, math, or writing in the lower
Foegan, 2010; Mason & Hedin, 2011; Sideridis, 2011; Watson, Gable, Gear, & Hughes, 2012). By the high school years, some students with LD earn lower grades and grade point averages and fail courses at a higher rate than their nondisabled peers (NCLD, 2014b).
In addition, students with LD frequently experience low levels of motivation to learn in school (Adelman & Taylor, 1983, 1990; Irvin et al., 2011a; Lichtinger & Kaplan, 2015;
Melekoglu, 2011; Sideridis, 2003; Zisimopoulos & Galanski, 2009). Although research is limited, studies document links between motivation of students with LD and academic achievement (DiPerna, 2004; Gottfried, 1985). By adolescence, students with LD also report lower aspirations for postsecondary education, when compared to students without disabilities (Rojewski, 1996, 1999). Taken as a whole, low academic performance, low academic
motivation, and low educational aspirations can significantly limit the educational and
occupational attainment of these youth later in life (Bandura, Barbaranelli, Capara, & Pastorelli, 2001; Beal & Crockett, 2010; Irvin et al., 2011a; NCLD, 2014a; Rojewski, 1996, 1999).
I designed this research study to address limitations in the research base about students with LD in rural areas and the nature of the relation between motivation and educational outcomes for these students. The connection between educational aspirations and adult-life outcomes (Bandura, et al., 2001; Beal & Crockett, 2010) is further justification for the current study in which I investigate how motivational beliefs potentially moderate the relation between LD status and the educational aspirations and achievement of rural high school students.
In this first chapter, I outline the rationale for the study. I discuss challenges students with LD face in succeeding academically and their education aspirations and achievement motivation. Next, I explain rural schools’ unique qualities and focus specifically on contexts in which students with LD in rural schools find themselves. After presenting resilience theory as the theoretical framework for the study, I conclude with a problem statement, the study’s purpose, and potential study contributions.
Students with LD
Students with LD often encounter challenges in school that differ from those experienced by their peers who do not have LD. Specifically, students with LD achieve lower grades and display more frequent rates of course failure than students without LD (NCLD, 2014a). Nearly half of all students with LD perform more than three grade levels below their enrolled grade level in reading and math (NCLD, 2014b). Nineteen percent of students with LD dropped out of high school in 2011; which was approximately double the rate of the general student population (NCLD, 2014a). Additionally, approximately two-thirds of the students with LD graduate from high school with a regular diploma versus nearly three-fourths of students in the general
motivation (Adelman & Taylor, 1983, 1990; Lichtinger & Kaplan, 2015; Melekoglu, 2011; Sideridis, 2003; Zisimopoulos & Galanski, 2009) than their nondisabled peers. I provide a more detailed discussion of motivation levels for students with LD in the literature review.
Rural Context
Students with LD who live in rural communities face a myriad of challenges and obstacles to their academic success not only because they have LD but also because they encounter challenges that are particular to being educated in rural schools. Hardré (2012) described rural communities as places of low population density that are far from large metropolitan areas and where the local industry is strongly related to the geographic context (e.g., agriculture). Hardré found that due to these factors of rural communities, the schools in these areas often are small in size and have limited resources. Additionally, many families are in low socioeconomic categories because family incomes in these areas typically are well below state and national averages (U.S. Bureau of Labor Statistics, 2013; U.S. Council of Economic Advisers, 2015). Meece and colleagues (e.g., Byun, Meece, Irvin, & Hutchins, 2012; Irvin, Byun, Meece, & Farmer, 2012; Irvin et al., 2011b) highlighted several challenges that students attending rural schools face: family poverty, limited school financial resources, shortage of qualified teachers, reduced opportunities to take advanced courses and participate in school activities, geographic isolation, and low parental educational expectations. Irvin et al. (2011b) found that school characteristics (e.g., low student-teacher ratio) and schooling experiences (e.g., academic self-concept, school valuing, school belonging) can either encourage or hinder the development of rural students living in poverty.
considered to be in rural communities, only 6% of research taking place in schools has involved rural schools (Hardré, 2008). Students with LD who live in rural communities have received even less attention in the research.
Theoretical Framework
Resilience is the ability to bounce back from adversity (Luthar, Cicchetti, & Becker,
2000). Clearly, students with LD attending rural schools face adversity in their journey toward academic success (Hardré, 2012; NCLD, 2014a; Rojewski, 1996, 1999). Consequently, resilience theory is a useful framework in which to situate this study. Werner and Smith (1982, 1992, 2001) were the first researchers to view students with LD from a resilience perspective. In their seminal, longitudinal work on resilience theory, Werner and Smith followed 72 individuals, 22 of whom had LD, to assess their cognitive and psychological development during the first 40 years of their lives. The individuals with LD faced multiple challenges during childhood but were able to overcome them to lead healthy and successful lives in adulthood (Werner & Smith, 2001). Werner (1993) pointed to multiple protective factors to explain the turnaround in the lives of these individuals. Morrison and Cosden (1997) further conceptualized the presence of a LD as a risk factor that does not by itself predict adaptive or nonadaptive outcomes. Instead, other risk and protective factors interact with the LD to influence either positive or negative outcomes. Morrison and Cosden also suggested that risk factors and protective factors could be internal or external to the individual. I focus on motivational beliefs, an internal protective factor, in this study.
additional potential risk and protective factors. I investigate motivational beliefs as a potential protective factor for students with LD.
Statement of the Problem
Students with LD face significant challenges in their journey to academic success. A vastly understudied population, students with LD who live in rural communities face an additional set of challenges due to the unique contexts in rural communities. In this research study, I respond to the call for additional research on the understudied group of students with LD who live in rural communities (Irvin et al., 2011a). In my review of the literature, I found no other published studies that feature the combination of the understudied population of rural students with LD, the resilience framework, and the investigation of motivational beliefs as a protective factor. Consequently, I offer a unique approach to examining an understudied group of students in this study.
Purpose of the Study
more nuanced interpretation of findings with regard to unique configurations of motivational beliefs and their relation to educational outcomes.
Summary
CHAPTER TWO LITERATURE REVIEW
In this dissertation study, I examined the motivation beliefs of rural high school students with LD and their relation to important educational outcomes such as educational aspirations and academic achievement. More specifically, I used resilience theory to hypothesize that the
motivation beliefs of this particular group of students may serve as a protective factor or buffer, which enhances the educational outcomes for these students. To situate this study in the
literature and build a case for its necessity, I reviewed scholarship relevant to the subject matter. First, I consider the continuum of educational aspirations and academic achievement outcomes for high school students with LD. Second, I offer resilience as a useful framework through which to investigate questions regarding the motivational beliefs and educational outcomes of rural high school students with LD. Third, I discuss sources of risk and resilience for this population of students. Finally, I outline the purpose of the study and present specific research questions.
research that indicates students with LD can vary with regard to their levels of educational aspirations and academic achievement in the following sections.
Educational Aspirations of High School Students with Learning Disabilities
Educational aspirations are strongly associated with educational and occupational attainment (Bandura, Barbaranelli, Caprara, & Pastoerelli, 2001; Beal & Crockett, 2010). Educational aspirations, defined as how much education a person desires to attain, are typically measured via self-report by asking the individual how far in school he or she would most like to go (Irvin et al., 2011a). The educational aspirations of U.S. students have gradually increased during the last few decades (Goyette, 2008; U.S. Department of Education, 2005). Despite increases in educational aspirations for all U.S. students, differences between students with LD and their nondisabled peers persist.
In a seminal study on the educational aspirations of students with LD, Rojewski (1996) used data from the National Education Longitudinal Study of 1988 and found that high school students with LD in the general population held lower educational and occupational aspirations than their nondisabled peers. The percentage of students with LD who did not aspire to any postsecondary education was approximately three times that of students without LD who did not aspire to postsecondary education. Additionally, two-thirds of high school seniors without LD aspired to obtain a 4-year baccalaureate degree or graduate degree while approximately half of the students with LD aspired to less than a 4-year baccalaureate degree.
would complete a 4-year college degree, 38% said they probably would complete a 4-year college degree and 36.8% indicated they definitely or probably would not complete a 4-year college degree. Although published nearly a decade later, these findings fall closely in line with Rojewski’s (1996) results.
Students with LD who attend high schools in rural school districts also show lower educational aspirations than their nondisabled peers (Irvin et al., 2011a; Weiss, Hutchins, & Meece, 2012). Weiss et al. found that 90.7% of rural nondisabled students planned to continue their education after high school compared to only 78.5% of students with disabilities, the majority of who had LD. Additionally, Irvin and his fellow researchers (2011a) found that rural students with LD were more likely than their nondisabled peers to report that they aspired to obtain a high school diploma or general education development (GED) high school equivalency diploma and attend, but not finish, college. Students with LD were also more likely than
nondisabled students to report that they did not know the level of education to which they aspired. In contrast, nondisabled students in the sample were more likely to report that they aspired to graduate from college or earn an advanced degree than students with LD.
Though students with LD, overall, do not typically have as high of educational
aspirations as their nondisabled peers (Irvin et al., 2011a; Rojewski, 1996; Wagner et al., 2007; Weiss et al., 2012), some students with LD do hold high levels of educational aspirations. Specifically, in Rojewski’s (1996) study, 31.4% of male adolescents with LD and 31.9% of female adolescents with LD aspired to a college degree. Additionally, 5.9% of male adolescents with LD and 10.6% of female adolescents with LD wished to pursue a master’s degree, whereas 3.6% of males with LD and 5.7% of females with LD were inclined to pursue a doctor of
Wagner et al. (2007) found that 25.2% of adolescents with LD who participated in the National Longitudinal Transition Study-2 reported that they would definitely complete a 4-year college degree. In summary, though students with LD tend to have lower educational aspirations than their nondisabled peers, a portion of these students—despite their disability status—are able to maintain high educational aspirations.
Academic Achievement of High School Students with LD
Academic achievement can be measured in multiple ways including grades and standardized test results. Of the two measures, grades or grade point averages are more
predictive of postsecondary educational outcomes for U.S. high school students (Fleming, 2002; Hoffman & Lowitzki, 2005). Similar to educational aspirations, the academic achievement of high school students with LD varies with some students performing well academically and others not as well. In a study using national data, Wagner et al. (2003) analyzed results from the
National Longitudinal Transition Study-2 to investigate the academic achievement of youth with LD during secondary school. Wagner and her colleagues found a mixed picture of academic performance for these students. High school teachers in the study reported that 26.8% of
students with LD received mostly A’s and B’s while 8.3% of these students received mostly D’s and F’s. Overall, students with LD were not succeeding at a level similar to their nondisabled peers. The NCLD (2014a) reported that the average grade point average for secondary school students with LD was 2.2 compared to 2.7 for their nondisabled peers.
Wagner et al. (2003) found additional evidence that some high school students with LD struggle academically. Teachers in the study reported what proportion of their students with LD were expected to keep up with the assignments and grading expectations in their general
reported that they expected 98.9% of their students with LD to keep up in their general education classes, but only 77.5% of their students with LD actually kept up with the assignments and grading expectations of their classes. Students with LD also have a higher course failure rate than their nondisabled peers. The NCLD (2014a), for example, reported that 69% of students with LD failed one or more graded courses in secondary school compared to 47% of their nondisabled peers.
Although not as useful as grades in predicting students’ postsecondary educational outcomes (Fleming, 2002; Hoffman & Lowitzki, 2005), data from standardized tests are helpful to demonstrate the achievement disparity that exists between students with LD and their
nondisabled peers. Evidence of an achievement difference was present in the most recent available results of the National Assessment of Educational Progress (National Center for Education, Statistics [NCES], 2013). The National Assessment of Educational Progress is an assessment in reading and math that is given to more than 700,000 students in fourth and eighth grades across the US. For the 2013 National Assessment of Educational Progress, 9% of eighth grade students with disabilities earned proficient or advanced scores in reading compared to 40% of nondisabled students, students with LD made up a majority of the students with disabilities. In mathematics, 8% of eighth grade students with disabilities earned proficient or advanced scores compared to 39% of nondisabled students (NCES, 2013). Compared with nondisabled peers, students with LD face significant academic challenges as they approach high school.
which were indicative of how far above or below grade level students were performing. The students with LD in the sample were performing an average of 3.4 years below their actual grade level in reading and 3.2 years below their actual grade level in math.
In summary, students with LD do not achieve at a level similar to their nondisabled peers on classroom grades or on standardized tests. However, a small number are succeeding academically, when grades and test scores are examined (NCES, 2013; NCLD, 2014a; Wagner et al., 2003). An important question thus emerges from prior research: Why are some students with LD able to achieve academically and maintain high educational aspirations while other students with LD are not? This heterogeneity within samples of students with LD needs further
investigation.
Resilience
participants with LD were satisfied with their jobs and marriages and maintained healthy levels of self-efficacy and psychological well-being in adulthood despite the challenges that they faced as children (Werner & Smith, 2001). Werner (1993) offered several reasons, or protective factors, to explain the turnaround in the lives of these individuals with LD: positive temperament and social skills, self-efficacy and internal locus of control, supportive home environment and effective parenting skills, the presence of supportive adults, and effective transition planning. Encouraging other researchers to build upon Werner and Smith’s research, Wong (2003) called for more research that used resilience theory to study students with LD.
Resilience theory guided the current study. While students with LD face many
challenges in their pursuit for academic success (Morrison & Cosden, 1997), some students with LD succeed in school and aspire to continue their education. Positive forms of motivation (e.g., high self-efficacy, school valuing, and school belonging) in educational settings may as
protective factors to promote academic achievement and educational attainment (Skinner,
Pitzser, & Steele, 2013; Yeager & Dweck, 2012). Strong links between high levels of motivation and academic achievement are well established (Broussard & Garrison, 2004; Fortier, Vallerand, & Guay, 1995; Gottfried, 1990; Lepper, Corpus, & Iyengar, 2005; Pintrich & de Groot, 1990). To date, limited research has examined the educational resilience of students with LD.
Guided by a resilience framework, I examined motivational beliefs as a potential source of resilience for students with LD. In the next sections, I describe sources of risk and resilience for students with LD. Offering a unique research contribution, this study focused on adolescents attending rural high schools. The period of adolescence poses many challenges for young people, regardless of disability status. Rural schools also have unique features that positively and
Sources of Risk for Students with LD
Adolescence typically is described as a transitional stage between childhood and
adulthood and spans the ages of 10 to 20 (Wigfield, Byrnes, & Eccles, 2006). Adolescence is a time of considerable development for young people as they experience changes across physical, cognitive, social and emotional domains. In the following sections, I describe the changes taking place in the multiple domains of development during this stage, how students with LD might experience them differently from typically-developing adolescents, and the challenges associated with those differing experiences.
Biological and Physical Development
Adolescents experience a biological stage of physical growth called puberty in which they gain physical stature and develop secondary sex characteristics (Wigfield et al., 2006). Adolescents’ brains also grow and develop during this period. Reorganization of synaptic connections occurs, which results in more efficient processing of information, and
neurotransmitters in the emotional centers of the brain change, resulting in increased emotional activity (Wigfield et al., 2006). These growth processes occur for both typically-developing adolescents and for individuals with LD though the brains of adolescents with LD may differ in particular ways. Research suggests that LD are related to subtle neurological damage during the fetal period or during childhood (Horowitz, 2014). It is likely that this subtle neurological damage persists through the period of brain growth during adolescence for individuals who continue to experience learning difficulties. Though all adolescent brains likely increase in capacity and function, the brains of adolescents with LD continue to differ in their areas of impairment. The physical development of the brain during adolescence has implications for
Cognitive Development
Adolescents improve in their ability to think abstractly, consider hypothetical situations, use advanced information processing strategies, think simultaneously of multiple aspects of a problem, and reflect on themselves and complex issues (Larson, Lampkins-Uthando, &
Armstrong, 2014; Wigfield et al., 2006). One particular area of the brain that experiences great change during the adolescent period is the prefrontal cortex, which gives the teenage brain greater capacity for executive functioning and decision making (Kuhn, 2009). The increase in skills related to executive functioning such as monitoring, organizing, planning, strategizing, and inhibition (Kuhn, 2009) aids adolescents in improving their learning and problem-solving
capacity and in forming more nuanced self-concepts, thinking about the future, and developing perceptions and understanding of others (Wigfield et al., 2006). Students with LD often
experience challenges with skills related to executive function such as planning, organizing, and evaluating their schoolwork as well as difficulties with maintaining focus (Dunn & Curran, 2012). These executive-function skill deficits can make schoolwork in reading, writing, and mathematics more challenging for students with LD.
peers, students with LD often have deficits in working memory, which can play a role in their performance on various academic tasks at school (Alloway & Gathercole, 2006; Maehler & Schuchardt, 2009; Masoura, 2006; Pickering, 2006; Swanson, 1994, 2003; Swanson & Siegel, 2001).
A third cognitive capacity that influences academic performance is the speed with which individuals can process information (Kail, 1991; Kail & Ferrer, 2007). Students with LD, however, often have deficits in processing speed (Calhoun & Dickerson Mayes, 2005). Calhoun and Dickerson Mayes found that the students with LD in their sample received lower scores on the Processing Speed Index compared to the group mean IQ score for students with LD on the Wechsler Intelligence Scale-Third Edition (WISC-III; Wechsler, 1991). Seventy percent of the students with LD scored lower than expected on the Processing Speed Index based on their Full Scale IQ scores.
Emotional and Social Development
It is important to consider the emotional and social development of adolescents, including those with LD. During the adolescent period, individuals desire more autonomy and increase the amount of time that they spend with peers in relation to the time they spend with family
(Trentacosta & Izard, 2007). This push for autonomy coincides with the important adolescent task of forming an identity (Erikson, 1968). Academically, adolescents can develop a positive or negative identity as a student based on their experiences in school (Roeser & Lau, 2002). Roeser and Lau suggested those with a positive identity as a student have had a history of positive academic and social experiences in the classroom, feel positive emotions toward academics, maintain high levels of academic self-efficacy, hold positive conceptions of themselves as students, and are committed to learning. Alternatively, those with a negative student identity have a history of academic difficulties, dysfunction in social relationships with peers, and negative emotions related to academics. They also experience low levels of confidence in their academic abilities, become frustrated with themselves as students, and hold low aspirations for future educational attainment (Roeser & Lau, 2002). Certainly students with LD are at risk for developing negative identities as students due to the difficulties they often experience with school achievement.
Sources of Resilience for Students with LD
academically outperform peers who believe that intelligence is fixed or cannot be changed. Similarly, Skinner, Pitzer, and Steele (2013) offered a model of motivational resilience that may be helpful in understanding how positive motivational beliefs can possibly serve as a protective factor for students with LD (see Figure 2.1). Skinner and colleagues proposed that motivational resilience is associated with engagement and reengagement with challenging academic tasks while motivational vulnerability is related to disaffection and giving up on challenging academic work. Students are motivationally resilient if they use adaptive academic coping strategies and motivationally vulnerable if they use maladaptive academic coping strategies.
The current study drew on this body of research to focus on motivational beliefs as possible protective factors. A great deal of research has associated motivational beliefs with positive educational outcomes for students (Anderman, 2002; Finn & Frone, 2004; Goodenow, 1993a, 1993b; Guay, Marsh, & Boivin, 2003; McMahon, Parnes, Keys, & Viola, 2008; Roeser, Midgely, & Urban, 1996; Watson, Battisch, Schaps, & Delucchi, 1996). In this study, I
Figure 2.1. Motivational resilience model. Adapted from “Coping as Part of Motivational Resilience in School: A Multidimensional Measure of Families, Allocations, and Profiles of Academic Coping,” by E. Skinner, J. Pitzer, and J. Steele, 2013, Educational and Psychological Measurement, 73, p. 812. Copyright 2013 by Sage.
Motivational Beliefs and Resilience
motivational beliefs can serve as a protective factor and propel rural high school students with LD toward greater academic achievement and higher educational aspirations.
Academic concept. Academic concept has been defined as “a person’s self-evaluation regarding a specific academic domain or ability” (Trautwein, Ludtke, Marsh, Koller, & Baumert, 2006, p. 789). Academic self-concept is related to multiple indicators of motivation including interest and persistence (Skaalvik & Valas, 2010), and it has a reciprocal relation with academic achievement meaning that prior self-concept affects subsequent achievement and vice versa (Guay et al., 2003). Stone and May (2002) compared the academic self-concepts of a group of high school students with LD to a control group of nondisabled students and found that the students with LD reported statistically significantly lower academic self-concepts than did their nondisabled peers.
Academic efficacy. Academic efficacy, another form of academic self-perception, has been defined as how one perceives one’s skills and abilities to successfully complete academic tasks (Bandura, 1986). Self-concept and self-efficacy share similarities, such as a definitional core of perceived competence, while also displaying important differences such as how self-concept tends to predict affective outcomes and self-efficacy tends to predict
cognitive outcomes (Bong & Skaalvik, 2003). Due to the overlapping definitions of academic self-concept and academic self-efficacy, it would be likely that students with LD might also display lower academic self-efficacy and lower self-concepts when compared to their nondisabled peers.
lower levels of academic self-efficacy when compared to the two groups of high-achieving nondisabled students and a group of low-average achieving nondisabled students. Students with LD showed no differences in academic self-efficacy when compared to low-achieving
nondisabled students. The authors of the study hypothesized that students with LD may display low academic self-efficacy due to the absence of sources which can foster positive self-efficacy as described by Bandura (1997): successful past performance, identification with efficacious models, support from others, and emotional arousal during task performance. Lackaye and Margalit (2006) also found that academic self-efficacy along with academic achievement, negative mood, and hope predicted how much effort students with LD would put forth in their schoolwork.
Perceived cognitive competence. Academic self-concept and academic self-efficacy share a conceptual core of perceived competence (Bong & Skaalvik, 2003). Self-determination theory researchers, Grolnick and Ryan (1990) studied the perceived competence of elementary students with LD. Deci and Ryan (2002) developed the self-determination theory, a seminal theory of motivation, in which goal-directed behavior is thought to be directed by an individual’s need to satisfy three key psychological needs: competence, the need to master something;
autonomy, the need to have agency; and relatedness, the need to feel connected to others. In their study, Grolnick and Ryan (1990) found that students with LD reported lower levels of perceived cognitive competence than nondisabled students in a matched-IQ control group. The students with LD in the study did not display a difference in perceived cognitive competence when compared to a group of low achieving students. These results mirror the findings of the Lackaye and Margalit (2006) study in which students with LD showed lower levels of academic self-efficacy than high achieving and low-average achieving students, but showed no differences from low achieving students. In general, students with LD report lower levels of academic self-concept, academic self-efficacy, and perceived cognitive competence in comparison to high achieving and low-average achieving peers who are not disabled. Students with LD showed no differences, however, when compared to low achieving nondisabled peers.
School belonging. School belonging is the degree to which students perceive that they are included as members of the school or classroom community and includes how students feel about being accepted, respected, and supported within the school social environment
belonging, along with expectancies and values, influenced classroom effort and achievement. In a separate study, Goodenow (1993b) found school belonging to be highly associated with self-reported school motivation and was correlated, to a lesser degree, with student grades. In their study of young adolescents, Roeser et al. (1996) also found a relation between school belonging and final-semester academic grades. Additionally, Anderman (2002) used data from the
National Longitudinal Study of Adolescent Health to find that student perceptions of belonging were related to higher student grade-point averages.
In a study related to school belonging, motivation, and achievement, Solomon, Watson, Battisch, Schaps, and Delucchi (1996) implemented an intervention program—the Child Development Program—for improving the sense of community in elementary schools. The researchers found that the program improved the students’ sense of community in their schools, but an effect was not found between the improved sense of community and achievement, in terms of standardized achievement test scores or on a performance-based measure of reading comprehension. There was, however, a positive relationship between an increased sense of community and measures of achievement motivation and intrinsic motivation. The studies by Anderman (2002), Goodenow (1993a, 1993b), Roeser et al. (1996), and Watson et al. (1996) provide evidence that students’ sense of school belonging can play an important role in both their motivation and achievement.
of the participants in the study were classified as having mild disabilities including LD and emotional disabilities. The researchers found that school belonging was related both to academic self-efficacy and school satisfaction and suggested that a link between academic self-efficacy and academic performance could be inferred from their results. McMahon and colleagues also suggested that school belonging is an important part of academic engagement for students with disabilities because they are more likely to be engaged academically in school when they believe they are included in the school community. Clearly, a sense of school belonging is just as important for students with disabilities as it is for their nondisabled peers in terms of educational outcomes. In summary, a sense of school belonging or inclusion in the school community can be an important facet of both disabled as well as nondisabled students’ schooling experiences and can contribute to critical educational outcomes.
School valuing. School valuing has been defined as the importance students place on the schooling experience and whether students see school as a valuable pathway to opportunities in life (Irvin et al., 2011a). Similarly, Voelkl (1997) characterized school valuing as how students view school as being a vehicle to facilitate personal advancement and useful in reaching
important life objectives. Finn and Frone (2004) found that school identification, which included items related to school valuing, or whether students found school to be worthwhile and critical to their future, predicted academic achievement and classroom engagement for adolescents.
lead to negative educational outcomes such as low academic achievement, low school
engagement, and school dropout (Reschly & Christenson, 2006). In summary, school valuing is another important facet of the schooling experience for both learning disabled as well as
nondisabled adolescent students and can be associated with important educational outcomes. Research summary. Clearly, motivational beliefs play an important role in the pursuit of educational success for all students, including students with LD. Despite several researchers’ findings shared in this review that students with LD have been largely characterized to possess low levels of motivation, some more recent scholarship has suggested otherwise. Irvin et al. (2011a) found that the motivational beliefs (i.e., academic self-concept, school belonging, school valuing) of rural high school students with LD exist across a continuum. In their study, Irvin and his fellow researchers used a cluster analysis procedure to find six clusters of motivational belief profiles in their sample. While there were students characterized as low on all motivational beliefs (e.g., school valuing, academic self-concept, belonging), some clusters that included students with LD, reported positive motivation beliefs as well as high educational aspirations (see Irvin et al., 2011a). Positive motivational beliefs, it seems, served these students well. Perhaps these adaptive motivational beliefs enhanced the schooling experience for the students and in turn helped them to form aspirations for higher education. Building on Irvin et al.’s (2011a) study, I examine whether positive motivational beliefs help make rural high school students with LD more resilient in terms of their educational aspirations and academic achievement.
Rural Context: Sources of Both Risks and Resilience
attend rural high schools are likely to have achieved lower rates of educational achievement when compared to their peers in nonrural settings (Brown & Swanson, 2003; Hardré & Sullivan, 2008; Roscigno & Crowley, 2001). Additionally, rural students have a tendency to report
comparatively lower educational aspirations than their peers that attend nonrural schools (Gandara, et al., 2001). First, I focus on the challenges and benefits students in rural contexts face.
Students attending schools in rural areas face a multiplicity of challenges in achieving and succeeding in school. One common challenge facing rural students is that their schools often have financial constraints and therefore cannot offer the same degree of support, resources, and extra-curricular activities as can nonrural schools (Hardré & Hennessey, 2010). The financial constraints and subsequent low salaries of rural districts also impact their ability to retain teachers. In addition, rural districts often serve largely minority student populations from high poverty areas with low parent education levels, characteristics that can be associated with low achievement and low school success (Hardré & Hennessey, 2010).
regarding academic program enrollment could hinder the pursuit of educational goals and plans for these students.
A number of researchers have voiced concerns regarding rural schools’ difficulties in recruiting and retaining highly qualified teachers and how this impacts negatively the quality of education that rural students receive (e.g., Barton, 2003; Berry, Petrin, Gravelle, & Farmer, 2011; Brownell, Bishop, & Sindelar, 2005; Hodge & Krumm, 2009; Kossar, Mitchem, & Ludlow, 2005; Ludlow, 1998; Purcell, East, & Rude, 2005; Weiss et al., 2012). For rural
students with LD, this problem is compounded because there is a shortage of high-quality special education teachers across the United States (Billingsley, 2004; Billingsley & McLeskey, 2004; McLeskey, Tyler, & Flippin, 2004; Thornton, Peltier, & Medina, 2007).
While rural schools face certain challenges due to their unique profiles, they also possess some beneficial educational characteristics. Hardré and Hennessey (2010) found that the close-knit small classes of rural schools could be leveraged to provide close role modeling and
individual attention for students. Similarly, Irvin et al. (2011b) discussed several aspects of rural schools that promote positive development: small school and class sizes that facilitate supportive student-teacher relationships, wider grade-spans within schools that decrease school transitions, and close community-school ties that permit community engagement in schools. The positive aspects of rural schools may assist in the development of positive motivational beliefs that serve as protective factors for students with LD.
and educational aspirations than their nondisabled peers, though some portion of rural students with disabilities maintain high levels of motivational beliefs and educational aspirations. While the study by Irvin and colleagues contributed to the limited literature focused on rural students with LD, the authors did not address the possibility of motivational beliefs serving as a protective factor for these students. I address this research limitation in my dissertation study.
Variable-Centered Versus Person-Centered Approaches
of other researchers who have used a person-centered approach, I articulate my purpose for this approach and indicate how I built upon these researchers’ work in the current study.
Roeser and Peck (2003) used a person-centered approach in their study of early adolescents and academic achievement. They reported that unique configurations of social-demographic, social-contextual, psychological, and behavioral variables contributed to young adolescents’ educational choices and achievement. A group of students with non-college educated parents who reported positive motivational and cognitive aptitudes enroll in college at similar rates as a group of White, male adolescents whose parents were wealthy and educated parents. The use of a variable-centered approach by Roeser and Peck in this study would not have provided this specific result or the general richness of information about the particular patterns of variables that were associated with educational outcomes for these students.
Irvin et al. (2011a) also used a person-centered approach to investigate particular
Students who reported other configurations of motivational belief variables did not hold the same educational aspirations. For instance, fewer students with LD who reported low levels of
academic self-concept, and school valuing, and school belonging planned to obtain an advanced degree than would be expected by chance. Irvin and colleagues’ use of the person-centered approach allowed for a nuanced level of interpretation that would not have been possible with a variable-centered approach.
There were limitations to Irvin et al.’s (2011a) study. Irvin and colleagues used contingency-table analysis to investigate whether motivational beliefs were associated with educational aspiration and did not examine interaction effects. Therefore, the analysis did not test whether motivational beliefs moderate the risks associated with LD status to promote positive educational outcomes. Another limitation of Irvin et al.’s study is that they did not use matched samples for students with LD and nondisabled students. The number of nondisabled students in Irvin and colleagues’ study was much greater than the number of students with LD. In this dissertation study, I built on Irvin et al.’s study by using matched samples and testing moderation effects.
Purpose of the Study
In this study, I examined the relation between LD status, motivation beliefs, and educational aspirations as well as the relation between LD status, motivation beliefs, and academic achievement for rural high school students with LD. Additionally, I sought to
determine whether positive motivation beliefs serve as a protective factor or as a buffer for rural students with LD in regard to their academic achievement and postsecondary educational
(2011a) used a person-centered approach to find six configurations of motivational beliefs, which were used in a follow-up analysis to find that rural high school students with LD were more likely to hold negative motivational beliefs and lower educational aspirations than their nondisabled rural peers; some rural students with LD, however, did have positive motivational beliefs and high educational aspirations. Irvin and colleagues’ use of the person-centered approach to analyze the specific profiles of motivational beliefs of rural students with LD was useful, but as mentioned, the study had several limitations.
Research Questions
1.) Can distinct profiles of motivational beliefs be identified in the sample using cluster analysis?
2.) Do these distinct profiles of motivational beliefs moderate the relation between LD and educational aspirations?
3.) Do these distinct profiles of motivational beliefs moderate the relation between LD and educational achievement?
CHAPTER THREE METHOD
In this chapter, I present a description of the Rural High School Aspirations (RHSA) study. Next, I provide information regarding participants, procedures, and measures used in the study, as well as plans for analysis. The chapter ends with hypotheses for each of the research questions.
Rural High School Aspirations Study
This study drew on data collected as part of the RHSA study. The RHSA study was funded by the U.S. Department of Education (Institute of Education Sciences), and it was
designed to gain insight into: 1) the educational, vocational, and residential plans and aspirations for the future of rural high school students; 2) the activities which rural high school students engage in to prepare and plan for postsecondary education, work, and adult life; and 3) how school experiences, geographic location, peer relations, and characteristics of the community influence rural high schools students’ aspirations and preparatory activities. Members of the RHSA study research team used surveys and interviews to collect information from rural high school students, their parents, teachers, and school administrators. The researchers collected information from 73 rural high schools across 34 states during 2007 and 2008 (National Research Center on Rural Education Support, 2011). Researchers randomly selected 73 U.S. small towns or rural high schools, identified by NCES urban-centric locale codes.1 In sum,
researchers surveyed 8,754 students and surveyed and interviewed 792 parents, 667 teachers, and 69 administrators from 73 different rural schools in the United States (National Research Center on Rural Education Support, 2011).
Consent Procedures
The research team carried out student recruitment and consenting procedures according to participating districts’ policies and administrative guidelines. Some districts (28%) selected a waiver procedure in which parents received a form describing the study and signed and returned the form to decline participation. Other districts (36%), requested active consent procedures; students only participated if their parents signed a consent form. The remaining districts (34%) elected a combination of both waiver and active consent procedures. After few consent forms were returned, the researchers consulted with school principals and enacted a waiver procedure. Additionally, all participating students completed an assent form as part of their participation in the survey.
Student Participants with LD
The RHSA study team acquired complete academic self-concept, school valuing, and school belonging data on a total of 8,104 students. This sample included 463 students with LD; teachers identified via survey which students received special education services. Legal
identification procedures and definitions for LD varied across the 34 states and specific school districts. Appendix A provides a list of identification criteria for determination of LD in participating states and the number of participants with LD from each state. Local education agencies identified students with LD using a Response to Intervention (RtI) model as well as an ability and achievement discrepancy model, as this study was conducted after the (2004)
used to identify students with LD. For 13 of the 34 states, criteria information was not publicly available through searches of state and school district websites.
Data Collection Procedures
Data collection for the RHSA study occurred during the 2007-2008 school year. Students and teachers completed surveys during the school day at the respective schools. The student survey consisted of 49 items and included the following student constructs: parent respect and identification, perceived family income and economic hardship, family responsibility, academic self-concept, school valuing, school belonging, place-based education, postsecondary preparation activities, rural identity, and perceptions of local job opportunities (Byun, Carver Walton,
Meece, Irvin, & Hutchins, 2011). A team of trained researchers from the University of North Carolina at Chapel Hill administered the student survey in a group setting such as the school cafeteria (Irvin et al., 2011b). Students were seated in such a manner as to protect the confidentiality of their responses. One of the researchers led the administration by verbally giving instructions to the survey while other members of the team monitored students’ progress and assisted students if necessary.
Current Study LD Sample and Matching Procedures
Due to missing student data on the variables of interest, the sample used in the analyses consisted of 303 participants with LD. I constructed a matched sample of 303 nondisabled participants through an individual matching procedure based on the school that students attended and then by gender, ethnicity, and grade level. The created nondisabled subsample had similar proportions concerning gender, ethnicity, and grade level to the LD subsample. The rationale and specific steps for the matching procedure are described in the analysis plan.
Measures
To examine motivation beliefs and educational aspirations of students with and without LD, I used several separate measures from the RHSA study. I describe these measures below along with measures to collect information regarding LD status and academic achievement. LD status. The teacher survey included items to gather information on students’ LD status. Teachers marked all that applied in response to a question focused on whether the student for which they were completing the survey was receiving any special services. Response choices listed in which students were receiving special services included: autism, deaf-blindness,
deafness, dropout prevention, emotional disturbance, hearing impairment, mental retardation, multiple disabilities, orthopedic impairment, other health impairment, specific LD, speech or language impairment, traumatic brain injury, and visual impairment.
Academic self-concept. I used a scale created by Jodl, Michael, Malanchuk, Eccles, and
Sameroff (2001) to assess students’ academic self-concept. The scale included five items. In the five items, students were asked to rate themselves in comparison to their classmates in how good they were in multiple school subjects including, math, science, English/language arts, social studies, and other classes. These ratings were made on a seven-point scale (1 = not good at all to 7 = very good). Ratings were averaged across items to create a composite score. A higher score indicated higher academic self-concept. Byun et al. (2011) conducted an exploratory factor analysis (EFA) of the scale and discovered that the five items on the scale formed a single factor that accounted for 50% of the variance with item loadings ranging from .52 to .79. Byun and colleagues also reported a Cronbach alpha coefficient of internal consistency of .73 for the total sample.
School valuing. I used a scale, adapted from previous measures created by Voelkl
(1996), Lapan, Gysbers, and Petroski (2001), and Jodl et al. (2001), to assess school valuing. The scale consisted of five items. In the five items, students were asked to rate how they valued school and viewed it as a way toward subsequent opportunities later in life on six-point Likert-type scale (1 = strongly disagree to 6 = strongly agree). A higher score indicated higher school value and composite scores were determined through calculating the mean score across items. Byun et al. (2011) conducted an EFA of the scale and discovered that the five items formed a factor that accounted for 39% of the variance with item loadings ranging from .54 and .82. Byun and colleagues also reported a Cronbach alpha coefficient of internal consistency of .85 for the total sample.
School belonging. I used a scale adapted from previous measures by Hagborg (1994,
the 11 items, students were asked to rate their feelings of personal belonging, respect, and support in school on a five-point Likert scale (1 = completely false to 5 = completely true). A higher score indicated high school belonging and composite scores were calculated from mean scores across the items. Byun et al. (2011) conducted an EFA of the scale and found that the 11 items on the scale formed a single factor that accounted for 52% of the variance with item loadings between .54 and .79. Byun and colleagues also reported a Cronbach alpha coefficient of internal consistency of .90 for the total sample.
Problem behaviors. The problem behaviors validation variable consisted of two items
from the teacher survey, which included questions about the frequency that students start fights and get in trouble at school. Teachers completed a 7-point Likert-type scale on the items of interest as well as on other student characteristics. The first item ranged from 1 = never gets in trouble at school to 7 = always gets in trouble at school. The second item ranged from 1 = never gets in a fight to 7 = always gets in a fight. I examined these items for skewness and kurtosis and found the values to be within an acceptable range (Kline, 2005). To create a problem variable, I averaged the two items. I also examined correlations between the two items. The results indicated a statistically significant correlation, r(594) = .65, p < .05. Cronbach’s alpha for the problem behavior scale was .79.
Dependent variables. Students’ self-reports of educational aspirations and teacher’s reports of students’ grades served as the dependent variables for the proposed analyses.
Postsecondary educational aspirations. I used one item adapted from the National
Educational Longitudinal Study of 1988 (NELS:88) and ELS:2002 to assess students’
know”). I coded the response choice “don’t know” as zero because students answered the question, but they did not have a clear educational plan. The educational aspirations item was treated as a continuous variable in analyses (0 = “don’t know” to 7 = “MD, PhD, or other
advanced degree”). Other published researchers (e.g., Byun et al., 2012; Irvin et al., 2011a; Irvin et al., 2011b; Meece et al., 2013) have used this approach when analyzing RHSA data.
Academic achievement. Teacher report informed academic achievement. Teachers
responded to the question: Which “best describes this student’s grades in school this year?” by selecting from a range (1 = below D’s to 8 = mostly A’s). I used teacher-reported grades as a continuous variable, which is an approach that has been used in a previously published study based on RHSA data (Irvin et al., 2011b).
Analyses Preparation of Data for Analyses
First, I included only students who had both completed the student survey and had a teacher survey completed on their behalf in the current study in the analyses. Of the N = 8,104 students included in the RHSA study data set, 7,401 students had data from both student and teacher surveys. Second, I removed student whose teachers identified them as having disabilities other than LD, as I focused on students with LD and their nondisabled peers in this study. This step included students with emotional behavioral disorders (n = 53) and students with physical disabilities or other types of disabilities (n = 440). A total of N = 6,908 students remained in the sample after data cleaning including (n = 6,469) nondisabled students and (n = 303) students with LD. I used a matching procedure to balance the subsamples of students with LD and nondisabled students.
first matching variable because procedures for the identification for students with LD varied across state and school systems as described earlier. Therefore, matching occurred first school-by-school and then within each school. Within each school, I matched on gender, ethnicity, and grade level. Matching was based on gender and ethnicity because of the disproportionality evident in these variables within the larger population of students with LD (Coutinho & Oswald, 2004; Marder, Levine, & Wagner, 2003). Grade level was included to account for differences in students’ ages and years of schooling.
Descriptive Analyses
To prepare for the cluster analysis, I calculated descriptive statistics, including means, standard deviations, skewness, and kurtosis for all dependent variables. Additionally, I
examined the data for outliers and correlations between clustering variables, which can both distort cluster analysis results. I used SPSS (Version 22) for all statistical analyses in this study. Cluster Analysis
Stage 1 A.) Research Problem
-Selection of analysis objectives -Selection of clustering variables Stage 2 A.) Research Design Issues
-Can outliers be detected?
B.) Selection of a Similarity Measure
-Distance measure or correlation measure? Stage 3 A.) Examination of Assumptions
-Is the sample of representative of the population? -Is multicollinearity substantial enough to affect results? Stage 4 A.) Selection of a Clustering Algorithm
-Hierarchical, nonhierarchical, or combination of the two methods? B.) How Many Clusters Are Formed?
-Examine increases in agglomeration coefficient C.) Cluster Analysis Respecification
-Were any observations deleted as outliers? -Members of small clusters?
Stage 5 A.) Interpretation of the Clusters -Examine cluster centroids
-Name clusters based on clustering variables Stage 6 A.) Validating and Profiling the Clusters
-Validation with selected outcome variables -Profiling with additional descriptive variables
Figure 3.1. Summary of Hair and Black’s (2000) six-stage model-building approach for cluster analysis.
There are several important decisions that a researcher must make when conducting a cluster analysis using Hair and Black’s (2000) six-stage model building approach. The first decision is the selection of clustering variables. As previously mentioned, I used academic self-concept, school valuing, and school belonging to form profiles of motivational beliefs. The next consideration in the cluster analysis process is to screen for outliers in the data. This is an important step because Hair and Black have suggested that the presence of outliers in the data can distort the clustering process.
squared Euclidean distance when there is a low degree of intercorrelation between clustering variables and the Mahalanobis distance when there is a high degree of intercorrelation between clustering variables. Correlations between variables of .90 and higher are potentially
problematic for analyses (Tabachnick & Fidell, 2012), which guided my decision on a measure of similarity. The Euclidean distance represents the similarity of two observations to one another across the variables of interest. Hair and Black (2000) recommended using the Euclidean
squared distance as opposed to the simple Euclidean distance as a measure of similarity because computations are quickened and it is the preferred measure when using Ward’s (1963) method of clustering.
If correlations between the clustering variables exceeded .90, then I planned to use the Mahalanobis distance as a measure of similarity because highly intercorrelated variables can overweight one set of variables and distort cluster analysis results. Hair and Black (2000) suggested using the Mahalanobis distance as a measure of similarity when clustering variables are highly intercorrelated because it sums the pooled within-group variance-covariance thereby adjusting for highly intercorrelated variables. If correlations between the clustering variables did not exceed .90 then I planned to use the squared Euclidean distance.