Seasonal Variations in Radon-222 Soil Fluxes and Canopy Inventories in Brazilian Amazonian
Honors Thesis Essay Nicole Curnes
Bachelor of Science in Environmental Sciences University of North Carolina at Chapel Hill
ABSTRACT
The role of Amazonian tropical rainforests in the global carbon cycle as a net sink for carbon dioxide remains a source of controversy due to difficulties in calculating differences between immense photosynthetic and respiration fluxes. A new method for tracking net carbon dioxide fluxes utilizes a combination of canopy inventory and soil flux measurements of the noble gas Radon-222 to determine canopy-atmosphere gas exchange rates (Martens et al., 2004). I utilized canopy and soil flux Radon-222 data collected during 2000-2004 to search for a positive correlation between temporal variations in these two parameters between the wet and dry seasons. No statistically significant correlation was found between the two parameters, however, a visual trend was seen in which radon soil fluxes and canopy concentrations both increased during the dry season and decreased during the wet season. It is possible that other factors, such as storm events, influence radon canopy concentrations thus obscuring a quantitative relationship with soil fluxes. A future goal of this project is to continue Radon-222 work in Brazil in collaboration with Brazilian colleagues at the Federal University of West Pará (UFOPa).
RESUMO
INTRODUCTION
The Amazon rainforest is critical to understanding the global carbon dioxide budget. The forest has a rapid and massive exchange of carbon dioxide daily. During the day, there is a net uptake of carbon dioxide due to photosynthesis; by night there is an equally huge net release through root respiration (Grace et al., 1995). These fluxes are difficult to quantify because of their sheer magnitude, and their measurements are subject to potentially significant uncertainties (Kruijt, 2004) . In 1995, Grace et al. published a paper that determined the rainforest to be a massive sink for carbon dioxide, taking up 8.5+2.0 moles/m2*year. Their study implied that tropical rain forests were important net sinks for CO2, however, the calculations done to find this flux were based on a very short time scale data set. This made the need for long-term studies of carbon dioxide flux very apparent, and the Large-Scale Biosphere Atmosphere Experiment in Amazonia (LBA-ECO) program was created through funding from Brazil, NASA and various European funding agencies. This program allowed researchers from all over the world to come to Brazil and use various resources such as flux measurement towers to study everything from soil moisture content to nutrient cycling and carbon dioxide exchanges with the soil and atmosphere (Schimel, 2004). The primary method used to study the CO2 flux was eddy covariance, which utilized rapid 3-D wind velocity and CO2 sensor measurements on eddy covariance towers to calculate the flux in and out of the canopy, as well as to account for a storage term for the carbon dioxide present within the canopy. Long-term studies using this method still found the rainforest to be a net sink for CO2 (Andreae et al., 2002), however, there was controversy over the measurements because of minimal mixing of the air within the canopy during still nights that did not account for losses of gases through horizontal drainage flow of gases down topographic depressions and stream channels (Kruijt, 2004,; Richey, 2002). A new study highlighted the error of this method by showing that a good deal of CO2 was escaping the forest via the tributaries of the Amazon River through drainage at night as well as through carbon present in
decaying organic matter getting removed by stream flow during the flooding season etc. Corrections for these losses of CO2 suggested that the rainforest either had no net uptake or loss in either direction and was potentially even a net source to the atmosphere
(Richey, 2002).
The need for a new method of tracking CO2 was clearly identified and this is when the Martens Lab starting using 222 as a tracer (Martens et al., 2004). Radon-222, a noble gas, can be used as a tracer because it has similar soil production and canopy mixing patterns as CO2and is inert, making loss from potential biological or chemical reactions essentially negligible (Trumbore et at., 1990). The study was done in the Tapajós National Forest in the Pará state of Brazil at two sites, called km 67 and km 83, based on their distance from the city of Santarém. The Martens team measured Radon-222 concentrations at various heights in the canopy, as well as its flux out of the soil. This data could then be used to calculate exchange rates and residence times of Radon-222, which then could be transferred to CO2 using an exchange rate, using the equation shown below.
covariance results when calm nighttime data previously used by that method was filtered out (Martens et al., 2004).
I had access to the dataset used in the study done by Martens et al., (2004). There is a four and a half year long data set with all of the Radon-222 concentrations from the two sites in the rainforest, as well as a two year long data set of Radon-222 soil flux data from the same sites, obtained by the Mauro Lab at UFOPa, in collaboration with the Martens Lab. For this thesis, the collaboration with the Mauro Lab in Santarem, Brazil was re-opened so that those data sets could be compared. It is a future overall goal of my project to restart data collection of Radon-222 in novel areas in Brazil, and so we worked to investigate the combined data sets in new ways, and also discussed future research options. In order for this to occur, I took an accelerated Portuguese language class in order to be able to communicate effectively with researchers in Brazil if the future research opportunities occur.
In the Amazon, there are two seasons, wet and dry, with wet season beginning around January and ending around June (Martens et al., 2004). A sinusoidal variation in both radon-222 and carbon dioxide canopy inventories follows this seasonal weather pattern as seen within the data produced by Martens et al., (2004) and other work cited by that study. Since radon and CO2 are both produced and diffuse out of the soil, I sought to determine if seasonal variability in radon soil flux had an impact on these seasonal canopy inventory variations. Gas flux is calculated with diffusion coefficient that varies greatly between diffusion through air and water. The typical values for diffusion
coefficients through air are on the order of 0.1 cm2/s, which is much faster than through water at 10-5 cm2/s on average (Cussler, 2009). During the rainy season, it is hypothesized that the soil becomes saturated with water, affecting the diffusion rate out of the soil and decreasing both the soil flux and thus the inventories of radon-222 and carbon dioxide within the canopy in the wet season. This hypothesis will be explored using the two historic and novel datasets I was granted access to.
METHODS
An accelerated Portuguese class was taken to help with collaboration with Brazil scientists involved in the LBA-ECO project. A goal of this project was to continue the progress of this work with radon-222 and in order to do that working language skills were necessary. The accelerated track combined four semesters of Portuguese language into a year and was only open to students who have completed four semesters of a different romance language, which for me was Spanish.
Since the majority of the data from the dataset was in MATLAB code, COMP 116, an introduction to scientific programming class was taken to gain the skills
necessary to work with the dataset. A code was created to calculate inventory of radon in canopy in fifteen-minute intervals for km 83 site, as well as calculate residence times of radon in the canopy.
then read into MATLAB and analysis was done to look for seasonal variation within the data.
The calibrated inventory data necessary for analysis was embedded within MATLAB code originally created by Elizabeth Veazey and Dr. Tom Shay, in the
Department of Marine Sciences at UNC-Chapel Hill. The code was run for two sites, km 67 and km 83, and the daily inventory value at noon was used to correlate to soil flux values as well as compare with soil flux seasonal variation.
RESULTS
Portuguese Results
The major tenses learned in Portuguese were present tense, past tense (imperfect and preterite), and future tense in the indicative. The use of subjunctive was introduced but not yet mastered. Overall, a working knowledge of Portuguese in listening, writing, reading, and speaking was achieved, with the greatest strength in reading and weakness in speaking.
MATLAB Function Results
Graphical results from analyzing the soil radon-222 flux data and comparing it with calculated canopy radon inventory data are illustrated below.
The MATLAB function used to calculate exchange rates, residence times and inventory produced erratic, unusable results that are not shown in this paper. Work will continue to resolve the causes of those problems.
Graph 1. Average Soil Flux Values from 07/00 to around 01/03 at site km 83, with values ranging from 56 mBq/m2*s to 9 mBq/m2*s. R2 value for the Fourier curve fitted to the data was 0.2709
Graph 4. Radon Inventory data courtesy of Liz Veazy for site 67. Red line follows general pattern of the concentration of Radon-222 within the canopy seasonally, and red stars were number of sensors working at the time of data collection
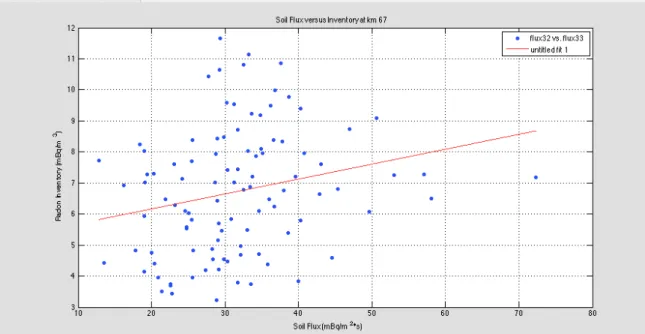
Graph 6. Correlative plot between soil flux and radon-222 inventory at km 67. The R2 value for the linear fit was 0.0538, so no positive correlation was significantly found. Table 1. Maximum and Minimum soil flux values found at two sites. Slight variations between the two sites could potentially be due to differences in soil composition, but research is needed to confirm
Max Soil Flux (mBq/ m2*s)
Min Soil Flux
(mBq/m2*s)
Km 67 72.49 12.79
Km 83 56.35 9.206
DISCUSSION
As mentioned in the results, the MATLAB function created to calculate inventory of radon in the canopy, as well as the gas exchange rate and residence time did not yield successful results. It was later discovered that the data being used in the function was uncalibrated as well as unfiltered. This could have been one of the reasons behind the erratic data. Another more likely possibility was that the code was simply not
exchange rates. More training in MATLAB is necessary to understand how to better fit the integration of concentration versus height.
The level of Portuguese obtained is most likely sufficient to be able to
communicate if sent to Brazil. One of the goals of this project is to restart collaboration with the Mauro Lab in Santarém, Brazil and continue work with radon-222. For the language portion of this collaboration, enough was learned to be able to communicate with students and researchers there. In order to keep up the language skills after taking the class, Rosetta Stone will be used. This will also improve skills up until leaving. While speaking is still the weakest skill, this is one that improves dramatically upon being surrounded by the language. This was experienced first hand with Spanish when living in the Galapágos Islands. The hope is that fluency will be achieved within a few months of living in Santarém, Brazil.
For the soil flux data at the site located at km 67, the R2 value for the fit seen in Figure X above was only 0.2634, and 0.2709 for data from the km 83 site. However, a marked increase and decrease can be seen visually as the season changes from wet to dry and back again. The dry season begins around July, which is marked on both the graphs of inventory and soil flux, and ends around January. In general, the higher data points seem to fall within the period between July and January, which is during the dry season. This could be due to faster diffusion rates out of the soil, which when the soil is not saturated with water can be on the order of 1 cm2/s. This can drop down to a value of 1*10-5 cm2/s at times when the soil is saturated with water, which is the normal diffusive rate constant for gas diffusing through liquid (Custler, 2009). The large order of
magnitude between these two rates could be a likely cause for the fluctuation in soil flux data assuming the soil is drier in the dry season. However, Goulden (2004), found relatively high soil moisture content within the soil, even during the dry season in the Amazon rain forest in Brazil, so the difference in diffusion coefficients may not be as dramatic.
An attempt to find a correlation between the soil flux and inventory data sets did not reveal much of a trend. The actual R2 values for both graphs were both less than 0.1. As can be seen in the graphs of the two (Figure XX above), the data could possibly have a very weak positive correlation, but statistically it is not possible to correlate the two. However, when comparing the graphs of soil flux and inventory at each site visually, they both appear to follow the same trend. There are a few theories for why the correlation appears visually but not statistically. First, the soil flux data obtained was only for two years, and the total number of days with soil flux data was less than 200. In contrast, there was inventory data for essentially every day from 2000 to 2004 except during times when sensors needed to be calibrated or fixed. In order to correlate the two dates for when both soil flux data and inventory data were available were matched up and then plotted. Since there were so few soil flux points in comparison to inventory, it may have been hard to see a trend that could potentially be present if more data was available.
A potential way to explore this trend further would be to take averages of wet and dry seasons on the graphs and then compare the two sets of data to find a seasonal
Another potential reason for the lack of correlation between the two could have arisen from the inventory data. As mentioned, an actual file of the data could not be found, so it was extracted from code written by Elizabeth Veazey during her work as a Research Assistant in the Martens lab. The start date of the data was assumed to be the first day of 07/00, based on the graph. It was impossible to tell if any individual days were missing within the data taken from the graph, so if a day was gone due to calibration errors or sensor malfunction, it would throw off the date off all the data after it, causing a frameshift effect. Since the soil flux data was matched to individual inventory data based on the same date, a shift in the dates of the inventory could add significant amount of error. Once again, it would be helpful to instead match up averages of seasons to find the correlation, and this would eliminate the potential source of error for any future work done.
Finally, it is possible that there isn’t a very strong correlation between soil flux and inventory of radon in the canopy. It is possible that there are other factors that affect inventory more dramatically than soil flux. One of these factors may be storm events, which would be more prevalent within the wet season. This idea is explored further in the future work section.
CONCLUSIONS AND FUTURE WORK
In conclusion, although a visual trend could be seen between soil flux and inventory, no statistical correlation between the two could be found. However, both sets of data do show a seasonal variation. It is highly possible that there is correlation between the two, but either more concrete data needs to be used in analysis, or further work needs to be done in Brazil.
For future consideration, as mentioned above, stormy weather events could have a significant impact on inventory in the rainforest canopy, especially at night. During the day there is mixing due to solar convection, but on calm nights, when a stable nocturnal boundary layer forms, inventory increases as gases become trapped beneath the canopy. Storm events hypothetically bring in turbulence and flush the gases out of the canopy, leading to very low inventory data. This topic was originally explored for this paper, but nighttime inventory data points could not be obtained in order to test this hypothesis. If this data is found, I have located the weather data needed to match up potential storm events to decreased inventory to explore whether such events can control seasonal and daily variation in radon inventory within the Amazon rainforest.
Acknowledgements: I would like to thank Dr. José Mauro Sousa de Moura for his
assistance with obtaining soil flux data, as well as his work with other Brazilian students under the direction of the Martens lab for actually taking the measurements back in 2000-2002. Thanks to Dr. Monica Rector for enrolling me in the accelerated Portuguese class. I would also like to thank Liz Veazey for the use of her MATLAB code to extract the inventory data and graphs. Also, I would like to thank Dr. Thomas Shay and Engineer Howard Mendlovitz in Marine Sciences for their assistance in finding the updated calibrated and filtered data. Finally, I would like to thank Dr. Chris Martens for his mentorship and help in connecting me to the Mauro lab in Brazil for current and potential future collaborations.
Andreae, M., Artaxo, P., Brandao, C., Carswell, F., Ciccioli, P., Da Costa, A., . . . Grace, J. (2002). Biogeochemical cycling of carbon, water, energy, trace gases, and aerosols in amazonia: The LBA‐EUSTACH experiments. Journal of Geophysical Research: Atmospheres (1984–2012), 107(D20), LBA 33-1-LBA 33-25.
Cussler, E. L. (2009). diffusion: Mass transfer in fluid systems. cambridge university press.
Goulden, M. L. (2004). Diel and seasonal patterns of tropical forest co exchange. Ecological Applications, 14(sp4), 42; 42-54; 54.
Grace, J., lloyd, J., McIntyre, J., miranda, A. C., meir, P., miranda, H. S., ... & gash, J. (1995). carbon dioxide uptake by an undisturbed tropical rain forest in southwest amazonia, 1992 to 1993. SCIENCE-NEW YORK THEN WASHINGTON-, 778-778. Kruijt, B. (2004). The robustness of eddy correlation fluxes for amazon rain forest
conditions. Ecological Applications, 14(sp4), 101; 101-113; 113.
Martens, C. S. (2004). Radon fluxes in tropical forest ecosystems of brazilian amazonia: Night-time CO2 net ecosystem exchange derived from radon and eddy covariance methods. Global Change Biology, 10(5), 618; 618-629; 629.
Richey, J. E. (2002). Outgassing from amazonian rivers and wetlands as a large tropical source of atmospheric CO2. Nature (London), 416(6881), 617; 617-620; 620. Schimel, David S (2004). The Large-Scale Biosphere-Atmosphere Experiment in the
Amazon. Ecological Applications, 14(sp4), S1.